Survival expectations in melanoma patients: a molecular prognostic model associated with aging
Nenghua Zhang, Xinyi Qiu, Xingying Chen, Cheng Du, Jingyi Dong, Xiaohong Li, Bing Chen, Lin Zhang, Yuyan Zhang

TL;DR
This study identifies a molecular model using aging-related lncRNAs to predict survival in melanoma patients, showing better performance than traditional clinical features.
Contribution
The study introduces a novel lncRNA-based prognostic model linking melanoma survival to aging-related molecular signatures.
Findings
Five lncRNA signatures (AC011481.1, USP30-AS1, EBLN3P, LINC01527, HLA-DQB1-AS1) were associated with overall survival in melanoma.
Reduced EGFR and increased ATF2 and POLD1 expression correlated with worse prognosis in melanoma patients.
Aging-related lncRNAs were enriched in pathways like reactive oxygen metabolism, ferroptosis, immunity, and autophagy in melanoma.
Abstract
Aging and long non-coding RNAs (lncRNAs) are research hotspots in melanoma. However, no study has so far explored the relationship between melanoma prognosis and aging-related lncRNAs (ARLs). The Cancer Genome Atlas database, the GTEx database, and the HAGR database were used in this study in a combined manner. Univariate and multivariate cox regression analyses were used to screen out lncRNA signatures associated with overall survival (OS) in the primary dataset. The risk scoring model was analyzed by risk stratification and tested internally. The protein expression levels of possible target genes of ARLs were verified by immunohistochemistry analysis in HPA database. Finally, gene enrichment analysis was performed. In the primary dataset, five OS-related lncRNA signatures (AC011481.1, USP30-AS1, EBLN3P, LINC01527, HLA-DQB1-AS1) were screened out. The survival curve showed that the…
Genes, proteins, chemicals, diseases, species, mutations and cell lines named across the full text — each resolved to its canonical identifier and authoritative record.
Click any figure to enlarge with its caption.
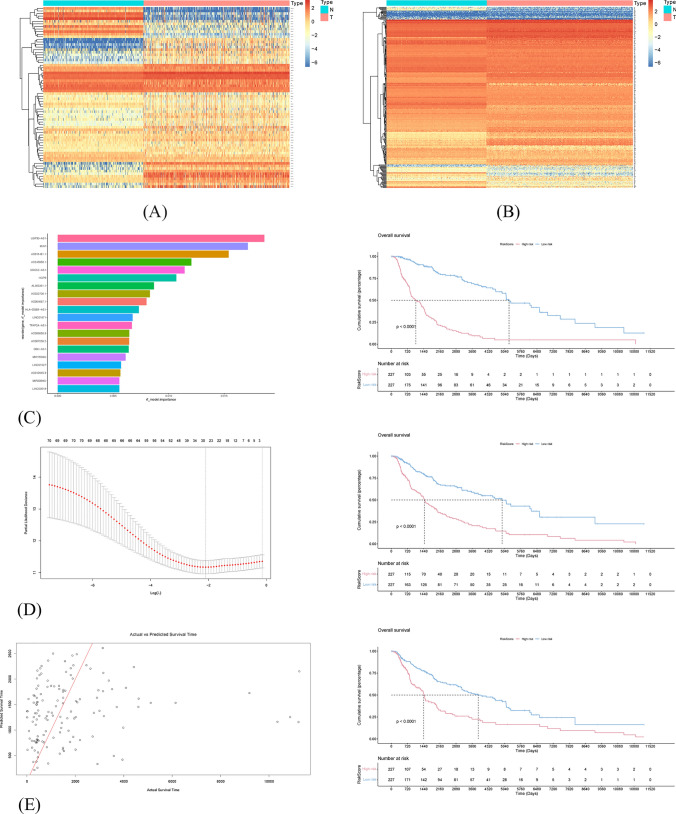 Figure 1
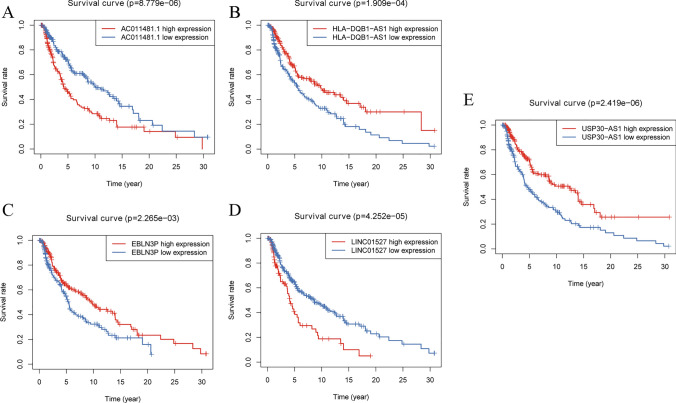 Figure 2
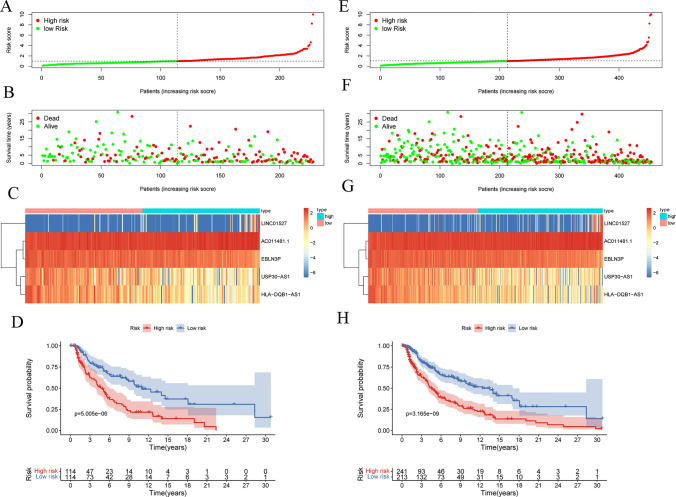 Figure 3
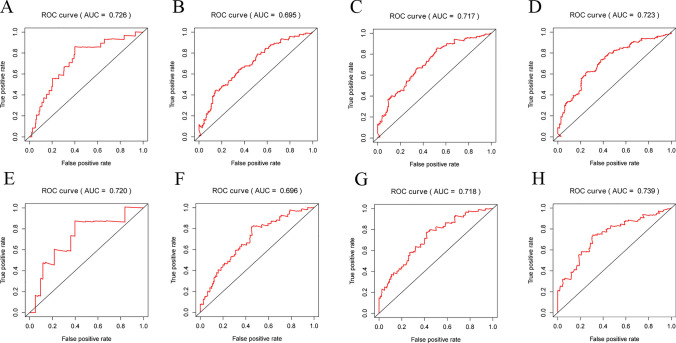 Figure 4
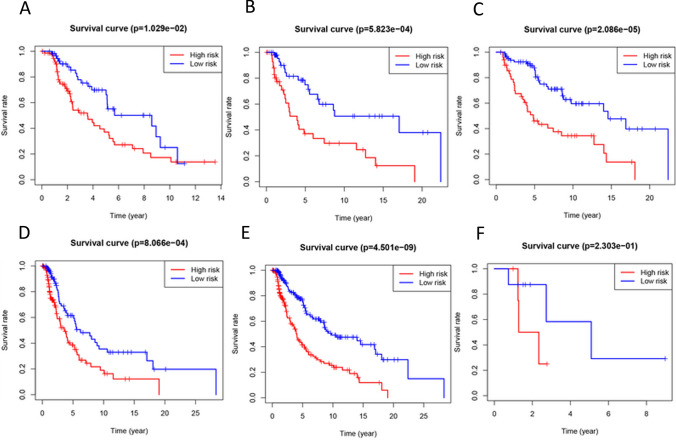 Figure 5
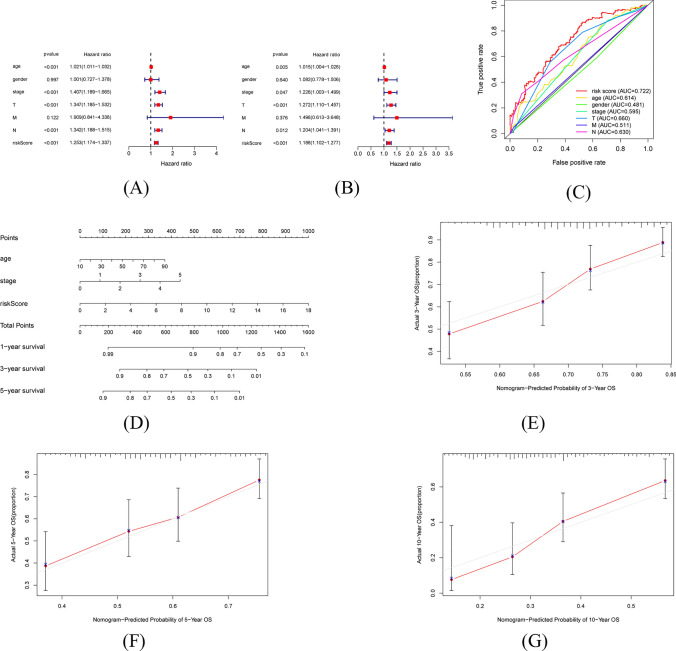 Figure 6
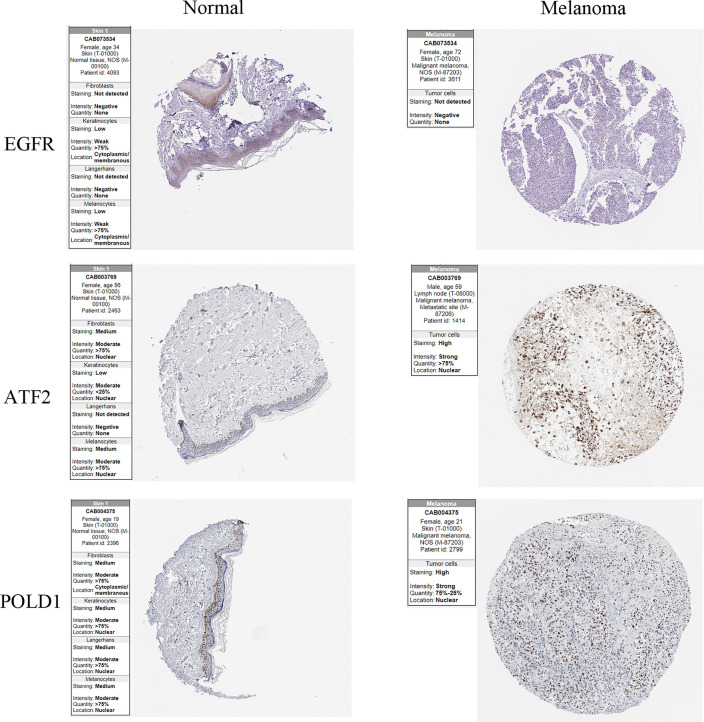 Figure 7
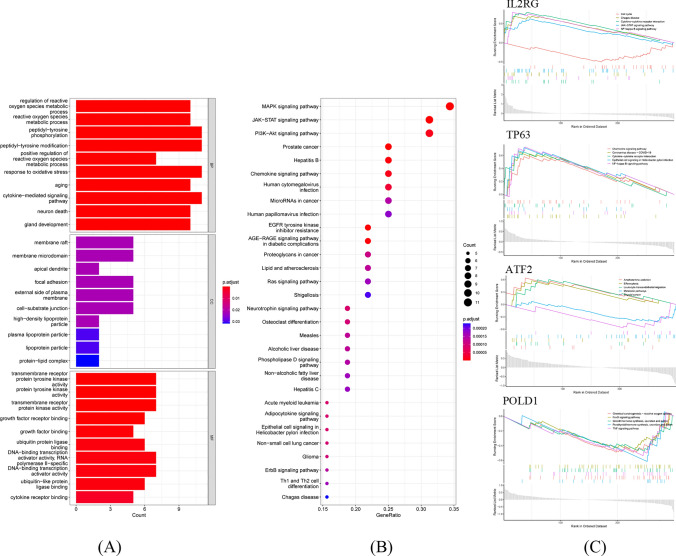 Figure 8
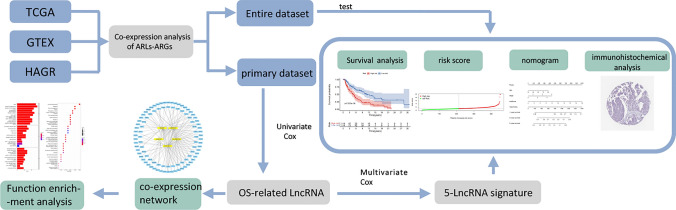 Figure 9
- —Basic Public Welfare Research Program of Zhejiang Province
- —The Research project of the Affiliated Hospital of Zhejiang Chinese Medicine University
Peer Reviews
No public reviews on file for this paper yet. If you reviewed it on a platform where reviews are public (OpenReview, ICLR, NeurIPS, ICML), you can paste yours below so the community can read it here.
Videos
No videos yet. Explain this paper in a talk, walkthrough, or lecture? Add one.
Taxonomy
TopicsCancer-related molecular mechanisms research · Ferroptosis and cancer prognosis · RNA modifications and cancer
Introduction
Skin cutaneous melanoma (SKCM) is a malignant tumor caused by the abnormal proliferation of melanocytes. Melanoma results in the death of 55,500 people annually, and it accounts for 75% of the fatalities related to skin diseases worldwide [1]. Owing to its high proliferation and metastatic potential, melanoma has become one of the main threats to human health and well-being [2]. Conventional radiotherapy has little effect on melanoma as most patients do not respond well [3]. In addition to early diagnosis and surgical resection of malignant melanoma, therapies such as immunotherapy and targeted therapy are available. However, immunoagent therapies do not work in more than half of the cases [4], and more than half of the people have tolerance to targeted therapeutic agents [5]. As a result, there is still a lack of specific therapies for the treatment of cutaneous melanoma. The 5-year overall survival rate of patients is only 30–40% [6]. Bioinformatics methods play a pivotal role in the discovery and study of predictive melanoma biomarkers, which facilitate enhanced diagnostic accuracy, treatment efficacy, and quality of life for melanoma patients [7]. Therefore, it is important to identify biomarkers that enable clinicians to accurately predict the prognosis of melanoma patients through bioinformatics methods, in conjunction with a substantial volume of sample data from public databases.
The mechanisms of cancer development involve the interplay of multiple factors, but it is often regarded as a degenerative disease related to aging, possibly linked to the decline in immune function and accumulated environmental factors. Both cancer and aging are caused by a time-dependent accumulation of damage in the cells [8]. Indeed, cancer and aging are two common features of the aging process [9]. A study has suggested that the aging microenvironment is strongly associated with tumor development and metastasis [10]. Biological aging often promotes the development, invasion, and metastasis of cancer, whereas cellular senescence serves as a potent tumor suppressor mechanism. The interaction between individual senescence and cell senescence is complex. A study by Dennis LK suggests that melanoma is associated with an increased cumulative lifetime exposure to sunlight in individuals with non-sun-sensitive skin (individuals with medium or dark skin tones), which may be direct evidence of the association between melanoma and aging [11]. However, there is no current genetic evidence establishing a correlation between the two. Aging-related genes (ARGs) play a vital role in cell senescence and senescence microenvironment, therefore, also function in tumor development and prognosis [12]. Recently the use of ARGs as a molecular biomarker for the diagnosis or prognosis of various types of cancer, such as colorectal cancer and lung adenocarcinoma, has attracted much attention [12, 13]. However, the biological function of ARGs and their potential prognostic role as a biomarker in SKCM are yet to be elucidated.
Long non-coding RNA (lncRNA) has almost no ability to encode proteins but is involved in epigenetic regulation [14]. A genome-wide association study of tumor samples has identified several cancer-related lncRNAs whose change of expression and mutation affect the development, metastasis, and prognosis of tumor [15]. Therefore, the identification of specific lncRNAs plays a pertinent role in cancer treatment and prognostic analysis. However, there are no relevant reports to prove the effect and molecular mechanism of aging-related lncRNAs (ARLs) on the prognosis of patients with melanoma.
In general, multi-gene models have higher predictive capabilities than single-gene models. Therefore, in this study, The Cancer Genome Atlas (TCGA) database was combined with the Genotype-Tissue Expression (GTEX) database and the Human Aging Genome Resource (HAGR) database to identify the lncRNA that are simultaneously associated with aging and the prognosis of melanoma. Furthermore, Cox regression analysis was performed to determine the ARL signature. An accurate pathological nomogram was constructed in combination with clinical features.
Materials and methods
Data acquisition and preparation
With reference to the TCGA database (https://www.cancergenome.nih.gov/), relevant clinical information and FPKM data of 471 melanoma samples and 1 normal sample were obtained. The RNA-seq datasets and the related clinical information of 324 normal skin samples exposed to sunlight were obtained from the GTEX database. However, given the small number of normal samples in TCGA, correction for batch effects in the two databases may erase their biological differences. We gave up batch effect rectification but used the "limma" package to normalize the raw data obtained from different databases. The Human Aging Genome Resource is an online dataset employed to study the biology of human aging. In total, 307 human ARGs were determined from HAGR database [16].
Co-expression analysis and expression visualization of ARLs
ARGs of melanoma patients with the expression data were extracted from the TCGA database. Subsequently, the ARGs and lncRNA co-expression analyses of melanomas were assessed by using the limma package (version 4.1.0) of R software. ARLs were obtained using \documentclass[12pt]{minimal} \usepackage{amsmath} \usepackage{wasysym} \usepackage{amsfonts} \usepackage{amssymb} \usepackage{amsbsy} \usepackage{mathrsfs} \usepackage{upgreek} \setlength{\oddsidemargin}{-69pt} \begin{document}$$p<0.001$$\end{document} and \documentclass[12pt]{minimal} \usepackage{amsmath} \usepackage{wasysym} \usepackage{amsfonts} \usepackage{amssymb} \usepackage{amsbsy} \usepackage{mathrsfs} \usepackage{upgreek} \setlength{\oddsidemargin}{-69pt} \begin{document}$$\left|cor\right|>0.45$$\end{document} as the filter [17]. The “pheatmap” packages were used to visualize the ARGs and ARLs by heatmaps.
Determination of OS-related lncRNAs in SKCM patients
After excluding patients with unknown survival time and other clinical information, we obtained 454 SKCM patients as the “entire dataset”. The primary dataset for the preliminary screening was composed of 50% randomly selected samples. First, we performed univariate Cox analyses and Kaplan–Meier analysis to evaluate the correlation between the expression of ARLs and OS ( \documentclass[12pt]{minimal} \usepackage{amsmath} \usepackage{wasysym} \usepackage{amsfonts} \usepackage{amssymb} \usepackage{amsbsy} \usepackage{mathrsfs} \usepackage{upgreek} \setlength{\oddsidemargin}{-69pt} \begin{document}$$p<0.05$$\end{document} ). Meanwhile, we use three machine learning methods, namely, Random Forest, Support Vector Machine Regression and Elasticity Network, to identify the main features of ARLs. COX regression models provide clear explanations of variables which is particularly important in clinical studies. We chose further multivariate Cox regression analyses to construct prognostic models and calculated Akaike Information Criterion (AIC) values for the multifactorial models. Finally, we selected the model with the lowest AIC as the best-fitting predictive model.
Identification and evaluation of ARL signature
After multivariate Cox regression analyses, we obtained the OS-related lncRNAs and their regression coefficients. Accordingly, the expression value of the related lncRNA and its regression coefficient could be linearly weighted. The risk scoring formula was constructed using the following formula:
\documentclass[12pt]{minimal} \usepackage{amsmath} \usepackage{wasysym} \usepackage{amsfonts} \usepackage{amssymb} \usepackage{amsbsy} \usepackage{mathrsfs} \usepackage{upgreek} \setlength{\oddsidemargin}{-69pt} \begin{document}$$Risk Score={\sum }_{i=1}^{n}\left({C}_{i}\times {Exp}_{i}\right)$$\end{document}where, \documentclass[12pt]{minimal} \usepackage{amsmath} \usepackage{wasysym} \usepackage{amsfonts} \usepackage{amssymb} \usepackage{amsbsy} \usepackage{mathrsfs} \usepackage{upgreek} \setlength{\oddsidemargin}{-69pt} \begin{document}$$n$$\end{document} is the number of screened lncRNA, \documentclass[12pt]{minimal} \usepackage{amsmath} \usepackage{wasysym} \usepackage{amsfonts} \usepackage{amssymb} \usepackage{amsbsy} \usepackage{mathrsfs} \usepackage{upgreek} \setlength{\oddsidemargin}{-69pt} \begin{document}$${Exp}_{i}$$\end{document} is the expression value, and \documentclass[12pt]{minimal} \usepackage{amsmath} \usepackage{wasysym} \usepackage{amsfonts} \usepackage{amssymb} \usepackage{amsbsy} \usepackage{mathrsfs} \usepackage{upgreek} \setlength{\oddsidemargin}{-69pt} \begin{document}$${C}_{i}$$\end{document} is the corresponding regression coefficient. This formula calculates the overall score by assigning specific weights to each variable, with these weights reflecting the strength of the association between each lncRNA and the risk of eventual outcome. In order to distinguish the patients’ prognostic status, we assigned the patients to two groups of high and low risks using the median risk score in the primary data set as the threshold. Kaplan–Meier survival curves were plotted for the two groups, respectively, and the log-rank method was employed to test for the presence of significant survival differences between the two groups. Finally, the “survival” package and “pheatmap” packages were used to plot the survival curves of the two groups and the heatmaps of screened lncRNA for visual display. To further evaluate the predictive performance of risk score, the time-dependent receiver operating characteristic (ROC) curves of the two datasets were plotted and the value of Area Under Curve (AUC) were calculated. One, three, five, and ten years were defined as the time nodes.
Risk stratification analysis
Considering the high number of patients with SKCM and the presence of multiple confounding factors, a risk stratification analysis was carried out. The main confounding factors included age, T, and M stage. Therefore, 454 patients with SKCM were divided into two groups according to their age (< 60 or ≥ 60), T stage (T0-T2 subgroup and T3-T4 subgroup), or M stage (M0 subgroup and M1 subgroup).
Establishment of a prognostic nomogram based on lncRNA signature
First, we employed the “survival” package to perform univariate and multivariate Cox analyses on the clinical factors of the patient and plotted the corresponding forest diagram. Overall survival was used as the prognostic index. As with the statistical standard, the clinical influencing factors exerting a significant effect on the prognosis were screened out. Then, ROC curve of clinical information and risk score were plotted to evaluate the prognostic value. To better predict the prognosis of patients, we finally used the “rms” package to build a prognostic nomogram combined with risk scores and clinical factors. The c-index and calibration curve were employed to evaluate the predictive effect of the nomogram.Identification and immunohistochemical validation of co-expressed mRNA.
The ARLs-ARGs coexpression network was visualized by using the Cytoscape software.
( \documentclass[12pt]{minimal} \usepackage{amsmath} \usepackage{wasysym} \usepackage{amsfonts} \usepackage{amssymb} \usepackage{amsbsy} \usepackage{mathrsfs} \usepackage{upgreek} \setlength{\oddsidemargin}{-69pt} \begin{document}$$|cor| > 0.3,p < 0.001$$\end{document} ). The mRNA with the highest lncRNA signature correlation was screened out, and the Human Protein Atlas (HPA) database was used to verify its protein expression based on immunohistochemistry.
Gene enrichment analysis
The targeted mRNA of ARLs were analysed using Gene Ontology (GO) and pathway enrichment analysis (Kyoto Encyclopedia of Genes and Genomes, KEGG). The mRNAs with the highest correlation were analysed using GSEA enrichment analysis (GSEA). The “clusterprofiler” R package were used to perform the enrichment analyses, respectively \documentclass[12pt]{minimal} \usepackage{amsmath} \usepackage{wasysym} \usepackage{amsfonts} \usepackage{amssymb} \usepackage{amsbsy} \usepackage{mathrsfs} \usepackage{upgreek} \setlength{\oddsidemargin}{-69pt} \begin{document}$$p < 0.05$$\end{document} was set as the statistical standard. Finally, the “Enrich plot” package was used to visualize the enrichment outcomes.
Statistical analysis
Data processing was performed using the Perl programming language and R software (version 4.2.1). Different statistical analysis processes have different thresholds for statistical significance. The specific p-value was expounded in the procedure mentioned earlier. Statistical analysis of baseline information selected the student’s t-test. Two-tailed P-values were reported.
Results
Co-expression analysis and expression visualization of ARLs
307 ARGs were downloaded from the HAGR database (Table S1). The intersection of ARGs and TCGA-mRNAs was taken to obtain the 302 ARGs and their expression matrices. Using \documentclass[12pt]{minimal} \usepackage{amsmath} \usepackage{wasysym} \usepackage{amsfonts} \usepackage{amssymb} \usepackage{amsbsy} \usepackage{mathrsfs} \usepackage{upgreek} \setlength{\oddsidemargin}{-69pt} \begin{document}$$p<0.001$$\end{document} and \documentclass[12pt]{minimal} \usepackage{amsmath} \usepackage{wasysym} \usepackage{amsfonts} \usepackage{amssymb} \usepackage{amsbsy} \usepackage{mathrsfs} \usepackage{upgreek} \setlength{\oddsidemargin}{-69pt} \begin{document}$$\left|cor\right|>0.6$$\end{document} as the filter, 71 co-expressed ARLs were screened. The gene expression heatmaps of ARLs and ARGs showed significant differences between normal and tumor samples (Fig. 1A–B).Fig. 1. Screening and expression visualization of ARLs based on machine learning algorithms. A The heatmap of 71 ARLs. B The heatmap of 307 ARGs. C Feature importance assessment plot and survival curve based on random forest model. D Parameter λ Optimal value selection process and survival curves for elastic network
Determination of the OS-related ARLs
The baseline characteristics of the entire dataset and the primary dataset were shown in Table 1. The clinical information of 228 patients in the primary dataset were shown in Table S2. Firstly, in the primary dataset, eighteen lncRNAs significantly associated with OS were screened out ( \documentclass[12pt]{minimal} \usepackage{amsmath} \usepackage{wasysym} \usepackage{amsfonts} \usepackage{amssymb} \usepackage{amsbsy} \usepackage{mathrsfs} \usepackage{upgreek} \setlength{\oddsidemargin}{-69pt} \begin{document}$$p < 0.01$$\end{document} ), as shown in Table 2. The most important feature ARL identified by Random Forest was USP30-AS1, and the top 20 ARLs in terms of importance are shown in Fig. 1C. The optimal value of the parameter λ was 0.079 and the α was 0.4 for the resilient network regression explicitly (Fig. 1D). Scatterplots were used to visualize the prediction results of the support vector machine (Fig. 1E). The deployment of three distinct machine learning algorithms has been instrumental in our endeavor to pinpoint lncRNAs that exhibit a significant correlation with OS. Survival analysis based on the entire dataset clarified that there was a significant difference between the high-risk and low-risk groups classified using all three machine learning algorithms. Subsequently, five OS-related ARLs with the highest likelihood ratio and the lowest AIC were selected by multivariate Cox regression analysis and AIC values, as shown in Table 3. Three lncRNAs (USP30-AS1, EBLN3P, and HLA-DQB1-AS1) that served as protective factors had hazard ratios (HR) < 1. On the contrary, AC011481.1 and LINC01527 were the risk factors (HR > 1). Subsequently, based on the entire dataset, the survival curves of these five genes were plotted for verification (Fig. 2).Table 1. Clinical characteristics of 454 SKCM patients involved in this researchClinical CharacteristicPrimary datasetEntire datasetP-valuen = 228n = 454Age(year)0.62 ≥ 60102215 < 60126239Gender0.41 female79172 male149282Stage0.64 0–II107228 III–IV102191 unknown1935T0.31 T0–T277140 T3–T4116236 Tis47 unknown3171M0.72 M11323 M0201405 unknown1426N0.79 N0108225 N1–N393176 unknown2753Table 2Univariate Cox analyses and Kaplan–Meier survival analyses of OS-related DELs in the primary datasetGeneHRHR.95LHR.95Hp valueAC011481.11.711.202.433.02E-03USP30-AS10.670.530.845.01E-04AL512274.11.431.101.868.12E-03AC018755.40.690.520.918.83E-03AC124319.10.630.470.862.98E-03AC011481.11.711.202.433.02E-03EBLN3P0.520.370.715.21E-05LINC018710.770.650.912.68E-03AL133371.20.610.440.852.90E-03MIR155HG0.720.580.903.72E-03AC012236.10.640.480.874.17E-03LINC024460.680.550.861.00E-03PSMB8-AS10.730.610.889.05E-04LINC015271.641.222.211.14E-03HCP50.790.700.903.34E-04MIAT0.600.410.877.57E-03AC243960.10.640.490.851.61E-03HLA-DQB1-AS10.650.520.822.04E-04Table 3Multivariable Cox analyses of 5 OS-related DELs associated with aging in primary datasetGenecoefficientHRHR.95LHR.95HAC011481.10.301.340.921.96USP30-AS1−0.240.780.601.03EBLN3P−0.450.640.440.91LINC015270.331.391.001.93HLA-DQB1-AS1−0.260.770.591.01Fig. 2Survival curves of 5 OS-related ARLs in the entire dataset (all p < 0.01)
Identification and evaluation of the risk prognosis models
According to the regression coefficients of five OS-related ARLs, the risk scoring model was obtained by linear weighting as following:
\documentclass[12pt]{minimal} \usepackage{amsmath} \usepackage{wasysym} \usepackage{amsfonts} \usepackage{amssymb} \usepackage{amsbsy} \usepackage{mathrsfs} \usepackage{upgreek} \setlength{\oddsidemargin}{-69pt} \begin{document}$$Risk Score=0.30\times {Exp}_{AC011481.1}-0.24\times {Exp}_{USP30-AS1}-0.45\times {Exp}_{EBLN3P}+0.33\times {Exp}_{LINC01527}-0.26\times {Exp}_{HLA-DQB1-AS1}$$\end{document}In primary dataset, the grouping of the high-risk and low-risk groups is shown in Fig. 3A. The OS state scatters diagram (Fig. 3B) and heatmap of the aging-related lncRNA signature (Fig. 3C) showed that there were certain differences in the survival status between the two groups. The survival curve is depicted in Fig. 3D. The survival curve revealed the presence of statistically significant differences between the two groups (p = 2.696 E-06). In addition, the data distribution state of the entire dataset demonstrated the similar trend (Fig. 3E–H). Further, 1, 3, 5, and 10 years were selected as time nodes. ROC curves of the primary dataset (Fig. 4A–D) and the entire dataset (Fig. 4E–H) were plotted. In the primary dataset and the entire dataset, the AUC values for 1, 3, 5, and 10 years were 0.720, 0.696, 0.718, and 0.739 and 0.726, 0.695, 0.717, and 0.723, respectively. In general, the risk model exhibited good and stable classification performance.Fig. 3. Visualization and model testing of risk prognosis models results in primary dataset and entire dataset. A The risk score grouping in primary dataset. B OS state scatters dia-gram in primary dataset. C heatmap of the aging-related lncRNA signature in primary dataset. D The survival curves in primary dataset. Red and blue represent the high- and low-risk groups, respectively. E The risk score grouping in entire dataset. F OS state scatters diagram in entire dataset. G heatmap of the aging-related lncRNA signature in entire dataset. H The survival curves in entire datasetFig. 4ROC curves at different time nodes. A ROC curve for the primary dataset at 1 year (AUC = 0.726). B ROC curve for the primary dataset at 3 years (AUC = 0.695). C ROC curve for the primary dataset at 5 years (AUC = 0.717). D ROC curve for the primary dataset at 10 years (AUC = 0.723). E ROC curve for the entire dataset at 1 year (AUC = 0.720). F ROC curve for the entire dataset at 3 years (AUC = 0.696). G ROC curve for the entire dataset at 5 years (AUC = 0.718). H ROC curve for the entire dataset at 10 years (AUC = 0.739)
Risk stratification analysis
In this study, 454 patients with SKCM were divided into two groups according to their age (< 60 or ≥ 60). In the different age subgroups, there were significant differences between the high-risk and low-risk groups in the survival curves. Relatively, the effect of the age < 60 subgroup was more obvious than the age ≥ 60 subgroup (Fig. 5A–B). In the T0-T2 subgroup and T3-T4 subgroup, the five-lncRNA signature had significant and similar classification effects (Fig. 5C–D). However, in the hierarchical analysis based on the M-index, we found that the application of five-lncRNA signature to the M0 subgroup had a good classification effect, but the effect was poor in the M1 subgroup (Fig. 5E–F). This might be the result of the small sample size of patients with distal metastasis. In summary, the classification effect of five-lncRNA signature was excellent in most subgroups.Fig. 5. Risk stratification analysis based on the five-lncRNA signature. **A ** ≥ 60-year-old sub-group. B < 60-year-old subgroup. C T0-T2 subgroup. D T3-T4 subgroup. E M0 subgroup. F M1 subgroup.
Establishment and validation of nomogram
With \documentclass[12pt]{minimal} \usepackage{amsmath} \usepackage{wasysym} \usepackage{amsfonts} \usepackage{amssymb} \usepackage{amsbsy} \usepackage{mathrsfs} \usepackage{upgreek} \setlength{\oddsidemargin}{-69pt} \begin{document}$$p < 0.05$$\end{document} as the statistical standard, univariate and multivariate Cox analyses showed that age, stage, T, N, and risk score can independently predict the prognosis of SKCM patients (Fig. 6A–B). To avoid multicollinearity, two clinical indicators of T, N were abandoned. Meanwhile, to evaluate thcce prediction accuracy of the signature, the ROC curves were plotted, and the AUC values were calculated in the entire dataset (Fig. 6C). By taking 5 years as the time node, the aging-related risk score was concluded to be the best predictor when compared with the other clinical factors. Then all the independent prognostic factors were recruited to construct the nomogram (Fig. 6D). Calibration curves and C-index were used to evaluate the predictive effectiveness of the nomograms. With the red line being close to the solid grey line, the calibration curves suggested that the prediction of survival probability of 3-, 5-, and 10-year by the nomogram agreed with the observed values (Fig. 6E–G). The C-index was 0.713 (95% CI 0.691–0.735) for the entire dataset.Fig. 6. Screening for independent prognostic factors and establishment of nomograms. A Forest map showing independent prognostic clinical factors in univariate COX analyses. B Forest map showing independent prognostic clinical factors in multivariate Cox analysis. C ROC curves for independent factors. D Nomogram combining the clinical factors and risk scores. E Calibration curves of 3-year. F Calibration curves of 5-year. G Cali-bration curves of 10-year
Co-expression networks and immunohistochemical validation
The co-expression network of 5 lncRNAs obtained by univariate Cox analysis was performed using the Cytoscape ( \documentclass[12pt]{minimal} \usepackage{amsmath} \usepackage{wasysym} \usepackage{amsfonts} \usepackage{amssymb} \usepackage{amsbsy} \usepackage{mathrsfs} \usepackage{upgreek} \setlength{\oddsidemargin}{-69pt} \begin{document}$$|cor| > 0.3,p < 0.001$$\end{document} ) (Figure S1). ARLs-ARGs with the highest correlation is shown in Table 4. HPA database was used to verify the expression of mRNA based on immunohistochemistry (Fig. 7). Decreased EGFR expression and increased ATF2 and POLD1 expression were associated with poorer prognosis. The results are consistent with our study.Table 4ARLs and ARGs with the highest correlationlncRNAmRNAcorP-valueAC011481.1POLD10.621.52E-51EBLN3PATF20.657.24E-57HLA-DQB1-AS1IL2RG0.644.65E-56LINC01527TP630.682.18E-66USP30-AS1IL2RG0.872.65E-145Fig. 7IHC of target genes in normal tissues and melanoma tissues from the HPA database
Gene set enrichment analysis
The GO results showed that the screened ARGs were mainly enriched in the regulation of reactive oxygen species (ROS) metabolism, neuron death, and aging (Fig. 8A). The KEGG enrichment results revealed that ARGs were chiefly involved in MAPK, JAK − STAT, and PI3K–Akt signaling pathways (Fig. 8B). The ARGs were significantly activated in the SKCM tissues. GSEA enrichment analysis of ARGs with the highest correlation with ARLs demonstrated the differences in enriched pathways between the high-expression and low-expression groups, specifically displaying the top five significantly enriched pathways (Fig. 8C).Fig. 8. Functional enrichment of the ARGs. A Bar graph of the GO enrichment results. B The KEGG enrichment results were presented in the bubble plot. C Gene Set Enrichment Analysis of highest correlation ARGs
Discussion
The aging microenvironment has been shown to be closely related to the metastasis and therapeutic resistance of melanoma [18]. However, our current approaches in the development of biomarkers for melanoma are focused on fluid markers, immune-related markers (Table 5) [19, 20]. There have been no studies on the prognostic value of ARLs in melanoma. Owing to the complexity of the aging process, this study attempted to explore the specific biological process and the related molecular mechanism via the analysis of the ARL expression pattern. The effect of ARLs on the prognosis of patients with SKCM was chiefly evaluated.Table 5. Immune-related biomarkers and liquid biopsy markers of melanomaTypeBiomarkerResearchImmune-related markersProtein levels (GPER1 and COL17)Uğur Çakı, etc.[21]Protein levels (CRABP2)Shuangshuang Zeng, etc.[22]Gene levels (MUC16 and TTN)Nilesh Kodal, etc.[23]Gene levels (DSC2 and DSC3)Dongyun Rong, etc.[24]Liquid biopsyCTCs, ctDNA and miRNAsNicholas Slusher, etc.[25]CNVE Lukacova, etc.[26]CCL20Julian Kött, etc.[27]EVMickensone Andre, etc.[28]GPER1 G-protein coupled estrogen receptor 1, COL17 endodomain of collagen XVII, CRABP2 Cellular retinoic acid-binding protein 2, CTCs circulating tumor cells, ctDNA circulating tumor DNA, miRNAs circulation microRNAs, CNV copy number variations, CCL20 C–C motif chemokine ligand 20, EV extracellular vesicles
In our study, an aging-related signature comprising five ARLs was developed, including AC011481.1, USP30-AS1, EBLN3P, LINC01527, and HLA-DQB1-AS1. After ROC curve validation and risk stratification analysis, aging-related risk scores were identified to be the stable independent prognostic factors. The risk model exhibited good and stable classification performance in both primary dataset and entire dataset. Based on the findings, GO and KEGG enrichment analyses were subsequently conducted.
Interleukin 2 receptor subunit Gamma chain(IL2Rg) is a common receptor subunit of many important immune factors, which play a unique role in the immune system [29]. IL2Rg gene knockout is often used to construct immunodeficient mice to verify the efficacy of immunotherapy. Previous studies have suggested that mutations in IL2RG gene may be associated with virus-derived skin infections [30]. The number of tumor-causing melanoma cells was significantly increased in Il2rg(-/-) mice with interleukin-2 receptor γ -chain deletion [31]. Both the screened lncRNA USP30-AS1 and HLA-DQB1-AS1 showed a high correlation with IL2RG, suggesting the association between aging and immunity. IL2Rg may also be an important immunotherapy target for melanoma. Meanwhile, USP30-AS1, LINC01527 and HLA-DQB1-AS1 were also considered to be an independent prognostic marker of melanoma as an autophagy-related lncRNA [17, 32]. In addition, related studies have observed that USP30-AS1 played a role as a biomarker in the prognostic prediction of bladder and urethral carcinoma, ovarian cancer, and cervical cancer [33–35]. Interestingly, USP has been screened out with multivariate Cox analysis as a protective factor in melanoma (HR < 1). However, in acute myeloid leukemia (AML), USP30-AS1 appears to be a risk factor for inducing immune escape of the AML cells [36]. Considerable studies have confirmed that EBLN3P can promote the progression of liver cancer, osteosarcoma and colorectal cancer [37–39]. However, the role of EBLN3P in SKCM has not been confirmed by relevant experiments. AC011481.1 is yet another independent prognostic signature of melanoma screened out using multivariate Cox analysis. No relevant studies have been performed on it. However, the DNA polymerase δ 1 catalytic subunit (POLD1) co-expressed with AC245041.1 was found to be associated with the prognosis of liver cancer, colorectal cancer, and endometrial cancer [40, 41]. At the same time, clinically, patients with POL /POLD1 mutations are often accompanied by skin pigmentation, pilomatricoma and other skin lesions [42, 43]. However, the mechanism of POLD1 action in melanoma has not been explored.
Moreover, TP63, the mRNA coexpressed with LINC01527, has been found to be an effective biomarker in the diagnosis of SKCM. P63 is associated with many biological processes in the cells, especially epithelial biology [44]. P63 was observed to be significantly overexpressed in cutaneous basal cell carcinoma (cBCC), another type of skin cancer with a better prognosis than melanoma [45]. It is generally believed that the phenomenon of P63 overexpression is not significant in melanoma cells, but some studies have found up to 60% p63 positivity in a batch of melanoma samples. This finding demonstrates that TP63 has an antiapoptotic effect in melanoma and is responsible for mediating chemoresistance [46]. In our study, LINC01527 was identified to be a risk factor positively correlated with the expression of TP63, which is consistent with previous research [46]. To further explore the mechanism, we have compiled and organized the relevant literature for ARL and ARG, as shown in Table 6.Table 6. Research on Related Functions and Mechanisms of LncRNA and mRNALncRNAResearch on Related Functions and MechanismsmRNAResearch on Related Functions and MechanismsAC011481.1/POLD1Related to the high microsatellite instability and tumor immunotherapy[47]EBLN3PPromoting the progression and metastasis of liver cancer, osteosarcoma, and colorectal cancer[38, 48, 49]ATF2Promoting the progression of melanoma and renal cell carcinoma[50] [51]; Immunomodulatory effects[52]HLA-DQB1-AS1Necroptosis[53]; autophagy-related[54]; immune-related[55]IL2RGImmunomodulatory and Immunodeficiency relatedness[56] [57]; Renal cell carcinoma prognosis related[58]LINC01527autophagy-related[54]TP63Squamous cell carcinoma adn prostate cancer-specific oncogene[59] [60]; Promotion of pyroptosis[61]USP30-AS1Immunomodulation of viral infections[62]; Cancer prognosis-related lncRNA studies. (Adenocarcinoma of the colon [9], cervical cancer[63], breast cancer[64], ovarian cancer[65], bladder cancer[66], melanoma[17, 67, 68]IL2RG/
The GO biological process category indicated that the main enrichment is in aging, ROS metabolism, and regulation of cell adhesion. In fact, considering that lipids are important targets of ROS, the ROS metabolism level reflects the lipid peroxidation level in the mitochondria to some extent [69]. At the same time, the accumulation of lipid-based ROS in the melanoma cells causes ferroptosis. During this process, the targeting effect of miR-137 on the glutamine transporter SLC1A5 in the melanoma cells plays a negative role in regulating ferroptosis [70]. It is speculated that ARL might also have a similar mechanism that affects tumor growth by regulating the ferroptosis process in the cells.
The enrichment results of KEGG were similar to those of GO. The genes were mainly enriched in MAPK, PI3K − Akt, JAK − STAT signaling pathways and so on. In fact, these three pathways are closely related to each other, and there has been considerable research on them. For example, computational models of PI3K/Akt and MAPK signaling pathways in melanoma have been established [71]. The JAK − STAT signaling pathway can transmit signals to the PI3K − Akt signaling pathway to further activate downstream pathways, such as protein translation, apoptosis, and P53 pathway, and further regulate tumor development and metastasis. MERTK receptor tyrosine kinase has been found to be an effective therapeutic target for melanoma, regulating MAPK/ERK, PI3K/Akt, and JAK/STAT pathways simultaneously [72]. In recent years, the widespread application of MAPK-targeted therapy has significantly improved the OS in patients with advanced melanoma [73, 74]. However, the viewpoint that these three pathways are related to the aging process has not been proposed.
The limitation of this study is the potential bias caused by many confounding factors. However, the database used in this study is relatively comprehensive. At the same time, we conducted risk stratification analysis for some confounding factors to minimize the impact of bias on the results. Overall, considering the correlation between aging and the prognosis of patients with melanoma, five OS-related lncRNAs were identified through coexpression analysis of ARGs and lncRNAs as well as univariate and multivariate Cox regression analysis of ARLs. Next, the ARL signature was established. Finally, the clinical indicators and risk scores were combined to establish nomograms related to the aging process to help clinicians with the decision-making process.
Conclusion
In this study, TCGA, GTEx, and HAGR databases were used in a combined manner(Fig. 9). Importantly, the ARL signature was constructed, and the possibility of it functioning as an independent prognostic biomarker was verified. Finally, a clinical nomogram related to the aging process was established to augment our understanding of the prognosis of SKCM. Nonetheless, further investigations are needed to confirm the present findings.Fig. 9. We harnessed the collective power of The Cancer Genome Atlas, GTEx, and HAGR databases to conduct a comprehensive analysis. We employed univariate and multivariate Cox regression analyses to meticulously identify lncRNA signatures that are significantly correlated with overall survival (OS) within our primary dataset. Subsequently, we developed a risk scoring model, which was rigorously evaluated through risk stratification and internal validation. To further substantiate our findings, we utilized immunohistochemistry analysis within the Human Protein Atlas (HPA) database to confirm the protein expression levels of potential target genes associated with ARLs. Concluding our investigation, we conducted a gene enrichment analysis to elucidate the biological significance of our discoveries. Our primary dataset yielded five lncRNA signatures that were found to be significantly associated with overall survival
Supplementary Information
Additional file1 (DOCX 2025 KB)
The reference list from the paper itself. Each links out to its DOI / PubMed record.
- 1Franklin C, Mohr P, Bluhm L, Meier F, Garzarolli M, Weichenthal M, Kähler K, Grimmelmann I, Gutzmer R, Utikal J et al. Brain metastasis and survival outcomes after first-line therapy in metastatic melanoma: a multicenter De COG study on 1704 patients from the prospective skin cancer registry ADOREG. J Immunother Cancer. 2023;11:e 005828.10.1136/jitc-2022-005828 PMC 1008385837028819 · doi ↗ · pubmed ↗