Using Public Funeral and Obituary Listings to Identify Spikes in Excess Mortality in One Appalachian County
Allen Archer, Melissa White, Megan Quinn, Randy Wykoff

TL;DR
This study shows that funeral and obituary listings can detect early spikes in deaths, offering a faster alternative to official data for public health monitoring.
Contribution
The study introduces funeral and obituary listings as early indicators of excess mortality before official data becomes available.
Findings
Funeral home and obituary data showed nearly 100 excess deaths before the first reported COVID-19 death.
Using these data sources could have provided a five-month early warning for health officials.
State-reported data only accounted for 50% of the excess mortality estimated in 2020.
Abstract
Delays (10–22 months) in availability of official state and county-level mortality data could have significant public health consequences. The COVID-19 pandemic illuminated the need for health officials to access timely death data to identify unexpected increases in mortality in their communities. The purpose of this study is to determine if funeral home listings and/or newspaper obituaries could help identify excess mortality on the local level, prior to the availability of official death records. To calculate excess mortality, four years (2017–2020) of data were collected from three sources: the state health department, online funeral home listings, and newspaper obituaries, all from Washington County, Tennessee. Simple linear regression was used to predict number of expected deaths by month for 2020 using 2017, 2018, and 2019 reported deaths, by data source. The percent difference…
Genes, proteins, chemicals, diseases, species, mutations and cell lines named across the full text — each resolved to its canonical identifier and authoritative record.
Click any figure to enlarge with its caption.
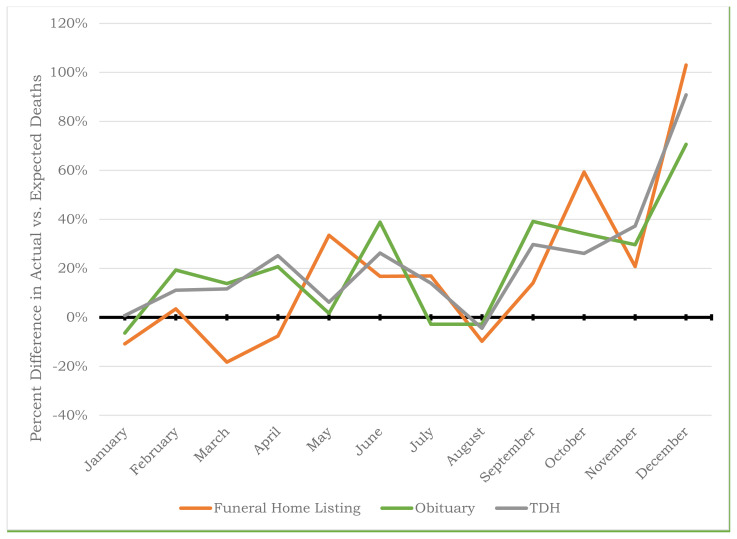 Figure 1
Peer Reviews
No public reviews on file for this paper yet. If you reviewed it on a platform where reviews are public (OpenReview, ICLR, NeurIPS, ICML), you can paste yours below so the community can read it here.
Videos
No videos yet. Explain this paper in a talk, walkthrough, or lecture? Add one.
Taxonomy
TopicsFood Security and Health in Diverse Populations · Dietetics, Nutrition, and Education · Obesity and Health Practices
INTRODUCTION
In 2020, the Tennessee Department of Health (TDH) reported 6,760 deaths from COVID-19 in the state, the first being reported on March 20.1,2 Confirmed COVID-19 deaths primarily capture deaths directly resulting from COVID-19, but do not completely capture indirect deaths resulting from the sociocultural impact of the COVID-19 pandemic.3 An estimate of excess deaths, defined as the difference between the actual number of deaths in a specific time and the expected number of deaths in the same period, is essential to understand the full impact of the pandemic.4 Recognizing excess deaths in a community is important both to assess the overall impact of a disease (pandemic or otherwise) and as an early indicator that a new disease or condition may be impacting a community.
While state-reported mortality data are the gold standard for assessing excess deaths in any area, these data are not readily available during an event associated with a short-term increase in mortality.5 In Tennessee, mortality data are officially reported in October for the previous year, meaning that these data are anywhere from 10 to 22 months delayed in their reporting. The availability of mortality data can also vary widely by location and cause of death.6
Washington County, Tennessee is located in the Appalachian Region of Northeast Tennessee. 7 As of the 2020 census, the county had a population of just over 130,000 people, with 88% white/non-Hispanic, 4% black/non-Hispanic and 4% Hispanic.7 The capital is Jonesborough, although its largest city is Johnson City, which is a part of the Tri-Cities combined statistical area.7 Thirty three percent of the population has a postsecondary degree, compared to Tennessee’s overall rate of 29%.7 Median household income from 2017–2021 was 58,507.7
It is critical for local public health officials to have access to timely, accurate data to identify and potentially respond to unexpected increases in mortality in their communities. The COVID-19 pandemic provided a unique opportunity in Washington County, Tennessee, to evaluate the utility of online listings of recent deaths by local funeral homes and obituaries published in local newspapers for identifying excess mortality in a timely way.
METHODS
Data Sources
Four years of (1) total mortality data for Washington County, Tennessee were formally requested and obtained from TDH; (2) publicly available death listings were collected from four funeral homes in Washington County; and (3) obituary listings were compiled from a local newspaper.8 There are a total of 18 funeral homes in Northeast Tennessee. Three of the funeral homes selected were identified as the most utilized in Northeast Tennessee, and the fourth was selected because it was the most utilized by the region’s non-Hispanic black or African American population. Obituary listings were identified from the newspaper with the greatest local circulation, the Johnson City Press. Newspaper data were obtained from indices maintained by the Johnson City Public Library and were quality checked by randomly identifying 10% of listings for review on the Johnson City Press online archive website.
Calculating Excess Mortality
Month-by-month deaths for 2017, 2018, 2019, and 2020 were determined for state-level mortality data, online funeral home listings, and newspaper obituaries. There are multiple methodological options for predicting excess mortality to include techniques such as Poisson regression and Bayesian modeling, depending on the type of data and sample size. Due to the small number of data points, limited data, and the aim of this project, simple linear regression models were used to predict excess mortality. Using simple linear regression models, deaths by month for 2017–2019 (as reported by funeral homes and newspaper obituaries) were used to predict expected deaths each month of 2020 for each data source. The slope of the linear regression model was determined, and based on the calculated slope, projected deaths for the corresponding month in 2020 were predicted. This calculation provided the potential number of excess deaths in 2020, which then allowed the calculation of excess deaths. By subtracting expected 2020 monthly deaths from the actual (reported) monthly deaths, monthly number of excess deaths for 2020 were calculated for each data source. This calculated difference was then divided by the expected deaths for the same month to calculate percent difference. This methodology was used to calculate the percent difference in actual and expected deaths for each data source.
Excess Death Calculation
Month-by-month trends in percent differences for TDH mortality data, funeral home death listings, and newspaper obituaries were then graphed to visually represent whether the two alternative mortality data sources had similar peaks and valleys with the official state-level data.
RESULTS
Tennessee Department of Health Mortality Data
As shown in Table 1, in 2020, there were a total of 322 excess deaths in Washington County (1,489 expected v. 1,811 actual) representing a percent difference of 21.63% expected v. actual deaths. For the same year, TDH officially reported 165 deaths from COVID-19 in Washington County, with the first occurring on July 28, 2020.2 These 165 deaths attributed to COVID-19 represented only 51.24% of the 322 excess deaths in the county in 2020, leaving a remaining 157 or 48.76% of excess deaths not directly attributed to COVID-19.
There was a 7.68% and 18.85% increase in actual v. expected deaths for quarters one and two, respectively. For these two quarters, none of the 96 excess deaths were explained by COVID-19, as no COVID-related deaths had yet been reported in Washington County. Quarters three and four had a 12.21% and 48.91% increase in deaths, respectively. Of the 47 excess deaths in quarter three, 38 (80.28%) were attributed to COVID-19, leaving about 20% unexplained by COVID-19. Similarly, of the 179 deaths in quarter four, 127 (70.82%) were attributed directly to COVID-19, leaving nearly 30% of excess deaths unexplained by COVID-19.
Funeral Home Listings
As shown in Table 2, there were a total of 911 expected funeral home listings in 2020 compared to 1,037 observed listings, indicating an increase of 126 (13.79%) actual funeral home listings. There was a −9.29%, 11.50%, 7.36% and 55.90% difference in actual v. expected funeral home listings for quarters one, two, three, and four, respectively, in 2020.
Newspaper obituaries
The expected number of newspaper obituaries for all of 2020 was 1,550 compared to 1,864 actual obituaries, represented by a 20.28% increase (Table 3). By quarter, 2020 actual newspaper obituaries differed from the expected by 8.05%, 20.00%, 9.93% and 44.55% for quarters one, two, three, and four, respectively.
Comparison of Trends in Mortality between Data Sources
Figure 1 graphically compares trends in the percent difference in actual v. expected TDH mortality data and the two alternative death data sources: funeral home listings and newspaper obituaries. The trend in percent difference in actual v. expected funeral home listings was consistent with state health department data and the first major spike occurring in May 2020, along with two additional larger spikes in October and December 2020 (Fig. 1). Newspaper obituaries even more closely resembled the TDH data for Washington County (Fig. 1).
DISCUSSION
This study documents that online public reports from selected funeral homes and newspaper obituary listings are quite accurate in providing local health officers with useful, accessible, and reliable “real time” indications of excess mortality within their region. When visually comparing online funeral listings and newspaper obituaries to state reported data for Washington County, either of the public data sources could have been used to identify spikes in excess mortality throughout 2020. Creating a historical month-by-month registry of the number of deaths in the region, collated from a selected number of funeral homes and/or newspaper obituaries, is an inexpensive and relatively quick method for local health officials to have an early indication that something has changed in their region. Aside from minor differences in February and June, the trends in the percent difference in funeral home listings and official state mortality data in Figure 1 are remarkably similar. Therefore, had this technique for identifying excess mortality been employed prior to the pandemic, health officials in Washington County, Tennessee would have begun seeing increases in mortality as early as February 2020. These trends would have only later, in October 2021, been corroborated by state health department data. Remarkably, almost 100 excess deaths were reported prior to the first identified case of COVID-19 in Washington County.
It was not until August 2020 that the percent of excess deaths attributed to COVID-19 reached the 75–88% predicted by the CDC, indicating considerable under-recognition and significant delays in identifying COVID-19-related deaths in Washington County, Tennessee.9 The failure or delay in recognition of excess deaths can have multiple public health implications. For example, in the case of COVID-19, delay in recognizing excess mortality may have contributed to difficulty in convincing the public of the significance of the pandemic, especially in the face of suggestions coming from national-level officials and news outlets that the severity of the pandemic was being exaggerated.9,10 During non-pandemic times, failure to recognize excess mortality could result in delays in recognizing, or even failure to recognize, an unanticipated cause of death in a community. Because state-level death data can take over a year to be made available to local public health officials, they are not particularly useful for local and state-level health officials in identifying and responding to unexpected changes in the number of deaths in a region.
While this study was conducted during the COVID-19 pandemic, when it was widely recognized that there were going to be excess deaths, the results would be applicable in a wide variety of settings such as the introduction of drugs laced with Fentanyl, an unrecognized contamination of drinking water or other consumer product, or an environmental pollutant. Based on these findings, it appears to be beneficial for health officials to create and maintain a database of deaths at a city or county level, based on funeral home data and newspaper obituaries that could serve as an early indicator that a change has happened in the number of deaths in their region.
Limitations
Neither funeral home nor obituary data are an accurate measure of actual deaths in a region. Not everyone who dies will have their funeral service in the region where they die and vice versa. Additionally, programs like the Federal Emergency Management Association’s funeral assistance program could have changed the number of deaths reported in funeral home listings, if a funeral home was participating in that program. Obituaries also have a cost associated with them and therefore may be inconsistent depending on other economic priorities. Funeral home and obituary data may also have delays in being published depending on location and other influences, such as the COVID-19 pandemic. Furthermore, it is not possible to identify the cause of excess mortality from these data sources. Finally, while these data sources may be quicker than official data sources, the lag time with these data sources is not fully known and was not determined as part of this project. That said, funeral home and obituary data could be considered tools in understanding trends in mortality and should not be used as the sole source of data to determine mortality rates.
The methodology chosen was used due to the limited data and the aim to provide simple, straightforward estimates for local and regional health departments to determine if excess deaths were occurring during the COVID-19 pandemic. Creating simple linear regression models with only three years of data lends itself to potential inaccuracies and the findings should be interpreted with caution. This was done because, at the time of data collection, online funeral home listings prior to 2017 were unattainable. However, since the method for establishing 2020 monthly expected deaths was replicated for all data sources using the same number of years, it is believed that the comparisons provided are valid. This limitation would also be addressed in time, given that the longer this data is collected, the more years of data would be available for analyses, thereby strengthening confidence in expected death calculations. Further, if additional data were available, other methodologies to predict excess mortality could have been considered, such as Poisson regression, which is typically used for count data. However, the low number of data and the main purpose of the current study limited the applicability of such an approach. It should also be noted that depending on the data and methodology used, excess mortality estimates may vary. For example, a recent study by Paglino et al11 provided different excess mortality estimates for Washington County than the current study. These differences are based on the data used in each of the respective studies, the methodologies employed to estimate excess mortality, and the time periods addressed by each study. Methodologies for calculating excess mortality have been a point of discussion for researchers during the COVID-19 pandemic to try to estimate the impact of the pandemic. Vandenbroucke and Pearce recently provided insights into using different methodologies and stated that it is important to identify best practices in calculating excess mortality for different situations.12
Finally, while online funeral listings and newspaper obituaries were readily available data sources in Washington County, the utilization and composition of public death listing sources in each region may vary. This study should be considered a pilot study and, should public health professionals seek to employ these techniques for identifying excess mortality, they should identify the most utilized and reliable data sources available in their region.
CONCLUSION
This study provides preliminary evidence that online funeral home listings and newspaper obituaries provide an accessible and inexpensive “real time” mechanism to identify trends in excess mortality. The technique outlined in this project is one option that could be used in the future to identify future public health threats and ultimately prevent the loss of life at the city/county level, and thus have significant implications for local and state-level public health leaders as well as communities.
SUMMARY BOX What is already known about this topic? Excess mortality is currently calculated a variety of ways, using state or nationally reported death data with long delays in access. What is added by this report? This report provides a basis for utilizing newspaper obituaries and funeral home reports to identify spikes in excess mortality more quickly. What are the implications for future research? The ability of newspaper obituaries and funeral home reports to evaluate “real time” changes in excess mortality should be evaluated in other regions of the country, including urban areas and other, non–Appalachian communities.
The reference list from the paper itself. Each links out to its DOI / PubMed record.
- 1West ER Nashville health department reports Tennessee’s first coronavirus death The Tennessean online Mar 20 2020 Available at: https://www.tennessean.com/story/news/health/2020/03/20/first-coronavirus-death-tennessee-reported-nashville-davidson-county/2886440001/
- 2Downloadable Datasets n.d Retrieved November 28, 2021, from https://www.tn.gov/health/cedep/ncov/data/downloadable-datasets.html
- 3Iuliano AD Chang HH Patel NN Threlkel R Kniss K Reich J Steele M Hall AJ Fry AM Reed C 2021 Estimating under-recognized COVID-19 deaths, United States, March 2020–May 2021 using an excess mortality modelling approach The Lancet Regional Health - Americas 1 100019 10.1016/j.lana.2021.10 34386789 PMC 8275579 · doi ↗ · pubmed ↗
- 4Excess Deaths Associated with COVID-19 n.d Retrieved November 27, 2021, from https://www.cdc.gov/nchs/nvss/vsrr/covid 19/excess_deaths.htm
- 5Rivera R Rosenbaum JE Quispe W n.d Epidemiology and Infection Excess mortality in the United States during the first three months of the COVID-19 pandemic 10.1017/S 0950268820002617 PMC 765349233115546 · doi ↗ · pubmed ↗
- 6Spencer MR Ahmad F 2016 Vital Statistics Rapid Release Special Report Timeliness of Death Certificate Data for Mortality Surveillance and Provisional Estimates
- 7U.S. Census Bureau Quick Facts: Washington County, Tennessee n.d Retrieved November 27, 2021, from https://www.census.gov/quickfacts/washingtoncountytennessee
- 8Vital Statistics n.d Retrieved November 27, 2021, from https://www.tn.gov/health/health-program-areas/statistics/health-data/vital-statistics.html