Correction: Cold exposure-induced plasma exosomes impair bone mass by inhibiting autophagy
Li-Min Lei, Fu-Xing-Zi Li, Xiao Lin, Feng Xu, Su-Kang Shan, Bei Guo, Ming-Hui Zheng, Ke-Xin Tang, Yi Wang, Qiu-Shuang Xu, Wen-Lu Ouyang, Jia-Yue Duan, Yun-Yun Wu, Ye-Chi Cao, Zhi-Ang Zhou, Si-Yang He, Yan-Lin Wu, Xi Chen, Zheng-Jun Lin, Yi Pan, Ling-Qing Yuan, Zhi-Hong Li

Abstract
Genes, proteins, chemicals, diseases, species, mutations and cell lines named across the full text — each resolved to its canonical identifier and authoritative record.
Click any figure to enlarge with its caption.
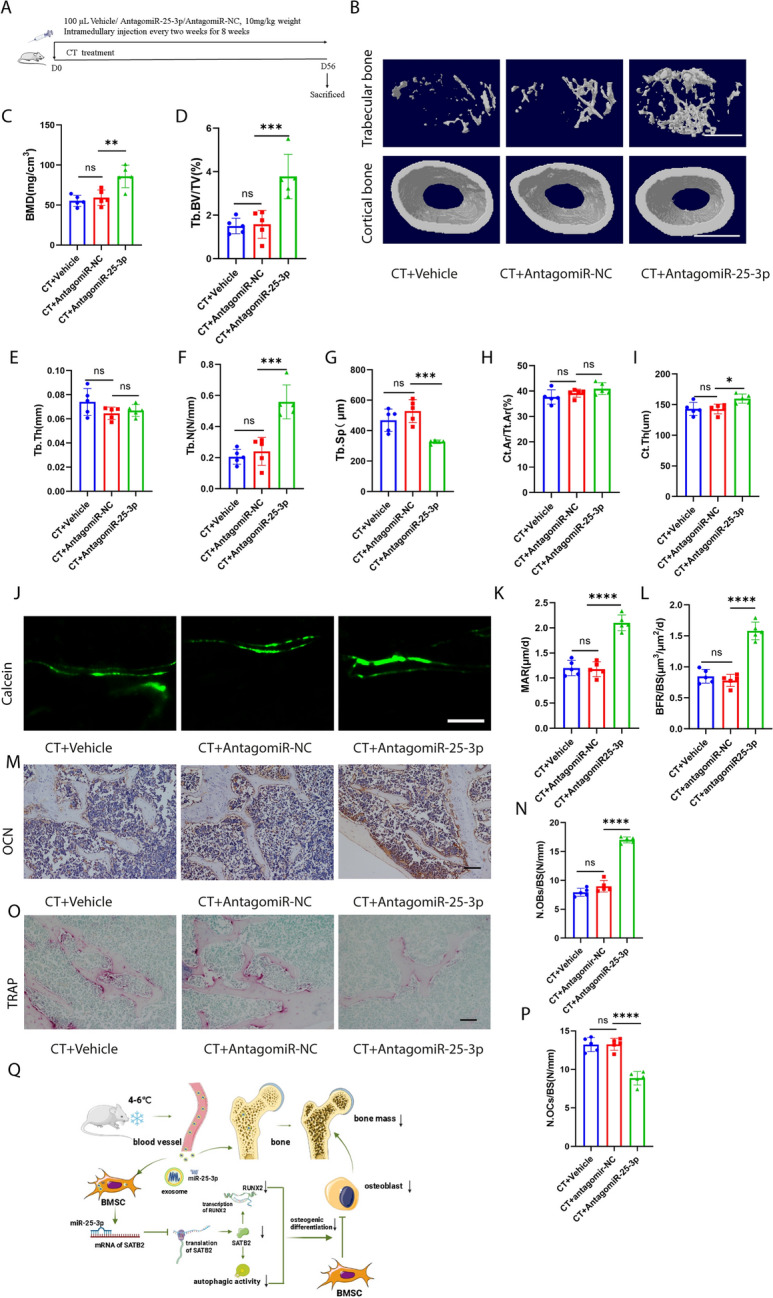 Figure 8
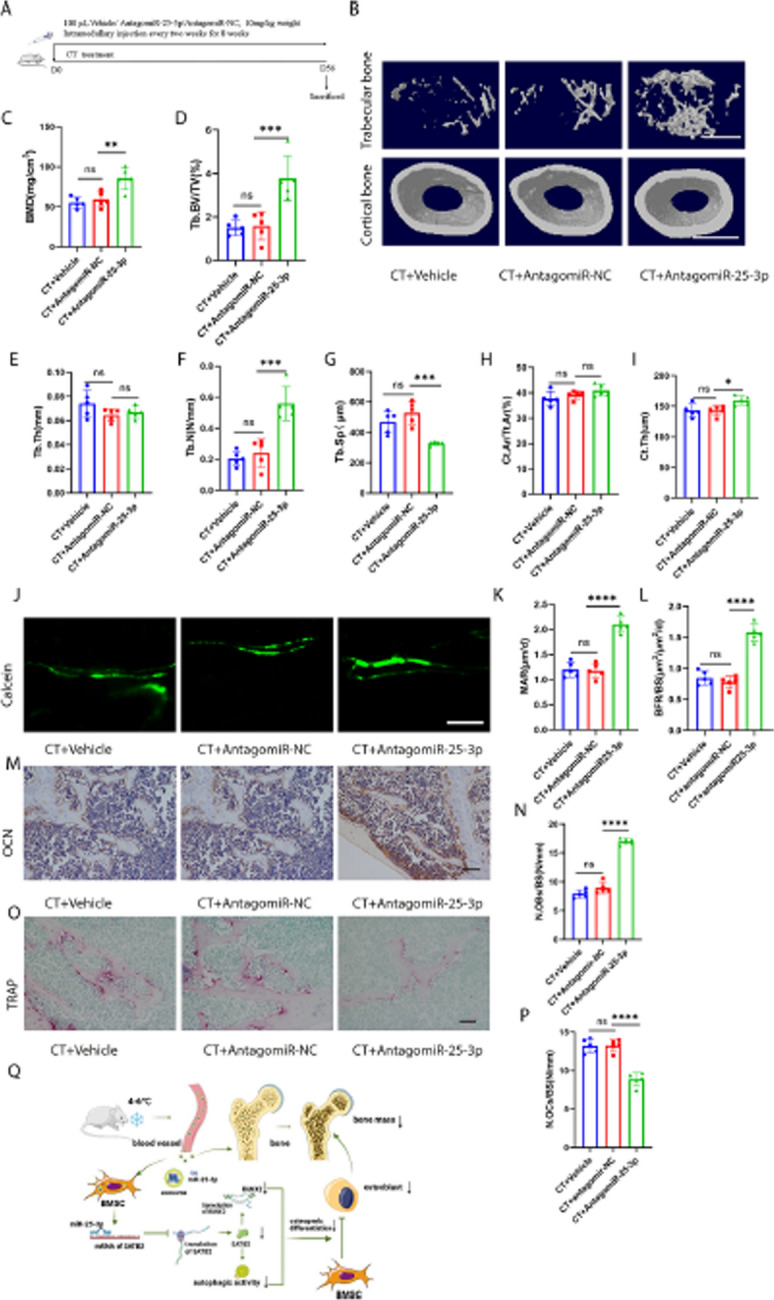 Figure 2
Peer Reviews
No public reviews on file for this paper yet. If you reviewed it on a platform where reviews are public (OpenReview, ICLR, NeurIPS, ICML), you can paste yours below so the community can read it here.
Videos
No videos yet. Explain this paper in a talk, walkthrough, or lecture? Add one.
Taxonomy
TopicsExtracellular vesicles in disease · MicroRNA in disease regulation
**Correction: Journal of Nanobiotechnology (2024) 22:361 ** 10.1186/s12951-024-02640-z
In this article, Fig. 8M (CT + antagomir NC group) appeared incorrectly as a duplicate of Figure 8M (CT + Vehicle group). For completeness and transparency, the old incorrect version and the corrected version of Figure 8 are displayed below. The original article has been corrected.
Incorrect Fig. 8 Inhibition of miR-25-3p level alleviated CT-induced bone loss. A Schematic flow diagram representing mice treated with CT + vehicle, CT + antagomiR-NC, and CT + antagomiR-25-3p. n = 5 per group. B Representative μCT images of trabecular (top) and cortical (bottom) bone in CT + vehicle, CT + antagomiR-NC-, and CT + antagomiR-25-3p-treated mice. Scale bars represent 500 μm (top) and 1 mm (bottom). C–I Parameters of trabecular bone mass analysed by micro-CT: BMD, Tb. BV/TV, Tb. Th, Tb. N, Tb. Sp, Ct. Ar/Tt. Ar, Ct. Th. n = 5 per group. J Calcein double labelling images of the mineralized surface of mouse femora. Scale bar represents 50 μm. K, L Parameters of bone formation MAR, BFR/BS. n = 5 per group. M Representative OCN-stained section. Scale bar represents 100 μm. N Quantification of the number of osteoblasts (N. OBs) on the trabecular bone surface (BS) in distal femora. n = 5 per group. O TRAP-stained sections. Scale bar represents 100 μm. P quantification of the number of osteoclasts (N. OCs) on the trabecular bone surface (BS) in distal femora. n = 5 per group. Q Mechanism of cold exposure induced bone loss. The vehicle referred to is PBS. * P < 0.05, ** P < 0.01, *** P < 0.001, **** P < 0.0001
Corrected Fig. 8. Inhibition of miR-25-3p level alleviated CT-induced bone loss. A Schematic flow diagram representing mice treated with CT + vehicle, CT + antagomiR-NC, and CT + antagomiR-25-3p. n = 5 per group. B Representative μCT images of trabecular (top) and cortical (bottom) bone in CT + vehicle, CT + antagomiR-NC-, and CT + antagomiR-25-3p-treated mice. Scale bars represent 500 μm (top) and 1 mm (bottom). C–I Parameters of trabecular bone mass analysed by micro-CT: BMD, Tb. BV/TV, Tb. Th, Tb. N, Tb. Sp, Ct. Ar/Tt. Ar, Ct. Th. n = 5 per group. J Calcein double labelling images of the mineralized surface of mouse femora. Scale bar represents 50 μm. K, L Parameters of bone formation MAR, BFR/BS. n = 5 per group. M Representative OCN-stained section. Scale bar represents 100 μm. N Quantification of the number of osteoblasts (N. OBs) on the trabecular bone surface (BS) in distal femora. n = 5 per group. O TRAP-stained sections. Scale bar represents 100 μm. P quantification of the number of osteoclasts (N. OCs) on the trabecular bone surface (BS) in distal femora. n = 5 per group. Q Mechanism of cold exposure induced bone loss. The vehicle referred to is PBS. * P < 0.05, ** P < 0.01, *** P < 0.001, **** P < 0.0001