Proteomic analysis reveals candidate molecules to mediate cortical pathology and identify possible biomarkers in an animal model of multiple sclerosis
Berenice Anabel Silva, María Celeste Leal, María Isabel Farias, Agustín Nava, Daniela Inés Galván, Elmer Fernandez, Fernando Juan Pitossi, Carina Cintia Ferrari

TL;DR
This study identifies potential biomarkers and molecules involved in cortical lesions in a new animal model of multiple sclerosis, which could aid in understanding and treating progressive MS.
Contribution
A new focal cortical animal model of MS was developed, revealing candidate biomarkers and molecules linked to cortical pathology.
Findings
Proteomic differences were observed in cortical lesions and cerebrospinal fluid of experimental animals compared to controls.
S100A8 and orosomucoid-1 were highly expressed in both cortical lesions and cerebrospinal fluid.
The findings suggest potential biomarkers for progressive MS, particularly related to cortical lesions.
Abstract
Multiple Sclerosis (MS) is a complex neurodegenerative disease marked by recurring inflammatory episodes, demyelination, axonal damage, and subsequent loss of function. MS presents a wide range of clinical courses, with the progressive forms leading to irreversible neurological disability. Cortical demyelinating lesions are central to the pathology of these progressive forms, gaining critical importance in recent decades due to their strong correlation with physical disability and cognitive decline. Despite this, the underlying mechanisms driving cortical lesion formation remain poorly understood, and no specific treatments are currently available. A significant challenge lies in the lack of animal models that accurately mirror the key characteristics of these lesions. We developed a focal cortical animal model that replicates many features of cortical lesions, including cognitive…
Genes, proteins, chemicals, diseases, species, mutations and cell lines named across the full text — each resolved to its canonical identifier and authoritative record.
Click any figure to enlarge with its caption.
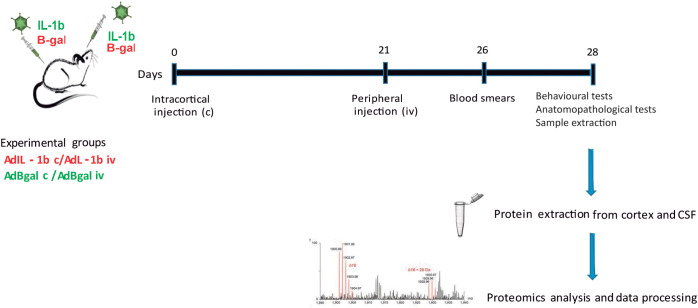 Figure 1
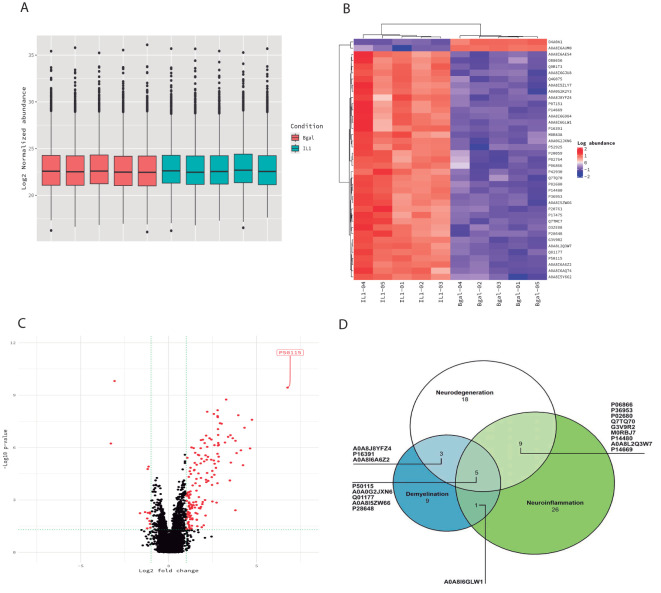 Figure 2
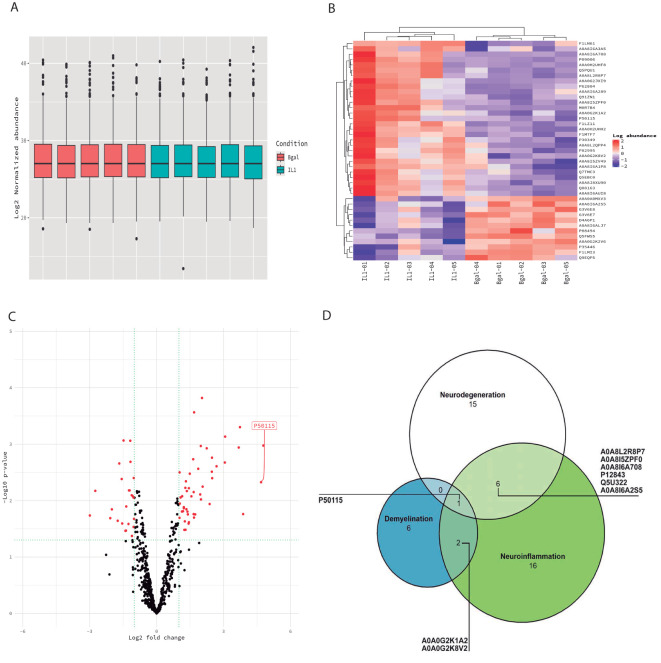 Figure 3
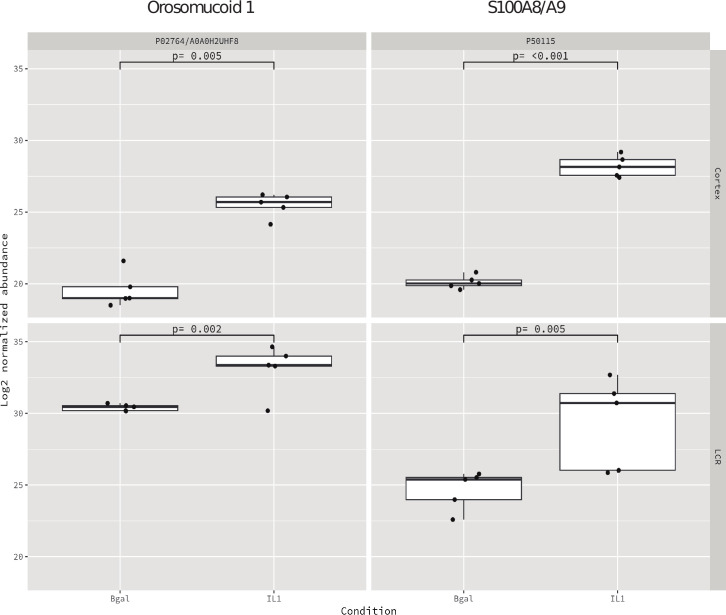 Figure 4
| Accession | Description | Log2FC |
| Adjusted | NF | DM | ND |
|---|---|---|---|---|---|---|---|
| Protein S100-A8 | 6.757 | <0.001 | <0.001 | x | x | x | |
| A0A0G2JXN6 | Galectin | 4.734 | <0.001 | <0.001 | x | x | x |
| Alpha-1-acid glycoprotein (orosomucoid) | 4.628 | <0.001 | 0.005 | x | |||
| Leukocyte elastase inhibitor A | 4.311 | <0.001 | <0.001 | x | |||
| Haptoglobin | 4.108 | <0.001 | 0.007 | x | x | ||
| A0A8I6GJU8 | Lymphocyte-specific protein 1 | 3.960 | <0.001 | <0.001 | x | ||
| A0A8J8YFZ4 | Polypyrimidine tract-binding protein 1 | 3.862 | <0.001 | 0.01 | x | x | |
| RT1 class I histocompatibility antigen, AA alpha chain | 3.799 | <0.001 | 0.002 | x | x | ||
| A0A8I5ZLY7 | TAP-binding protein | 3.640 | <0.001 | 0.001 | |||
| High-mobility group protein B2 | 3.514 | <0.001 | 0.001 | ||||
| A0A8I6G984 | Lymphocyte cytosolic protein 1 | 3.380 | <0.001 | 0.001 | x | ||
| A0A8I6A6Z2 | Capping actin protein, gelsolin like | 3.269 | <0.001 | <0.001 | x | x | |
| A0A8I6GLW1 | Allograft inflammatory factor 1 | 3.201 | <0.001 | 0.002 | x | x | |
| Afamin | 3.008 | <0.001 | <0.001 | x | x | ||
| Fibrinogen gamma chain | 2.918 | <0.001 | <0.001 | x | x | ||
| Hemopexin | 2.850 | <0.001 | 0.003 | x | |||
| Actin-related protein 2/3 complex subunit 1B | 2.817 | <0.001 | 0.003 | x | |||
| Fibrinogen alpha chain | 2.811 | <0.001 | 0.001 | x | x | ||
| Heat shock protein beta-1 | 2.804 | <0.001 | <0.001 | x | |||
| A0A8I5Y662 | Ig-like domain-containing protein | 2.802 | <0.001 | 0.003 | |||
| Plasminogen | 2.791 | <0.001 | <0.001 | x | x | x | |
| G3V9R2 | Complement factor H | 2.782 | <0.001 | <0.001 | x | x | |
| Cathepsin Z | 2.778 | <0.001 | <0.001 | x | |||
| M0RBJ7 | Complement C3 | 2.774 | <0.001 | 0.01 | x | x | |
| A0A0G2K2Y3 | Aminopeptidase | 2.602 | <0.001 | 0.003 | x | ||
| Fibrinogen beta chain | 2.566 | <0.001 | <0.001 | x | x | ||
| D3ZE08 | Ig-like domain-containing protein | 2.428 | <0.001 | 0.002 | x | ||
| M0R838 | Ig-like domain-containing protein | 2.324 | <0.001 | 0.001 | |||
| A0A8L2Q3W7 | Pregnancy-zone protein | 2.192 | <0.001 | <0.001 | x | x | |
| Beta-2-microglobulin | 2.192 | <0.001 | 0.004 | ||||
| A0A8I5ZW66 | Vitamin D-binding protein | 2.129 | <0.001 | 0.001 | x | x | x |
| A0A8I6AQ74 | Ig-like domain-containing protein | 2.048 | <0.001 | 0.003 | |||
| Alpha-1-antiproteinase | 1.943 | <0.001 | 0.002 | ||||
| Signal recognition particle receptor subunit beta | 1.838 | <0.001 | 0.002 | ||||
| Annexin A3 | 1.820 | <0.001 | 0.005 | x | x | ||
| Ig gamma-2B chain C region | 1.507 | <0.001 | 0.009 | x | |||
| A0A8I6AES4 | Cathepsin S | 1.420 | <0.001 | 0.005 | x | ||
| CD63 antigen | 1.299 | <0.001 | 0.004 | x | x | x | |
| D4A0A1 | SOGA family member 3 | −3.077 | <0.001 | <0.001 |
| Accession | Description | Log2 FC |
| NF | DM | ND |
|---|---|---|---|---|---|---|
| F1LN61 | Immunoglobulin heavy constant epsilon | 1.030 | 0.003 | x | ||
| A0A8I5ZPF0 | Haptoglobin | 1.486 | 0.003 | x | x | |
| A0A8I6A708 | Ceruloplasmin | 1.355 | 0.007 | x | x | |
| Serine protease inhibitor A3N | 1.314 | 0.005 | ||||
| A0A8L2R8P7 | Kininogen 1 | 3.072 | 0.001 | x | x | |
| Inter-alpha-trypsin inhibitor heavy chain 4 | 1.147 | 0.008 | x | |||
| Kininogen 1 | 2.475 | 0.003 | ||||
| A0A0H2UHF8 | Orosomucoid 1 | 2.686 | 0.002 | x | ||
| G3V6E8 | Myocilin | -1.673 | 0.002 | x | ||
| Hermansky-Pudlak syndrome 5 protein homolog | 1.561 | 0.008 | ||||
| A0A0H2UHH2 | Amyloid P component, serum | 1.679 | <0.001 | |||
| A0A0G2JXI9 | Histone H2B | 2.482 | 0.002 | |||
| Protein S100-A8 | 4.681 | 0.005 | x | x | x | |
| A0A8I6A289 | Histone H3 | 1.661 | 0.007 | |||
| F1M7F7 | Complement component C6 | 1.981 | 0.001 | x | ||
| Heat shock protein HSP 90-alpha | 1.074 | 0.009 | ||||
| Leukotriene A-4 hydrolase | 1.446 | 0.006 | x | |||
| A0A8I6A3A5 | Ig-like domain-containing protein | 1.988 | 0.01 | x | ||
| A0A8I6AUI8 | Myosin light chain 6 | 1.287 | 0.006 | |||
| A0A8I6A1P8 | Rac family small GTPase 2 | 2.491 | 0.004 | x | ||
| A0A8J8XU90 | Myosin, heavy chain 9 | 2.246 | 0.001 | |||
| 14-3-3 protein theta | 0.927 | 0.009 | x | |||
| A0A0G2K8V2 | Vinculin | 1.955 | 0.008 | x | x | |
| Histone H4 | 3.682 | 0.001 | ||||
| A0A8I5ZV49 | Filamin A | 3.058 | 0.002 | |||
| Coronin-1A | 2.063 | 0.006 | x | |||
| M0R7B4 | H1.3 linker histone, cluster member | 3.736 | <0.001 | |||
| Adenylyl cyclase-associated protein 1 | 1.640 | 0.002 | ||||
| A0A8L2QPP4 | F-actin-capping protein subunit alpha | 1.866 | 0.003 | x | ||
| A0A0G2K1A2 | Myeloperoxidase | 4.784 | 0.001 | x | x |
| Accession | Description | Log2 FC |
| NF | ND | DM |
|---|---|---|---|---|---|---|
| Insulin-like growth factor-binding protein 2 | −0.871 | 0.007 | x | x | ||
| Carboxypeptidase E | −0.991 | 0.009 | x | x | ||
| A0A8I6A2S5 | Heparan sulfate proteoglycan 2 | −1.115 | 0.008 | x | x | |
| F1LS40 | Collagen type I alpha 2 chain | −0.779 | 0.008 | |||
| D4A6P1 | Seizure related 6 homolog like 2 | −1.033 | 0.009 | x | ||
| G3V6E7 | Fibromodulin | −1.482 | 0.001 | x | ||
| A0A0G2K2V6 | Keratin 10 | −2.747 | 0.007 | x | ||
| A0A8I6ALJ7 | SPARC | −1.564 | 0.004 | x | ||
| Prolargin | −1.058 | 0.008 | x | |||
| Sushi, nidogen and EGF-like domain-containing protein 1 | −0.884 | 0.007 | ||||
| Lysyl oxidase homolog | −1.180 | 0.001 | ||||
| A0A0A0MXV3 | Cell growth regulator with EF hand domain 1 | −1.208 | 0.007 | |||
| G3V7Y2 | Osteomodulin | −0.788 | 0.007 | |||
| F1LMI3 | Cadherin 3 | −1.024 | 0.004 | |||
| Spondin-1 | −1.239 | 0.007 | x | |||
| Matrix Gla protein | −1.171 | 0.002 | x |
| Accession | Sample | Bgal - Median | Bgal - Q1 | Bgal - Q3 | IL1 - Median | IL1 - Q1 | IL1 - Q3 |
|---|---|---|---|---|---|---|---|
| Cortex | 18.996 | 18.971 | 19.780 | 25.691 | 25.324 | 26.048 | |
| LCR | 30.463 | 30.195 | 30.546 | 33.366 | 33.306 | 34.000 | |
| Cortex | 20.021 | 19.856 | 20.265 | 28.146 | 27.559 | 28.658 | |
| LCR | 25.397 | 23.991 | 25.530 | 30.729 | 26.031 | 31.387 |
| Accession | Description | Log2FC |
| Evidence in MS animal models | Evidence in MS patients |
|---|---|---|---|---|---|
| Protein S100-A8 | 6.757 | <0.001 | Increased microglial activation and apoptosis of oligodendrocytes | Increased in serum of RRMS ( | |
| A0A0G2JXN6 | Galectin 3 | 4.734 | <0.001 | -Cuprizone | Increased in SPMS patient sera ( |
| Alpha-1-acid glycoprotein (orosomucoid) | 4.628 | <0.001 | EAE and cuprizone ( | CSF and serum ( | |
| Leukocyte elastase inhibitor A | 4.311 | <0.001 | No | No | |
| Haptoglobin | 4.108 | <0.001 | No | -Serum RRMS ( | |
| A0A8J8YFZ4 | Polypyrimidine tract-binding protein 1 | 3.862 | <0.001 | TMEV ( | Tissue SNC ( |
| RT1 class I histocompatibility antigen, AA alpha chain | 3.799 | <0.001 | Cortical EAE ( | No | |
| A0A8I6GLW1 | Allograft inflammatory factor 1 | 3.201 | <0.001 | EAE ( | No |
| Afamin | 3.008 | <0.001 | EAE ( | No | |
| Fibrinogen gamma chain | 2.918 | <0.001 | EAE ( | No | |
| Hemopexin | 2.850 | <0.001 | EAE ( | Pediatric MS ( | |
| Fibrinogen alpha chain | 2.811 | <0.001 | No | SPMS ( | |
| Heat shock protein beta-1 (HSP27) | 2.804 | <0.001 | No | -Serum RRMS ( | |
| Plasminogen | 2.791 | <0.001 | EAE ( | -Genes and MS brains ( | |
| G3V9R2 | Complement factor H | 2.782 | <0.001 | EAE ( | -Serum and CSF ( |
| Cathepsin Z | 2.778 | <0.001 | EAE ( | No | |
| M0RBJ7 | Complement C3 | 2.774 | <0.001 | -EAE ( | -CSF and serum ( |
| A0A0G2K2Y3 | Aminopeptidase (ERAP 1) | 2.602 | <0.001 | EAE ( | Genes RRMS ( |
| Fibrinogen beta chain | 2.566 | <0.001 | No | -Blood SPMS ( | |
| Beta-2-microglobulin | 2.192 | <0.001 | TMEV ( | -CSF RRMS ( | |
| A0A8I5ZW66 | Vitamin D-binding protein | 2.129 | <0.001 | EAE ( | -Serum pediatric MS ( |
| Alpha-1-antiproteinase/antitrypsin | 1.943 | <0.001 | EAE ( | -CSF RRMS ( |
| Accession | Description | Log2FC |
| Evidence in MS animal models | Evidence in MS patients |
|---|---|---|---|---|---|
| A0A8L2R8P7 | Kininogen 1 | 3.072 | 0.001 | EAE CSF ( | Pediatric MS ( |
| Kininogen 1 | 2.475 | 0.003 | EAE CSF ( | Pediatric MS ( | |
| A0A0H2UHF8 | Orosomucoid 1 | 2.686 | 0.002 | EAE and Cuprizone ( | Plasma and CSF of MS patients ( |
| A0A0H2UHH2 | Amyloid P component, serum | 1.679 | <0.001 | EAE ( | Pediatric MS ( |
| A0A0G2JXI9 | Histone H2B | 2.482 | 0.002 | EAE ( | Plasma of MS patients ( |
| Protein S100-A8 | 4.681 | 0.005 | Increased microglia activation and apoptosis of oligodendrocytes | CSF RRMS ( | |
| A0A8I6A289 | Histone H3 | 1.661 | 0.007 | EAE, cuprizone ( | MS ( |
| F1M7F7 | Complement component C6 | 1.981 | 0.001 | EAE, cuprizone ( | Serum and CSF ( |
| Histone H4 | 3.682 | 0.001 | EAE, cuprizone ( | MS ( | |
| Coronin-1A | 2.063 | 0.006 | EAE ( | MS ( | |
| A0A0G2K1A2 | Myeloperoxidase | 4.784 | 0.001 | EAE ( | MS ( |
| A0A8L2R8P7 | Kininogen 1 | 3.072 | 0.001 | In EAE CSF ( | Pediatric MS ( |
| A0A0H2UHF8 | Orosomucoid 1 | 2.686 | 0.002 | EAE, cuprizone ( | CSF and serum of MS patients ( |
| A0A0G2K2V6 | Keratin 10 | −2.747 | 0.007 | Lysophosphatidyl choline ( | no |
| A0A8I6ALJ7 | SPARC | −1.564 | 0.004 | No | MS patients ( |
| Accession | Description | Log2FC |
| Evidence in MS animal models | Evidence in MS |
|---|---|---|---|---|---|
| A0A8I6GJU8 | Lymphocyte-specific protein 1 | 3.960 | <0.001 | No | No |
| A0A8I5ZLY7 | TAP binding protein | 3.640 | <0.001 | No | No |
| High-mobility group protein B2 | 3.514 | <0.001 | No | No | |
| A0A8I6G984 | Lymphocyte cytosolic protein 1 | 3.380 | <0.001 | No | No |
| A0A8I6A6Z2 | Capping actin protein, gelsolin like | 3.269 | <0.001 | No | No |
| Actin-related protein 2/3 complex subunit 1B | 2.817 | <0.001 | No | No | |
| A0A8I5Y662 | Ig-like domain-containing protein | 2.802 | <0.001 | No | No |
| D3ZE08 | Ig-like domain-containing protein | 2.428 | <0.001 | No | No |
| M0R838 | Ig-like domain-containing protein | 2.324 | <0.001 | No | No |
| A0A8L2Q3W7 | Pregnancy-zone protein | 2.192 | <0.001 | No | No |
| A0A8I6AQ74 | Ig-like domain-containing protein | 2.048 | <0.001 | No | No |
| Signal recognition particle receptor subunit beta | 1.838 | <0.001 | No | No | |
| Annexin A3 | 1.820 | <0.001 | No | No | |
| Ig gamma-2B chain C region | 1.507 | <0.001 | No | No | |
| D4A0A1 | SOGA family member 3 | −3.077 | <0.001 | No | No |
| A0A8I6AUM0 | DDHD domain containing 2 | −3.286 | <0.001 | No | No |
| Accession | Description | Log2FC |
| Evidence in MS animal models | Evidence in MS patients |
|---|---|---|---|---|---|
| A0A8I6A3A5 | Ig-like domain-containing protein | 1.988 | 0.01 | No | No |
| A0A8I6A1P8 | Rac family small GTPase 2 | 2.491 | 0.004 | No | No |
| A0A8J8XU90 | Myosin, heavy chain 9 | 2.246 | 0.001 | No | No |
| A0A0G2K8V2 | Vinculin | 1.955 | 0.008 | No | No |
| A0A8I5ZV49 | Filamin A | 3.058 | 0.002 | No | No |
| M0R7B4 | H1.3 linker histone, cluster member | 3.736 | <0.001 | No | No |
| Adenylyl cyclase-associated protein 1 | 1.640 | 0.002 | No | No | |
| A0A8L2QPP4 | F-actin-capping protein subunit alpha | 1.866 | 0.003 | No | No |
Peer Reviews
No public reviews on file for this paper yet. If you reviewed it on a platform where reviews are public (OpenReview, ICLR, NeurIPS, ICML), you can paste yours below so the community can read it here.
Videos
No videos yet. Explain this paper in a talk, walkthrough, or lecture? Add one.
Taxonomy
TopicsS100 Proteins and Annexins · Immune Response and Inflammation · Traumatic Brain Injury and Neurovascular Disturbances
Introduction
1
Multiple sclerosis (MS) is a neurodegenerative disease characterized by recurrent inflammatory events, demyelination, and axonal damage, along with loss of function (1). Furthermore, MS is a very heterogeneous disease that displays different clinical courses, including episodes of relapse followed by remission of symptoms [‘‘relapsing-remitting MS” (RRMS)], which can progress to a secondary progressive form (SPMS). In addition, patients may experience persistent progression from the onset of the disease [‘‘primary progressive MS” (PPMS)] (2). The progressive forms of MS (SPMS and PPMS) lead to patients acquiring a major irreversible neurological disability that severely affects their quality of life. Currently, cortical demyelination is considered a key feature in PPMS and SPMS patients and is less frequent in RRMS (3). These cortical lesions have clinical relevance because they show a stronger correlation with physical disability and cognitive impairment in several studies, even more frequently than those described for white matter lesions (4–7). Notably, it is noteworthy that the presence of cortical lesions at diagnosis has recently been shown to predict long-term cognitive decline in MS in a 20-year study (8). The pathogenesis of cortical lesions is still unknown. However, neurodegeneration and glial activation are predominant in these lesions. Therefore, the cortical microenvironment may influence the degree of inflammation, tissue damage, and lesion repair (9). These plaques of primary demyelination in the cortex represent a -specific key feature of MS, and they are not seen in other chronic neuroinflammatory conditions (10). To date, there are no available treatments for cortical lesions, mostly because research has been hampered by the availability of few animal models that reflect these characteristics (11). The majority of these few models have been developed based on experimental autoimmune encephalomyelitis (EAE) along with focal injection of cytokines. These lesions are characterized by demyelination, neuroinflammation, glial activation, and neuronal degeneration (11–15). These features, along with the chronicity of the lesions, vary depending on the animal model. Proteomic studies have not been performed in any of these animal models.
We have developed a focal cortical animal model triggered by the chronic expression of a prototypical pro-inflammatory cytokine, IL-1β, in the cortex and further peripheral inflammatory stimulation (16). In our model, the cortical lesions are characterized by demyelination, neurodegeneration, microglial/macrophage activation, and associated meningeal inflammation, lasting for at least 50 days. These pathological features correlate with impaired cognitive performance and anxiety-like symptoms in the animals. Interestingly, the meninges contain follicle-like structures very similar to those mainly observed in SPMS patients (16). This model represents one of five models that resemble MS cortical lesions, but it is the only one that exhibits a chronicity similar to that found in MS patients (12, 15, 17).
Additionally, there are current studies of the cerebrospinal fluid (CSF) and cortical tissue proteome in some animal models of MS, including EAE and cuprizone in rats. In the CSF of EAE, the authors found several important proteins, among them afamin and complement C3, which cause an increase in blood–brain barrier (BBB) permeability (18). The Frontal cortex proteomics of cuprizone and EAE mice also revealed several differential proteins such as Legumain and C1Q in cuprizone and hemopexin in EAE (19). Legumain was also found to be significantly higher in active and chronic lesions of postmortem MS brain tissue. Recently, the dorsal cortex and the spinal cord of two MS models (EAE and cuprizone) have demonstrated that orosomucoid-1 (Orm1) consistently exhibited alterations in both models and regions (20).
Here, we investigated the proteome of both cortical lesions and CSF in a novel cortical MS animal model (16). Our hypothesis posits that cortical lesions are mediated by key molecules contributing to inflammation, neurodegeneration, and behavioral symptoms. The objective of this study is to identify novel molecular pathways activated in the cortex and the CSF that may influence the formation and progression of cortical MS lesions as well as early specific indicators in the development of these lesions. Proteomic analysis of cortical lesions in this model aims to identify key proteins involved in the pathophysiology of cortical damage that could be validated in MS patients.
Materials and methods
2
Animals and surgeries
2.1
For all experiments, adult male Wistar rats were used (original colony obtained from the Jackson Laboratory, Bar Harbor, Maine, USA) and maintained for several generations at the Animal Facility of the Leloir Institute Foundation. The rats were 8–10 weeks old. The animals were kept in the vivarium at a constant temperature of 22 ± 2°C, under a light:dark cycle of 12:12 h, and with food and water available ad libitum. All procedures were performed following the regulations of the National Institutes of Health (NIH) of the United States and the internal regulations of the Leloir Institute Foundation, with the approval of the Institutional Commission for the Care and Use of Laboratory Animals of the Institute (CICUAL - FIL).
Intracerebral stereotaxic injections were performed in the morning to avoid the possible effects of circadian variations in cytokine expression on inflammatory responses. Animals were anesthetized with ketamine hydrochloride (80 mg/kg) and xylazine (8 mg/kg), and injected into the left prefrontal cortex (bregma, +1.6 mm; lateral, +2.5 mm; ventral, −1.6 mm) (21) with adenovirus expressing IL-1β (AdIL-1β) or adenovirus expressing β-galactosidase (Adβ-gal) as control. They were made with a drawn glass capillary (approximate diameter of 50 nm) in order to minimize nerve tissue damage due to surgery per se. The vectors were diluted in sterile 10 mM Tris-Cl buffer (pH 7.8) to a final concentration of 1 × 10^6^ infectious particles/μL. A final volume of 1 μL was injected. The injections were performed over a period of 5 min: in the first 4 min, the vector was administered (0.25 μL/min), and then the capillary was held in place for an additional minute in order to avoid reflux of the solution. Finally, the wound was cleaned and closed by suturing. The animals were kept under a lamp that provided heat until they recovered from anesthesia.
Peripheral booster stimuli
2.2
A total of 21 days after the central injection in the cortex, the peripheral stimulus was applied. AdIL-1β was used as a pro-inflammatory stimulus, applied intravenously (iv) from the tail vein of the animal. Adβ-gal was used as a control (Figure 1). The animals were anesthetized for a short period of time by inhalation of Isoflurane; once asleep, they were placed under light and the lateral tail vein was located and the injection was performed with a 27G needle: first, they were passed 300 μL of the adenovector at a concentration of 1.4 × 10^9^ infectious particles/μL, diluted in sterile 10 mM Tris-Cl buffer (pH 7.8); second, 300 μL of the sterile physiological solution was passed. Once the animals recovered from anesthesia, they were returned to their respective cages. The effectiveness of peripheral stimulation was verified by counting the peripheral leukocytes in the blood of the animals injected with both the AdIL-1β and the control adenovector. To do this, a drop of blood was taken from the tail of the rats and smeared on a glass slide. Once dry, the samples were stained with the May-Grünwald/Giemsa (MGG) technique, which allows qualitative and quantitative differentiation of the main blood components. The sample from which the blood smears were performed was taken 5 days after the IV injection since previous laboratory work had shown that this was the day when the peak of peripheral AdIL-1β effect was observed. In these experiments, to test functionality, it is expected for the peripheral AdIL-1β-injected animals to exhibit a significant increase in the number of neutrophils, together with a consequent decrease in the lymphocyte population, which is significantly different from the effects observed in the peripheral Adβ-gal-injected animals. As previously described, we evaluated the functionality of the animal model through various behavioral tests, including the open-field test and anxiety-like assessments, along with histological analyses (Supplementary Figures S1, S2). Additionally, we examined the anatomopathological features of the animals, similar to our previous analyses conducted on control animals for the proteomic experiments (16). We performed Cresyl Violet staining to assess general nervous tissue integrity and inflammation, alongside immunohistochemistry to evaluate demyelination, glial activation, and neurodegeneration. The results were consistent with those reported in our manuscript detailing the model, confirming cortical demyelination, neurodegeneration, and glial activation (16).
Experimental design. Animals received a central inflammatory stimulus on day 0 of AdIL-1β c or Adβ-gal c, and a peripheral injection of AdIL-1β p or Adβ-gal p after 21 days. The studies were performed at 7 days after the peripheral stimulation. Therefore, we have two experimental groups [AdIL-1β c/AdIL-1β p (experimental animals) and Adβ-gal c/Adβ-gal p (control animals)]. n = 5 per group.
In this work, we studied two groups: cortical IL-1β/peripheral IL-1β (IL-1β c/IL-1β iv) (n = 5) and cortical β-gal/peripheral β-gal (n = 5) (β-gal c/β-gal iv) as controls in order to obtain the greatest differential protein expression in each condition at 21 + 7 dpi, 7 days after intravenous injection of IL-1β or β-gal (Figure 1).
Cortical lesion sampling
2.3
On day 28, rat brains were excised postmortem, and the frontal cortex of the left hemisphere anterior to bregma, +1.6 mm, was collected by dissection and immediately stored at −80°C until further processing for proteomic analysis.
CSF sampling
2.4
On day 28, animals were anesthetized as previously described in the Animals and surgeries section; and the head was fixed in a stereotaxic apparatus. A skin incision was made, followed by a horizontal incision in the dorsal muscle. An insulin needle (27G × ½") was inserted into the cisterna magna, allowing us to obtain a maximum of 100 μL per animal. The samples were maintained on ice until centrifugation at 2,000g for 10 min at 4°C. The supernatant was aliquoted into 50 μL tubes and stored at −80°C until further processing for proteomics.
Proteomic analysis of cortical lesions
2.5
Preparation of cortical lesion samples
2.5.1
Individual cortical tissues (n = 5) were homogenized in RIPA-modified buffer (50 nM Tris-HCl, pH 7.5, 150 mM NaCl, 1 mM EDTA, 1% NP-40, and 0.1% sodium deoxycholate) with the addition of 5 mM b-glycerophosphate, 10 mM sodium fluoride, 10 mM sodium orthovanadate, and protease inhibitors from the Complete Protease Inhibitor Cocktail (Roche, Basel, Switzerland). Samples were sonicated for 5 min with 30 on/off cycles, kept on ice, and centrifuged for 10 min at 10,000 rpm at 4°C. Proteins from the supernatant were precipitated overnight at −20°C by adding a volume of ice-acetone in sixfold excess. The acetone-precipitated proteins were solubilized in a denaturation buffer (6 M urea and 200 mM ammonium bicarbonate in water). The final protein content was reduced and quantified using the Pierce BCA assay (Thermo Fisher, CA, USA). Proteins were reduced with dithiothreitol (DTT 1, 10 mM, 37°C, 60 min) and alkylated with iodoacetamide (IAM, 20 mM, 23°C, 30 min). Then, samples were diluted with 200 mM ammonium bicarbonate up to 2 M urea, digested overnight with Lys-C at 37°C, and then diluted again twofold and digested with trypsin at 37°C. Peptides were desalted using a C18 MicroSpin 300A silica column. (The Nest Group Inc, Ipswich, USA), evaporated to dryness using a SpeedVac and dissolved in 30 µL of 0.1% formic acid in water. The peptides obtained from the cortical lesions were purified using Preomics iST- BCT Sample Preparation kit 96x (Preomics, Martinsried, Germany). Then, 10 samples (5 cortical IL-1β/peripheral IL-1β and 5 cortical β-gal/peripheral β-gal) were sent to the Proteomics Unit of the Pompeu Fabra University (CRG-UPF), Spain in order to analyze the differential expression of lesion proteins.
Preparation of CSF samples
2.5.2
50µl of CSF (n=5) were purified using Proteomics IST-BCT Sample Preparation Kit for fluids (Preomics, Martinsried, Germany). The CSF was processed according to the manufacturer’s instructions. Five samples of each treatment were sent to the Proteomics Unit of the Natural Science Faculty of the University of Buenos Aires in order to analyze the differential expression of CSF proteins.
Chromatographic and mass spectrometric analysis
2.6
Analysis of cortical lesions
2.6.1
Samples were analyzed using an Orbitrap Eclipse mass spectrometer (Thermo Fisher Scientific, San Jose, CA, USA) coupled to an EASY-nLC 1200 [Thermo Fisher Scientific (Proxeon), Odense, Denmark]. Peptides were loaded directly onto the analytical column and were separated by reversed-phase chromatography using a 50-cm column with an inner diameter of 75 μm, packed with 2-μm C18 particles.
Chromatographic gradients were started at 95% buffer A and 5% buffer B at a flow rate of 300 nL/min and gradually increased to 25% buffer B and 75% buffer A in 79 min and then to 40% buffer B and 60% buffer A in 11 min. After each analysis, the column was washed for 10 min with 100% buffer B. Buffer A: 0.1% formic acid in water. Buffer B: 0.1% formic acid in 80% acetonitrile. The mass spectrometer was operated in positive ionization mode with a nanospray voltage set at 2.4 kV and a source temperature of 305°C. The acquisition was performed in data-dependent acquisition (DDA) mode, and full MS scans with 1-µm scans at a resolution of 120,000 were used over a mass range of m/z 350–1400 with detection in the Orbitrap mass analyzer. Auto gain control (AGC) was set to “standard” and injection time was set to “auto”. In each cycle of DDA analysis, following each survey scan, the most intense ions above a threshold ion count of 10,000 were selected for fragmentation. The number of selected precursor ions for fragmentation was determined by the “Top Speed” acquisition algorithm and a dynamic exclusion time of 60 s. Fragment ion spectra were produced via high-energy collision dissociation (HCD) at a normalized collision energy of 28%, and they were acquired in the ion trap mass analyzer. The AGC was set to 2E4, and an isolation window of 0.7 m/z and a maximum injection time of 12 ms were used. Digested bovine serum albumin (New England Biolabs, Ipswich, Massachusetts) was analyzed between each sample to avoid sample carryover and to ensure the stability of the instrument, and QCloud 1 was used to control the longitudinal performance of the instrument during the project.
Analysis of CSF
2.6.2
For chromatographic gradients, the samples were treated by reducing them with 20 mM DTT for 45 min at 56°C and alkylating them with 50 mM iodoacetamide for 45 min in the dark. Subsequently, they were digested with trypsin, which cleaves the peptide bonds of Arg and Lys on the C-terminal side, throughout the night. Peptide extraction was carried out using acetonitrile. The samples were lyophilized via SpeedVac and then reconstituted in 30 μL of 0.1% trifluoroacetic acid. Desalting was performed using the Zip Tip C18 column from Merck^®^. Analysis was conducted by nanoHPLC coupled to a mass spectrometer with Orbitrap technology, allowing for the separation of peptides obtained from trypsin digestion of the sample and subsequent identification. Sample ionization was achieved through electrospray.
The Mass Spectrometer was a Q-Exactive (Thermo Scientific, CA, USA), which has a High Collision Dissociation (HCD) cell and an Orbitrap analyzer. The configuration of the equipment enables peptide identification concurrently with chromatographic separation, yielding full MS and MSMS. A method was employed to maximize the number of measurement cycles per unit of time. The cycle duration depends on the chosen resolution. In each cycle, the equipment performs a Full MS and subsequently conducts MSMS on the 12 peaks with the best signal-to-noise ratio in that cycle, employing a dynamic exclusion range to reduce the frequency of peptide fragmentation during its chromatographic elution. The spectra were analyzed with the Proteome Discoverer program (Perseus).
Proteomic data analysis
2.7
Cortex
2.7.1
The acquired spectra were analyzed using the Proteome Discoverer software suite (v2.0, Thermo Fisher Scientific) and the Mascot search engine (v2.6, Matrix Science 2). The data were searched against a Uniprot_Rat database (as of March 2023, 47,943 entries) plus a list of the three most common contaminants and all the corresponding decoy entries. For peptide identification, a precursor ion mass tolerance of 7 parts per million (ppm) was used for the MS1 level, trypsin was chosen as the enzyme, and up to three missed cleavages were allowed. The fragment ion mass tolerance was set to 0.5 Da for MS2 spectra. Oxidation of methionine and N-terminal protein acetylation were used as variable modifications, whereas carbamidomethylation on cysteines was set as a fixed modification. The false discovery rate (FDR) for peptide identification was set to a maximum of 5%. Peptide quantification data were retrieved from the “Precursor ions quantifier” node of Proteome Discoverer (v2.5) using a 2 ppm mass tolerance for the peptide extracted ion current (XIC). The obtained values were used to calculate protein fold changes and their corresponding p-values and adjusted p-values. The raw proteomic data have been deposited in the PRIDE 4 repository under the dataset identifier PXD050417.7.2. CSF. The digests were analyzed by nanoLC-MS/MS in a Thermo Scientific Q-Exactive Mass Spectrometer coupled to a nanoHPLC EASY-nLC 1000 (Thermo Scientific). For the LC-MS/MS analysis, approximately 1 μg of peptide was loaded onto the column and eluted for 120 min using a reverse-phase column (C18, 2 µm, 100 A, 50 µm × 150 mm) Easy-Spray Column PepMap RSLC (P/N ES801), which is suitable for separating protein complexes with a high degree of resolution. The flow rate used for the nano column was 300 nL min^−1^ and the solvent ranged from 7% B (5 min) to 35% (120 min). Solvent A was 0.1% formic acid in water, whereas solvent B was 0.1% formic acid in acetonitrile. The injection volume was 2 µL. The MS equipment has an HCD cell for fragmentation and an Orbitrap analyzer (Thermo Scientific, Q-Exactive). A voltage of 3,5 kV was used for ElectroSpray Ionization (Thermo Scientific, EASY-SPRAY, CA, USA)). XCalibur 3.0.63 (Thermo Scientific, CA, USA) software was used for data acquisition and equipment configuration, allowing peptide identification concurrently with chromatographic separation. Full-scan mass spectra were acquired on the Orbitrap analyzer. The scanned mass range was 400–1,800 m/z at a resolution of 70,000 at 400 m/z, and the 12 most intense ions in each cycle were sequentially isolated, fragmented by HCD, and measured in the Orbitrap analyzer. Peptides with a charge of +1 or unassigned charge states were excluded from fragmentation for MS2.
Analysis of mass spectrometry data
2.7.2
Q-Exactive raw data were processed using Proteome Discoverer software (version 2.2 Thermo Scientific) and searched against the Rattus norvegicus (Rat) UP000002494_2023_12_11 protein sequence database with trypsin specificity and a maximum of one missed cleavage per peptide. Proteome Discoverer searches were performed with a precursor mass tolerance of 10 ppm and a product ion tolerance of 0.05 Da. Static modifications were set to carbamidomethylation of Cys, and dynamic modifications were set to oxidation of Met and N-terminal acetylation. Protein hits were filtered for high-confidence peptide matches with a maximum protein and peptide FDR of 1% calculated by employing a reverse database strategy. A multi-consensus report was generated using the Proteome Discoverer software. Proteome Discoverer calculates an area for each protein in each condition. To do this, it uses the area under the curve of the three most intense peptides for a protein. Areas were calculated for each of the three replicates and normalized. The data obtained for the area for each protein were processed with the Perseus program (Max Planck Institute of Biochemistry, 1.5.5.3 version, available for free) which allows a deeper statistical analysis. Different scatter plots were prepared according to the compared samples. For each couple of samples, we plotted the log p-value (-Log Student’s t-test p-value A_B) on the y-axis against the Student’s t-test difference A_B on the x-axis. Proteins appear in the volcano plot with a fold change greater than 2 (less than −1 or greater than 1 on the x-axis of the graph) and a p-value below 0.05 (greater than 1.3 on the y-axis of the graph) were considered to be differentially expressed.
Statistical analysis
2.8
All statistical analyses were performed using R statistical software (https://www.r-project.org/). Protein abundance was normalized and log2 scaled if required. Quality assessment was performed following Ritchie et al. (22) by applying principal component analysis (PCA) to the samples from each location (Supplementary Figure S2).
A linear model was fitted for each protein between conditions for each localization, and an empirical moderated t-statistic test for each individual contrast equal to zero was applied by using the limma R package (22). For the cortex-derived samples, the p-values were adjusted with the p-adjust function. To define differential abundance between conditions, an alpha of 0.05 was selected.
Results
3
Proteomics of the cortex
3.1
We generated the cortical lesions by injecting AdIL-1β into the cortex, followed by a booster injection of the same adenovector peripherally as described by Silva et al. (16). This model was validated using blood smears, behavioral tests, and anatomopathological studies on the animals utilized for proteomic analysis as previously published (Supplementary Figures S1, S2). As described in the Materials and Methods section, we studied two groups: one with cortical IL-1β/peripheral IL-1β (experimental group) (IL-1β c/IL-1β iv) (n = 5) and the other with cortical Adβ-gal/peripheral Adβ-gal (β-gal c/β-gal iv) (control group) (n = 5) administration (Figure 1). As expected, animals in the experimental group showed behavioral alterations and an increase in leukocyte blood count (Supplementary Figure S1). In addition, we performed some controls for the proteomics, and the IL-1β c/IL-1β iv animals presented a diminished inflammatory infiltration and less glial activation compared with β-gal c/β-gal iv (Supplementary Figure S2).
Proteomic analysis in cortical lesions revealed 5,336 expressed proteins (Supplementary Data S1) (Supplementary Figure 3). To select the molecules showing the highest differences with respect to the entire dataset, we performed further bioinformatic analysis on those molecules whose expression was highly differential between the two groups. As an initial observation, we found no significant variation in the total protein levels between experimental and control animals in the cortex samples (Figure 2A).
Proteomic profiling of the cortex. (A) Box plots of the normalized abundance of the total amount of proteins in both experimental (blue) and control groups (pink). No significant variation in the total protein levels between the cortex of the experimental and control animals. (B) Heatmap of the differentially expressed proteins (DEPs) in the cortex of experimental animals compared to control animals. Each column of the heatmap represents one animal and the rows indicate the expression of the DEPs. (C) Volcano plot of the DEP proteins in the cortex. (D) Venn diagrams showing the number of DEPs in each biological process (neuroinflammation, neurodegeneration, and demyelination).
Of the 5,336 proteins identified in this study, 45 were found to be discriminatory between the experimental groups (IL-1β c/IL-1β iv vs. β-gal c/β-gal iv) based on highly stringent criteria (p < 0.01) (Figures 2B, C) (Table 1). Additionally, we performed the analysis considering p < 0.05, in which case we obtained 62 differentially expressed proteins (Supplementary Table S1). We focused the analysis using a stricter criterion with p < 0.01. Based on this criterion, out of 45 proteins, 2 were downregulated and 8 have not been described in MS animal models or connected with MS patients. We classified the proteins based on bibliographic searches into three main potential functions in the CNS that are implicated and represent the main findings in pathophysiology studies of MS: neurodegeneration, demyelination, and neuroinflammation. Out of 45 potential proteins, 26 were related to neuroinflammation, 9 were related to demyelination, and 20 were related to neurodegeneration (see Table 1, Figure 2D). The Venn diagram visualized the overlap of the different processes in which the proteins are involved (Figure 2D). Only 10 proteins could not be assigned to any of these important features in the MS cortex of patients, providing a first indication of the validity of the previously described model.
Table 1: Differentially expressed proteins in the cortex (p < 0.01).
Bibliographical analysis revealed that the majority of the differential proteins were related to inflammation, migration, integrin signaling, and protease activity, although we did not further analyze these proteins related to the inflammatory process because their presence is expected since we induced inflammation as part of the model. Nevertheless, again, their identification validates inflammation as the biological process underlying the model.
There are several interesting differential proteins based on both their abundance and their possible function related to the MS pathophysiology. Among them, we found upregulated proteins in experimental animals, such as S100A8, orosomucoid, galectin-3, afamin, hemopexin, pregnancy zone protein, gelsolin, and vitamin D-binding protein. Among the main differential proteins, there are three proteins that are involved in both neurodegeneration and demyelination processes but not in neuroinflammation: gelsolin (GSN), polypyrimidine tract-binding protein 1 (PTB), and RT1 class histocompatibility antigen AA alpha chain (RT1). Therefore, these proteins may be relevant to the pathophysiology independent of the inflammatory process.
Proteomics of the CSF
3.2
As an initial observation, we found no significant variation in the total protein levels between experimental and control animals in the CSF samples (Figure 2A). Proteomic analysis of the CSF demonstrated the presence of 6,427 relevant proteins.
Of the 6,427 identified proteins, 48 proteins were differentially expressed between the two experimental groups at p < 0.01 (IL-1β c/IL-1β iv vs. β-gal c/β-gal iv) (Tables 2A, B, Figure 3). Out of 48 differential proteins, 16 were downregulated (Table 2) (Figures 3B, C). We also classified the proteins according to bibliographic research into three different main potential functions: neurodegeneration, demyelination, and neuroinflammation, where 17 proteins were related to neuroinflammation, 7 were related to demyelination, and 15 were related to neurodegeneration (see Table 2, Figure 3D). The Venn diagram visualized the overlap of the different processes in which the proteins are involved (Figure 3D). Out of the 48 proteins, 16 proteins were downregulated and related to the control animals, and 8 proteins were not mentioned in either the MS animal models or those related to MS patients.
Table 2A: Differentially expressed proteins upregulated in the CSF (p < 0.01).
Table 2B: Differentially expressed proteins downregulated in the CSF (p < 0.01).
Proteomic profiling of the CSF. (A) Box plots of the normalized abundance of the total amount of proteins in both experimental (blue) and control groups (pink). No significant variation in the total protein levels between experimental and control animals in the CSF. (B) Heatmap of the differentially expressed proteins (DEPs) in the CSF in experimental animals relative to control animals. Each column of the heatmap represents one animal and the rows indicate the expression of DEPs. (C) Volcano plot of the DEP proteins in the CSF. (D) Venn diagrams showing the number of DEPs in each biological process (neuroinflammation, neurodegeneration, and demyelination).
Differentially expressed proteins were related to acute class I proteins, such as haptoglobin, ceruloplasmin, Orm1 (alpha 1 acid glycoprotein), and components of the complement system. These proteins were upregulated during the ongoing inflammatory processes (23–25).
Interestingly, we found 16 downregulated proteins in the CSF. Among these proteins, we found some of them to be related to the extracellular matrix (lysyl oxidase, spondin-1, fibromodulin, prolargin, collagen type 1 alpha 2 chain, and SPARC). Insulin-like growth factor binding protein 2 was also downregulated and described to be involved in neuroprotective and myelinogenetic effects (26). In addition, in the CSF, S100A8 and Orm1 were differentially expressed, which are analyzed in the Discussion section.
Analysis of the proteomics of cortex and CSF
3.3
Linear regression contrasting IL-1β c/IL-1β iv vs. β-gal c/β-gal iv was adjusted to each protein across all samples. Differentially expressed proteins were identified, and those with differential abundance and an adjusted p < 0.01 in both regions were then selected.
PCA was conducted on samples from both regions, revealing that the two experimental conditions clustered appropriately, albeit with a slightly smaller distance than those derived from the CSF (Figure 4).
Shared proteins between the cortex and CSF based on the median and IQR with the filter of p < 0.01.
We found two proteins, S100A8/A9 and Orm1, that were highly expressed in both compartments, cortex, and CSF (Figure 3) (Table 3).
Table 3: Differentially expressed proteins in both cortex and CSF (p < 0.01).
Discussion
4
Our group has developed one of the few animal models that reflects the characteristics of cortical compromise of MS. We have previously described the anatomopathological, behavioral, and radiological characteristics of our model (16). Furthermore, we have demonstrated the cortical effects of repeated peripheral inflammation over long periods of time (27) and the effect of non-pharmacological interventions on these findings (28). In the present work, we propose to study in depth the proteome of the cortical lesion and CSF in the proposed model aiming to identify a molecular expression pattern that could reveal new therapeutic targets and biomarkers involved in cortical compromise. To the best of our knowledge, only a few publications have analyzed the cortical proteome of two other animal models: EAE and cuprizone (18–20).
The proteomic analyses revealed distinct regional differences in this cortical model of MS mediated by the innate immune system that we developed. Differences in the proteome were found between frontal cortex tissue and CSF when comparing experimental animals with control animals. Notably, the induction of the cortical lesions did not lead to an increase in the total amount of proteins in either of the studied areas. Interestingly, despite the presence of different proteins in the two analyzed regions, we identified two proteins that were highly expressed in both areas.
Specifically, our study uncovered that proteins associated with inflammation were upregulated in animals injected with cortical and peripheral AdIL-1β. However, our focus for further analysis will be on proteins that are not strictly linked to the inflammatory process. In this study, we identified several proteins that have already been described either in MS patients or animal models (Tables 4A, B). However, we also discovered novel molecules that have not been previously reported (Tables 5A, B). These novel molecules may play a role in mechanisms specifically related to the pathogenesis of cortical lesions. The majority of the proteins identified in both cortex and CSF are involved in inflammatory and neurodegenerative processes, with fewer proteins playing a role in demyelination. These findings suggest that our model more closely mimics the cortical EAE model, which is widely accepted in the scientific community as the model that most closely resembles the pathophysiology of MS, as opposed to classic demyelination models such as cuprizone or lysolecithin.
In the cortex of experimental animals, we identified 45 proteins that met highly stringent criteria for discrimination. The majority of these proteins are associated with the pathophysiology of multiple sclerosis (MS), particularly in processes related to neurodegeneration, demyelination, and neuroinflammation (Tables 1, 2). In the cortex analyses, three proteins were found to be implicated in both neurodegeneration and demyelination processes, but not in neuroinflammation, namely, gelsolin (GSN), polypyrimidine tract-binding protein 1 (PTB), and RT1 class histocompatibility antigen AA alpha chain (RT1). Therefore, these proteins may be relevant to the pathophysiology independent of the inflammatory process. Gelsolin is the fourth most abundant protein in the body and its depletion in the blood has been found in MS patients. The secreted form of gelsolin (pGSN) decreased in the blood of EAE mice, and pGSN concentration increased in the EAE brain (29, 30). In addition, gelsolin works downstream of the LINGO-1 signaling pathway, which enhances actin dynamics and is essential for oligodendrocyte precursor cells’ morphogenesis and differentiation (31). PTB is important for neuronal differentiation, suggesting that this molecule may contribute to the pathogenesis of demyelination and neurodegeneration in MS lesions and in vitro cultured primary human brain-derived oligodendrocytes (32). PTB was found to be mislocalized in the Theiler murine encephalomyelitis virus (TMEV)-infected cells (33). Finally, cortical demyelination was exclusively observed in EAE-susceptible non-major histocompatibility complex (MHC)-congenic LEW rat strains and EAE rat strains with a permissive LEW[U2] [C3]. Specifically, cortical demyelination was identified solely in EAE rats of the LEW.1AR1 (RT1) and LEW.1W (RT1) strains (34, 35). We also found interesting molecules that are involved in the pathogenesis of the cortical lesions. Among them, Afamin, a member of the albumin family, was found to be upregulated in rat EAE, along with vitamin D-binding protein, which was found to be upregulated in rat EAE and the CSF of patients with progressive MS (18, 36). Interestingly, in the cortex, we found the pregnancy zone protein (PZP) with a criterion of p < 0.05 (see Supplementary Table S1). PZP was found in the serum of subjects who later developed Alzheimer’s disease (AD) in comparison to controls who remained dementia-free. PZP immunoreactivity was localized to microglial cells in the cortex of AD patients that interacted with senile plaques and was occasionally observed in neurons (37). The latter two proteins, which have been found to be related to dementia, may be involved in the cognitive impairment observed in MS patients with cortical lesions. Specifically, the proteome of the frontal cortex has been characterized in a few publications that included two MS animal models (cuprizone and EAE). The authors found that Legumain and C1q complement proteins were upregulated in the cuprizone model and hemopexin in the EAE model. Cuprizone is a model of re- and demyelination, and EAE is a T cell-mediated model. However, our model is based on innate immunity, and the animals only exhibited cortical lesions, making it a very clean model to study these lesions. In our study, we have found upregulation in some of the proteins that were described in the previous models, such as hemopexin, which we found upregulated in the cortical tissue. Hemopexin is an acute-phase protein synthesized by hepatocytes in response to the pro-inflammatory cytokines IL-6, IL-1β, and TNF-α, which was described in pediatric MS patients and several MS animal models (38). The expression of this protein could be upregulated in our model because we generated the cortical lesions based on IL-1β injection into the cortex, which, in turn, upregulated IL-6 and TNF-α (16).
In the case of CSF, there were no proteins found to be involved in both demyelination and neurodegeneration without neuroinflammation. Differential upregulated proteins, such as haptoglobin, ceruloplasmin, Orm1 (alpha 1 acid glycoprotein), and components of the complement system were related to the acute class I protein, which was upregulated during the ongoing inflammatory processes (39). The proteomic study of the CSF from EAE animals demonstrated that some of the previous proteins were also upregulated in the rat EAE model: among them, haptoglobin, orosomucoid, ceruloplasmin, and T-kininogen (18). Recently, Barriola et al. (2023) demonstrated that Orm1 was upregulated in two different models (cuprizone and mouse EAE) and two different regions (dorsal cortex and the entire spinal cord) (20). As mentioned above, Orm1 was one of the proteins mainly upregulated in both the CSF and frontal cortex in our model. Interestingly, some of the downregulated proteins in the CSF were related to the extracellular matrix: matrix (lysyl oxidase, spondin-1, fibromodulin, prolargin, collagen type 1 alpha 2 chain, and SPARC). The protein insulin-like growth factor binding protein 2 has been described to be involved in neuroprotective and myelinogenetic effects (40), and has been found to be upregulated in the microglia/macrophages in active MS lesions (41). However, it was not upregulated in the CSF of MS patients (42); carboxypeptidase E has been described to be upregulated in pediatric MS patients (43, 44).
We also performed a further analysis in order to search which proteins were expressed in both compartments, cortex and CSF. Two proteins, S100A8 and Orm1, were upregulated in both compartments with the strict criterion of p < 0.01.
S100A8 is a Ca^2+^ binding protein belonging to the S100 family. This protein is constitutively expressed in neutrophils and monocytes. During the inflammatory process, S100A8 is actively released and exerts a crucial role in modulating inflammation by stimulating leukocyte recruitment and inducing cytokine expression (45). Pro-inflammatory cytokines, such as TNF-α and IL-1β, induce its transcription (46). Therefore, this protein could be considered as a candidate biomarker and as an indicator of response to inflammation-associated disease. The expression of S100A8/A9 in this model may be related to the presence of neutrophils induced by IL-1β, which characterizes this model (16). As previously described, the model is based on neutrophil recruitment as the first symptom; this recruitment of neutrophils decreases over time. The neutrophil wave is followed by an increase in microglia/monocyte recruitment (16). Recently, the role of neutrophils in the pathogenesis of MS has begun to be studied, especially considering that these immune cells have been underestimated in the context of MS (47). The presence of neutrophils has been described as a trigger of the inflammatory process in the EAE and JHM strains of the mouse hepatitis virus demyelinating model and in the cuprizone model (48, 49). It has been proposed that the neutrophils contribute to EAE pathology by disrupting the BBB, as occurred in our model, in which neutrophils contributed to BBB breakdown (16, 50). Neutrophils accumulated in the meninges of EAE mice during the preclinical and peak stages, as described in our AdIL-1β induced model. Even though neutrophils were among the last immune cell types described to be involved in the pathogenesis of MS, nowadays, the role of neutrophils in MS patients is still not fully understood, but research is still ongoing in order to elucidate their function in MS disease. Neutrophils have been found in the CSF in both adult and pediatric MS patients during relapses and in the early disease stages (47, 51, 52). At present, research is focused on elucidating whether neutrophils can be proposed as biomarkers and whether the manipulation of neutrophils can be used in future MS treatments (53).
S100A8 is significantly increased in the serum of RRMS patients (53). Indeed, it has been demonstrated that S100A8/A9 treatment induces activation, proliferation, and migration of the murine microglial cell line BV-2, which changes the microglial state from an anti-inflammatory state (M2) to a pro-inflammatory phenotype (M1) (54). Interestingly, S100A8 has not been described in any animal model of MS.
Orm1, also known as alpha 1 acid glycoprotein, acts as a transport protein in the bloodstream and modulates the activity of the immune system during the acute-phase reaction and is a glycoprotein mainly formed in the liver; it is also highly expressed in the frontal cortex (55). The expression of the Orm1 gene is mainly controlled by glucocorticoids and interleukins (IL-1β, TNF-α, and IL-6). It is interesting to mention that these pro-inflammatory proteins were also found to be upregulated in our model (16). Orm1 was found to be altered in two different regions, the spinal cord and frontal cortex, in two different models, EAE and cuprizone (20). Orm1 has been described in the CSF, serum, and plasma of MS patients (53, 56–60). Recently, a study focused on two different regions, the dorsal cortex, and the entire spinal cord, in two different models (EAE and cuprizone), and the authors identified Orm1 as a single protein that consistently exhibited alterations in both models and regions (23).
Finally, in the present work, we identified molecules that were upregulated or downregulated in both cortical tissue and CSF in other animal models of MS and that were also analyzed as biomarkers of MS development or disease progression in the blood, CSF, and brain tissue of MS patients (Tables 4, 5). Some of them, such as haptoglobin, hsp 27, plasminogen, complement C3, beta 2 microglobulin, and vitamin D-binding protein, are in more advanced phases of research and their relevance as biomarkers has been demonstrated in many studies (Table 4). On the other hand, our work provided a large number of new cortical and CSF molecules not found in other animal or patient studies of MS (Table 5). This work opens the door to the search for new therapeutic targets and MS biomarkers of cortical involvement.
The advantage of this model is its exclusive focus on frontal cortex lesions. Consequently, this study not only validates the model as a novel representation of MS cortical lesions but also suggests that some of the identified molecules could serve as potential biomarkers for MS, particularly in forms where cortical lesions are the predominant pathophysiological feature. Again, investigating molecules that have not been previously associated with MS pathology could be valuable in the search for novel prognostic markers or biomarkers. The translation of prognostic molecules from animal models to MS patients is crucial, as it enables the discovery of new biomarkers or key molecules that would be challenging to identify in human studies. Further validation studies will be necessary to identify specific target molecules that may be involved in each form of MS.
The reference list from the paper itself. Each links out to its DOI / PubMed record.
- 1Reich DS Lucchinetti CF Calabresi PA. Multiple sclerosis. New Engl J Med. (2018) 378:169–80. doi: 10.1056/NEJ Mra 1401483 PMC 694251929320652 · doi ↗ · pubmed ↗
- 2Lublin FD Reingold SC Cohen JA Cutter GR Sorensen PS Thompson AJ. Defining the clinical course of multiple sclerosis: the 2013 revisions. Neurology. (2014) 83:278–86. doi: 10.1212/WNL.0000000000000560 PMC 411736624871874 · doi ↗ · pubmed ↗
- 3Kutzelnigg A Lucchinetti CF Stadelmann C Bruck W Rauschka H Bergmann M. Cortical demyelination and diffuse white matter injury in multiple sclerosis. Brain: J Neurol. (2005) 128:2705–12. doi: 10.1093/brain/awh 641 16230320 · doi ↗ · pubmed ↗
- 4Calabrese M Poretto V Favaretto A Alessio S Bernardi V Romualdi C. Cortical lesion load associates with progression of disability in multiple sclerosis. Brain: J Neurol. (2012) 135:2952–61. doi: 10.1093/brain/aws 246 23065788 · doi ↗ · pubmed ↗
- 5Nelson F Datta S Garcia N Rozario NL Perez F Cutter G. Intracortical lesions by 3t magnetic resonance imaging and correlation with cognitive impairment in multiple sclerosis. Multiple Sclerosis. (2011) 17:1122–9. doi: 10.1177/1352458511405561 PMC 315147321543552 · doi ↗ · pubmed ↗
- 6Curti E Graziuso S Tsantes E Crisi G Granella F. Correlation between cortical lesions and cognitive impairment in multiple sclerosis. Brain Behav. (2018) 8:e 00955. doi: 10.1002/brb 3.955 29974667 PMC 5991593 · doi ↗ · pubmed ↗
- 7Harrison DM Roy S Oh J Izbudak I Pham D Courtney S. Association of cortical lesion burden on 7-T magnetic resonance imaging with cognition and disability in multiple sclerosis. JAMA Neurol. (2015) 72:1004–12. doi: 10.1001/jamaneurol.2015.1241 PMC 462002726192316 · doi ↗ · pubmed ↗
- 8Ziccardi S Pisani AI Schiavi GM Guandalini M Crescenzo F Colombi A. Cortical lesions at diagnosis predict long-term cognitive impairment in multiple sclerosis: A 20-year study. Eur J Neurol. (2023) 30:1378–88. doi: 10.1111/ene.15697 36692863 · doi ↗ · pubmed ↗