Center-Related Variation in Hospitalization Cost for Patients Undergoing Percutaneous Left Atrial Appendage Occlusion
Shivaraj Patil, Chaitanya Rojulpote, Abhijit Bhattaru, Avica Atri, Krishna Vamsi Rojulpote, Ola Khraisha, Viha Atri, William Frick, Tarek Nafee, Kishore Harjai, Sumeet Mainigi, Chien-Jung Lin

TL;DR
This study shows that hospital costs for a heart procedure called Watchman device implantation vary significantly between hospitals, with factors like hospital experience and complications affecting the cost.
Contribution
The study identifies hospital-specific factors contributing to cost variability in Watchman device implantation, emphasizing the need for standardized practices.
Findings
Hospital costs for the Watchman procedure varied widely, with 13% of cost differences linked to the hospital itself.
Higher-volume hospitals had lower costs and less cost variation compared to low-volume hospitals.
Procedural complications, heart failure, and longer hospital stays were linked to higher costs.
Abstract
The commercial use of percutaneous left atrial appendage occlusion with the Watchman device is increasing in the United States. The purpose of this study was to evaluate center-related variation in total hospital costs for Watchman device implantation and identify factors associated with high hospital costs at a national level. All adults undergoing elective left atrial appendage occlusion with Watchman were identified in the 2016-2018 National Inpatient Database. Mixed models were used to evaluate the impact of center on total hospital costs, adjusting for patient and center characteristics and length of stay. A total of 30,175 patients underwent Watchman device implantation at a median cost of 13,900-37,000). Nearly 13% of the variability in patient-level costs was related to the center…
Genes, proteins, chemicals, diseases, species, mutations and cell lines named across the full text — each resolved to its canonical identifier and authoritative record.
Click any figure to enlarge with its caption.
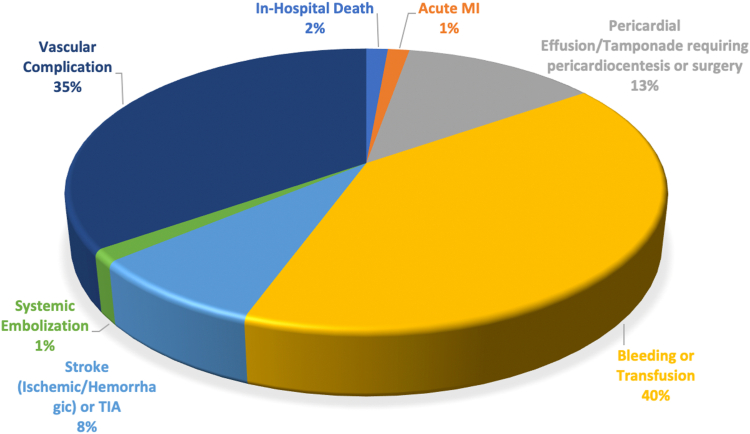 Figure 1
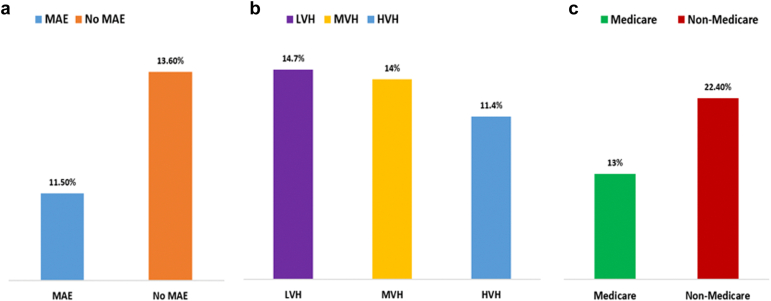 Figure 2
Peer Reviews
No public reviews on file for this paper yet. If you reviewed it on a platform where reviews are public (OpenReview, ICLR, NeurIPS, ICML), you can paste yours below so the community can read it here.
Videos
No videos yet. Explain this paper in a talk, walkthrough, or lecture? Add one.
Taxonomy
TopicsAtrial Fibrillation Management and Outcomes · Health Systems, Economic Evaluations, Quality of Life · Cardiac Arrhythmias and Treatments
Introduction
Stroke among atrial fibrillation (AF) patients is a major cause of disability and substantial economic burden.1 Long-term oral anticoagulation (OAC) has been the mainstay of treatment for prevention of cardioembolic stroke in AF. Percutaneous left atrial appendage occlusion (LAAO) has become an attractive alternative to reduce the risk of stroke in patients with nonvalvular AF when OAC is not suitable or hazardous.2
LAAO with the Watchman device (Boston Scientific, Marlborough, Massachusetts) was approved in March 2015 in the United States and is being increasingly utilized for mitigation of thromboembolic risk.3 While the initial cost of LAAO with the Watchman device is high, it has proven to be a cost-effective treatment strategy compared to vitamin K antagonists and non-vitamin K antagonist OAC therapies.4^,^5 With the sustained rise in US health care expenditures and increasing emphasis on value-based health care delivery, examination of costs associated with Watchman device implantation is particularly relevant.6
To date, variation in Watchman procedure-related expenditures has not been studied. Thus, the purpose of this study was to evaluate center-related variation in total hospital costs for Watchman device implantation and identify factors associated with high hospital costs at a national level.
Methods
Data Source
We performed a 3-year population-based retrospective cross-sectional analysis using national (United States) data from January 2016 to December 2018. The National Inpatient Sample (NIS) database is the largest publicly available all-payer inpatient care database from the United States. It is developed as a part of the Healthcare Cost and Utilization Project (HCUP) and is sponsored by the Agency for Healthcare Research and Quality, available at https://www.hcup-us.ahrq.gov/overview.jsp. The NIS includes data from all nonfederal, short-term, general, and other specialty hospitals in the United States (excluding rehabilitation and long-term acute care hospitals) in the form of deidentified patient information containing demographics, discharge diagnoses, comorbidities, procedures, outcomes, and hospitalization costs. All states that participate in HCUP provide data to the NIS, covering >95% of the US population. The database was designed to include data from a 20% sample of discharges from all participating hospitals. This design of the NIS reduces the margin of error for estimates and delivers more stable and precise estimations. The study was exempt from an institutional review board approval because HCUP-NIS is a publicly available database containing only deidentified patient information.
Study Population
All adults (age ≥18 years) who underwent elective LAAO with Watchman device were identified using the International Classification of Diseases-10th Revision procedure code 02L73DK. Patients with missing data on age, sex, hospitalization costs, and in-hospital mortality were excluded. Furthermore, to reduce the possibility of data duplication, patients with an indicator for transfer to another acute-care facility were excluded.
Variable Definitions
Baseline patient characteristics including age, sex, race, income level, and payer status were defined in accordance with the NIS data dictionary. The previously validated Charlson comorbidity index (CCI) was used to quantify the burden of chronic conditions. In-hospital major adverse events (MAEs) were defined as the composite of mortality, stroke (ischemic or hemorrhagic) or transient ischemic attack, bleeding or transfusion, vascular complications, myocardial infarction, systemic embolization, and pericardial effusion or tamponade requiring pericardiocentesis or surgery. The International Classification of Diseases-10th Revision codes used to define these variables are listed in Supplemental Table 1. Annual hospital volume was calculated as the total number of elective Watchman device implantation performed at each center. Hospitals were subsequently classified into low volume: ≤15 procedures/year (LVH), medium volume: 16-35 procedures/year (MVH), and high volume: ≥36 procedures/year (HVH) based on their annual case load. Hospitalization costs were generated by application of a hospital-specific cost-to-charge ratio and inflation adjusted to 2018. Total hospitalization costs represent the expenses incurred in the production of hospital services, such as wages, supplies, and utility. However, physician professional fees are not captured by the NIS database. Admission was designated as a high-cost hospitalization if total unadjusted hospitalization cost was in the highest decile.
Outcome
The primary outcome was total hospitalization cost at patient level and its variation related to center-level differences. We also analyzed the variation in MAE attributable to center-level differences due to high correlation between the incidence of complications and hospitalization costs at the patient level. Secondarily, we assessed patient characteristics and predictors of high-cost hospitalization for LAAO with Watchman device.
Statistical Analysis
National estimates were calculated by applying discharge weights. Categorical variables are reported as proportions and compared using Pearson’s chi-squared test. Continuous variables are reported as means with SD or median with interquartile range (IQR), when appropriate. Means and medians were compared using independent samples t-test and Mann-Whitney U test, respectively. Median costs from 2016 to 2018 and between LVH, MVH, and HVH were compared using nonparametric, independent samples Kruskal-Wallis test. A multivariate regression model with high-cost hospitalization status as dependent variable was developed to examine predictive factors. To evaluate the effect of individual center on total hospital costs, a 2-level log-gamma generalized mixed effects model was used with centers as a random effect because of the skewed distribution of cost data (Supplementary figures 1-5). The proportion of total cost variation explained by the random center effect was calculated. SPSS Statistics 25.0 (IBM Corp., Armonk, New York) and R statistical software (R Core Team 2020) were used to perform the statistical analysis. All p values were 2-sided with a significance threshold of <0.05.
Results
A total of 30,175 patients met the study criteria and underwent elective admission for Watchman device implantation at an average of 290 hospitals per year across the United States. The mean age was 76 years, and women constituted 41.7% of the cohort. Less than 20% of the patients were in the highest income quartile, and Medicare was the primary insurer for most patients (89%). Congestive heart failure was the most common comorbidity, and median CCI score was 1 [1-3]. The vast majority of patients (62.5%) underwent Watchman device implantation at a high-volume hospital. A MAE occurred in 4.6% of the study cohort with bleeding/transfusion (2.9%) and vascular complication (2.5%) being the most common events. In-hospital mortality was 0.1% (Table 1, Figure 1). The rates of MAEs were lower in HVH compared to LVH (4.3 vs. 5.1%, p = 0.016).Table 1. Baseline characteristicsVariableCountSummary statisticAge (y, mean ± SD)-76.02 ± 7.97Female (%)12,58541.7White (%)25,37584.1Charlson comorbidity index (median, IQR)-1 [1-3]Comorbidities (%) Congestive heart failure11,59538.4 Coronary artery disease375512.4 Peripheral vascular disease493016.3 Cerebrovascular disease22757.5 Chronic obstructive pulmonary disease660521.9 Chronic kidney disease722023.9 Moderate-severe liver disease1550.5 Diabetes10,45534.6Income quartile 76th-100th758519.8 51st-75th839025.8 26th-50th778027.8 1st-25th598025.1Payer status Medicare26,85089.0 Medicaid3401.1 Private23707.9 Other5451.8Hospital region New England8202.7 Middle Atlantic372012.3 East North Central425514.1 West North Central24758.2 South Atlantic634521 East South Central17255.7 West South Central366012.1 Mountain302510 Pacific415013.8Hospital volume Low volume (1-15 procedures/year)336011.1 Medium volume (16-35 procedures/year)795526.4 High volume (>35 procedures/year)18,86062.5Major adverse event (%)13854.6In-hospital death400.1Acute MI200.1Pericardial effusion/tamponade requiring pericardiocentesis or surgery2850.9Bleeding or transfusion8852.9Stroke (ischemic/hemorrhagic) orTIA1750.6Systemic embolization300.1Vascular complication7552.5Median length of stay (d)1Median cost (interdecile range)13,900-37,000)Abbreviations: IQR, interquartile range; MI, myocardial infarction; TIA, transient ischemic attack.Figure 1. Distribution of in-hospital major adverse events related to Watchman device implantation.Abbreviations: MI, myocardial infarction; TIA, transient ischemic attack
On a national level, the median unadjusted patient-level hospitalization cost for Watchman device implantation was 13,900-37,000). The median hospitalization costs decreased slightly over the study period from 18,900-30,900] in 2016 to 18,600-29,800] in 2018 (p < 0.001). As expected, patient-level costs were significantly (p < 0.001) greater for patients experiencing a MAE: 21,700-37,100) compared to those who did not experience a MAE: 18,600-30,100). Median hospitalization costs were significantly lower in HVH: 18,700-29,200), compared to LVH: 20,100-33,400) in our study sample (p < 0.001). Additionally, there was significant variation (p < 0.001) in median hospitalization costs based on primary payer: Medicare: 19,000-30,400), Medicaid: 19,800-30,900), private pay: 18,000-30,400), and other pay: 8800-27,900).
Analysis of random intercept from the mixed model revealed 13.3% (95% CI: 12.1%-14.7%) of total cost variation for Watchman device implantation was due to the center-level differences. Among patients who experienced a MAE, 11.5% (95% CI: 9.6%-13.8%) of interhospital variation in total costs was attributable to center level differences, compared to 13.6% (95% CI: 12.3%-15%) in those who did not experience a MAE. On examining the relationship between annual hospital volume for Watchman device implantation and cost variation, we observed a decline in the proportion of cost variation attributable to the center with 14.7% in LVH (95% CI: 12.6%-17.2%), 14% (95% CI: 11.9%-16.3%) in MVH, compared to 11.4% (95% CI: 9.7%-13.5%) in HVH. For patients primarily insured by Medicare, 13% (95% CI: 11.8%-14.3%) of interhospital variation of total cost was attributable to center-level differences, while this variation was 22.4% (95% CI: 19.6%-26.5%) among non-Medicare (Medicaid, private pay, other) patients (Figure 2, Table 2). Notably, White race (coef: −0.034, SE: 0.008; p < 0.001) and lower CCI score: 3-4 (coef: - 0.038, standard error: 0.015; p = 0.014) were statistically associated with lower costs.Figure 2. Degree of interhospital variation in cost following Watchman implantation. Panel (a) shows the degree of variation among patients with and without major adverse events. Panel (b) shows the degree of variation based on hospital Watchman implantation volume. Panel (c) shows the degree of variation in Medicare and non-Medicare beneficiaries.Abbreviations: HVH, high volume hospital; LVH, low volume hospital; MAE, major adverse event; MVH, medium volume hospital.Table 2. Factors associated with total hospital costs in generalized mixed effects modelVariableCoefficient estimateStandard errorP valueAge−0.0010.00.109Female9.670.035<0.001White−0.0340.008<0.001Income quartile 0-25th−0.0070.0080.342 26-50th0.0220.0070.002 51-75th0.0170.0070.011 76-100thReference--Payer status Medicare0.3390.018<0.001 Medicaid0.3170.029<0.001 Private0.2250.02<0.001 OtherReference--Hospital volume Low volume center0.0420.020.04 Medium volume center0.0830.017<0.001 High volume centerReference-- Major adverse event0.0960.012<0.001Comorbidities Coronary artery disease0.0170.0080.036 Congestive heart failure0.0520.006<0.001 Peripheral vascular disease0.0240.0070.001 Cerebrovascular disease−0.0030.010.78 COPD0.0080.0070.22 Diabetes0.0140.0070.038 Chronic kidney disease−0.0120.0070.092 Moderate-severe liver disease0.1090.0340.001Charlson comorbidity index score CCI ≥ 5−0.0330.0250.2 CCI = 3-4−0.0380.0150.014 CCI = 1-2−0.010.0080.22 CCI = 0Reference-- Length of Stay0.660.002<0.001Abbreviation: CCI, Charlson comorbidity index; COPD, chronic obstructive pulmonary disease.
Admissions with total unadjusted hospitalization costs >90th percentile (37,000) were categorized as high-cost hospitalizations. Compared with others, patients who experienced a high-cost hospitalization had similar distribution of age and primary payer status (Medicare) ([Table 3](#tbl3)). High-cost hospitalization patients were more commonly women, and approximately 30% belonged to the highest income quartile. The burden of congestive heart failure and MAEs were significantly greater among high-cost hospitalizations. Among patients who did not experience a high-cost hospitalization, nearly 64% of patients underwent Watchman device implantation at a HVH, and only 11% of patients were treated at a LVH. Whereas, patients who experienced a high-cost hospitalization, a greater proportion of patients were treated at a LVH (15.9%), and only 52% were treated at a HVH ([Table 4](#tbl4)).Table 3. Comparison of baseline characteristics between high-cost and nonhigh-cost hospitalizationVariableNonhigh-cost hospitalizationHigh-cost hospitalization*P* valueAge (y, mean ± SD)76.03 ± 7.9875.89 ± 7.840.34Female (%)11,265 (41.3)1320 (45.7)<0.001White (%)8484.80.2Charlson comorbidity index (median, IQR)1 [1-3]1 [1-3]0.018Comorbidities (%)Congestive heart failure12.611.20.001Coronary artery disease38.141.20.04Peripheral vascular disease16.514.50.006Cerebrovascular disease7.67.30.56Chronic obstructive pulmonary disease21.921.60.72Chronic kidney disease24.220.9<0.001Moderate-severe liver disease0.50.70.16Diabetes34.832.90.035Income quartile (%) 76th-100th24.629.80.001 51st-75th28260.024 26th-50th25.924.40.087 1st-25th20.018.20.023Payer status (%) Medicare88.990.10.083 Medicaid1.20.70.019 Private7.98.00.857 Other1.91.20.011Hospital region<0.001 New England2.54.5 Middle Atlantic12.213.7 East North Central14.69.3 West North Central8.55 South Atlantic21.219.4 East South Central5.57.6 West South Central1213 Mountain109.9 Pacific13.317.6Hospital volume<0.001 Low volume (1-15 procedures/year)10.615.9 Medium volume (16-35 procedures/y)25.732.5 High volume (>35 procedures/y)63.751.6Major adverse event (%)1060 (3.9)325 (11.2)<0.001In-hospital death15 (0.1)25 (0.9)<0.001Acute MI20 (0.1)-Pericardial effusion/tamponade requiring pericardiocentesis or surgery150 (0.5)130 (4.7)<0.001Bleeding or transfusion655 (2.4)230 (8.0)<0.001Stroke (ischemic/hemorrhagic) or TIA170 (0.6)<10 (0.2)0.002Systemic embolization25 (0.1)<10 (0.2)0.182Vascular complication565 (2.1)190 (6.6)<0.001Median length of stay (IQR)1 (1)1 (1-2)<0.001Median cost (IQR)23,600 (43,500 ($39,500-51,300)<0.001Abbreviations: IQR, interquartile range; MI, myocardial infarction; TIA, transient ischemic attack.Table 4. Comparison of procedural volume between high-cost and nonhigh-cost hospitalizationVariableNonhigh-cost hospitalizationHigh-cost hospitalizationP valueHospital volume<0.001 Low volume (1-15 procedures/y)10.615.9 Medium volume (16-35 procedures/y)25.732.5 High volume (>35 procedures/y)63.751.6Hospital region<0.001 New England2.54.5 Middle Atlantic12.213.7 East North Central14.69.3 West North Central8.55 South Atlantic21.219.4 East South Central5.57.6 West South Central1213 Mountain109.9 Pacific13.317.6
On multivariate analysis, lower procedural volume center (adjusted odds ratio [aOR]: 2.11, 95% CI: 1.875-2.376; p = 0.001), occurrence of MAE (aOR: 1.281, 95% CI: 1.073-1.53; p = 0.006), congestive heart failure (aOR: 1.25, 95% CI: 1.072-1.459; p = 0.004), high comorbidity burden (CCI = 6) (aOR: 2.504, 95% CI: 1.122-5.59; p = 0.025), and length of stay (aOR: 1.412, 95% CI: 1.369-1.458; p = 0.001) were independent predictors of a high-cost hospitalization (Table 5).Table 5. Multivariate regression model to predict factors associated with high cost hospitalizationVariableaOR95% CIP valueAge0.990.985-0.9960.001Female1.050.966-1.1420.25White0.9210.815-1.040.182Income quartile 0-25th0.7930.7-0.8990.001 26-50th0.830.742-0.930.001 51-75th0.7210.646-0.8050.001 76-100thRefPayer status Medicare1.3090.922-1.8580.133 Medicaid0.3730.195-0.7150.003 Private1.1190.767-1.6330.559 OtherRefHospital region New England0.6120.491-0.7630.001 Middle Atlantic0.3360.266-0.4260.001 East North Central0.3740.288-0.4870.001 West North Central0.5060.407-0.6290.001 South Atlantic0.90.702-1.1550.408 East South Central0.6260.498-0.7860.001 West South Central0.5780.455-0.7330.001 Mountain0.8110.653-1.0070.058 PacificRefHospital volume Low volume center2.111.875-2.3760.001 Medium volume center1.6941.544-1.8580.001 High volume centerRef Major adverse event1.2811.073-1.530.006Comorbidities Coronary artery disease0.9580.8-1.1470.639 Congestive heart failure1.251.072-1.4590.004 Peripheral vascular disease0.90.761-1.0640.218 Cerebrovascular disease0.8280.675-1.0160.071 COPD0.920.784-1.0790.305 Diabetes0.9320.797-1.0910.384 Chronic kidney disease0.7920.67-0.9360.006 Moderate-severe liver disease0.9880.55-1.7740.966CCI score CCI score = 10.9310.79 -1.0980.396 CCI score = 20.8650.659-1.1350.295 CCI score = 30.8520.578-1.2560.418 CCI score = 40.7140.43-1.1880.195 CCI score = 50.5710.287-1.1380.111 CCI score = 62.5041.122-5.590.025 Length of stay1.4121.369-1.4580.001Abbreviation: aOR, adjusted odds ratio; CCI, Charlson comorbidity index; COPD, chronic obstructive pulmonary disease.
Discussion
In this large nationwide study of patients undergoing LAAO with the Watchman device, we found significant variation in total hospitalization costs. Nearly 13% of the variability in patient-level costs was related to the center performing the procedure. These differences persisted even after adjustment for patient characteristics (demographics, comorbidities, insurance), procedural complications, hospital location, hospital volume, and length of stay. Similarly, among patients experiencing a major adverse event, substantial variation in costs attributable to the center was observed. Interestingly in our study cohort, less than 1% of the variation in complications was attributable to interhospital differences. Taken together, our findings suggest that differences in hospital care pathways and resource utilization, rather than the incidence of procedure-related complications, were major drivers for the observed center-level variation in costs for Watchman device implantation. For instance, a center (or operator) may prefer implanting the Watchman device under general anesthesia, tracheal intubation, and a dedicated intraprocedural echocardiographer for transesophageal echocardiographic guidance, followed by routine overnight inpatient observation, whereas another center (or operator) may perform this procedure with conscious sedation, intracardiac echocardiography, and same-day discharge if deemed appropriate. Therefore, minimalistic, effective, and safe strategies employed by centers for elective Watchman implantation could result in reduced patient costs.
These interhospital differences in total patient costs were also more prominent for patients undergoing Watchman device implantation at low-volume centers compared to high-volume centers. This could possibly be due to greater operator experience, lower rates of complications, greater availability of services, and utilization of standardized protocols of care at high-volume centers.7^,^8
Despite the proliferation of value-based health care in the United States, variation in costs across different hospitals among Medicare beneficiaries has been previously reported.9^,^10 We observed similar center-level variation in total costs in Medicare beneficiaries receiving a Watchman device. This finding further strengthens our observation that disparities in patient-level costs are, at least in part, due to differences in practice patterns and service use related to individual centers. Among non-Medicare patients, such variation was even more pronounced, probably due to the superimposed influence of variation in specific insurer-hospital contracts.11^,^12
We found care at hospitals with low procedural volumes and procedure-related complications independently predictive of high hospital costs. Although our study did not analyze the association between hospital procedural volume and adverse events, an inverse volume-outcome relationship for LAAO procedure has been previously described.6 This could be due to variation in operator skills and technical proficiency and management of potential complications at low-volume centers, which may lead to increased resource utilization and thus increased costs. Establishing minimum operator and institutional volume standards for LAAO procedures may potentially result in improved outcomes, thereby reducing unwarranted expenditures.8^,^13 Additionally, longer hospital stays were associated with high hospital costs. In contemporary practice, patients are hospitalized overnight after LAAO and typically discharged the following day. Same-day discharges have begun to occur but are not widespread. With increasing experience and improving outcomes, same-day discharge in selected patients could be feasible, in doing so reducing length of stay and overall costs.14
As the commercial use of percutaneous LAAO with the Watchman device increases in the United States, the wide variability of Watchman-related costs underscores the importance of standardizing periprocedural and hospital practices to achieve high-quality value-based care. Previous cost-effectiveness analyses of the Watchman device have suggested it to be an economically viable stroke risk reduction strategy.4^,^5 However, such analyses are highly dependent on input variables. The median hospitalization cost in our study was substantially higher than the cost inputs used in prior analyses (16,800), suggesting Watchman implantation could be less cost-effective than previously thought. Therefore, addressing unwarranted cost variation could improve the cost-effectiveness of the Watchman device, further expanding the economic appropriateness of this procedure to a wider population.
Limitations
To our knowledge, this is the first study to explore center-level differences in cost for LAAO with the Watchman device. In this analysis, we used a large administrative database to evaluate costs. A strength of the present analysis was the use of cost data rather than charges to better reflect the cost of the services being provided. These data are an underestimate of true total costs as they do not account for physician professional fees, line item costs, costs relevant to the family and society, such as transportation to the hospital, and loss of income and productivity if it is necessary to take time off from the workplace. The NIS Database does not track hospitals across years, thereby preventing examination of changes in cost variation at individual hospitals over the study period. Although administrative data sources contain valuable resource utilization information, they lack data on procedural details, medication regimens, costs associated with specific phases of care (Watchman device price, operating room time, anesthesia, intensive care unit stay, etc.). It is possible that certain unmeasured confounders may be present, such as utilization of preprocedural computed tomography; however, we were able to adjust for important factors demonstrated to affect resource utilization. It is possible that coding errors may exist in administrative data sources. The current analysis utilized data from 2016 to 2018, during which Watchman 2.5 device was utilized for LAAO. The Watchman 2.5 device is associated with higher rates of complications compared to the Watchman FLX device approved in 2020.15 As shown in our study, periprocedural complications contributed independently to increased costs, and therefore contemporary utilization of the Watchman FLX device may mitigate certain costs related to device associated complications like pericardial effusion requiring intervention and associated prolonged hospitalization. Nevertheless, our findings demonstrate considerable variability in patient costs for elective LAAO attributable to the hospital and emphasize the need for further studies analyzing cost variation related to implantation of more contemporary LAAO devices to develop targeted cost containment strategies. Furthermore, given the retrospective nature of the study and the limitations of the database, we are unable to ascertain the association between cost and complications.
Conclusions
In this national-level analysis of hospital costs in patients undergoing LAAO with the Watchman device, we found significant variation from center to center even after accounting for important patient factors, hospital volume and location, and length of stay. As the burden of AF increases and a greater number of institutions utilize this therapy, examination of factors associated with hospital-based variation is warranted to develop value-based health care systems.
Ethics Statement
This study and the research reported adheres to the relevant ethical guidelines.
Funding
The authors have no funding to report.
Disclosure Statement
The authors report no conflict of interest.
The reference list from the paper itself. Each links out to its DOI / PubMed record.
- 1Sussman M.Menzin J.Lin I.Impact of atrial fibrillation on stroke-related healthcare costs J Am Heart Assoc 22013 e 00047910.1161/JAHA.113.000479 PMC 388676324275631 · doi ↗ · pubmed ↗
- 2January C.T.Wann L.S.Calkins H.2019 AHA/ACC/HRS focused update of the 2014 AHA/ACC/HRS guideline for the management of patients with atrial fibrillation: a report of the American College of Cardiology/American Heart Association task force on clinical practice guidelines and the Heart Rhythm Society in collaboration with the Society of Thoracic Surgeons Circulation 1402019 e 125e 1513068604110.1161/CIR.0000000000000665 · doi ↗ · pubmed ↗
- 3Freeman J.V.Varosy P.Price M.J.The NCDR left atrial appendage occlusion registry J Am Coll Cardiol 752020150315183223831610.1016/j.jacc.2019.12.040PMC 7205034 · doi ↗ · pubmed ↗
- 4Reddy V.Y.Akehurst R.L.Armstrong S.O.Amorosi S.L.Beard S.M.Holmes D.R.Time to cost-effectiveness following stroke reduction strategies in AF: warfarin versus NOA Cs versus LAA closure J Am Coll Cardiol 662015272827392661603110.1016/j.jacc.2015.09.084 · doi ↗ · pubmed ↗
- 5Reddy V.Y.Akehurst R.L.Amorosi S.L.Gavaghan M.B.Hertz D.S.Holmes D.R.Jr.Cost-effectiveness of left atrial appendage closure with the WATCHMAN device compared with warfarin or non–vitamin K antagonist oral anticoagulants for secondary prevention in nonvalvular atrial fibrillation Stroke 492018146414702973991510.1161/STROKEAHA.117.018825 PMC 5976225 · doi ↗ · pubmed ↗
- 6Warner J.J.Benjamin I.J.Churchwell K.Advancing healthcare reform: the American Heart Association’s 2020 statement of principles for adequate, accessible, and affordable health care: a presidential advisory from the American Heart Association Circulation 1412020 e 601e 6143200836910.1161/CIR.0000000000000759 · doi ↗ · pubmed ↗
- 7Nazir S.Ahuja K.R.Kolte D.Association of hospital procedural volume with outcomes of percutaneous left atrial appendage occlusion Cardiovasc Interv 14202155456110.1016/j.jcin.2020.11.02933663783 · doi ↗ · pubmed ↗
- 8Badheka A.O.Chothani A.Mehta K.Utilization and adverse outcomes of percutaneous left atrial appendage closure for stroke prevention in atrial fibrillation in the United States: influence of hospital volume Circ Arrhythm Electrophysiol 8201542482548054310.1161/CIRCEP.114.001413 · doi ↗ · pubmed ↗