Diagnostic In Vivo Sensing of COVID-19 Antibody Detection Using DNA-Linking Graphene Oxide Synthetic Mimic Skin Tattoo Probes
Kyung Lee, Dong Ho Kim, Sihyun Jun, Yeseul Oh, Ye Jun Oh, Seo Jun Lee, Keumsook Kim, Suw Young Ly

TL;DR
A wearable skin tattoo sensor can rapidly detect antibodies for influenza and COVID-19 in seconds.
Contribution
A new wearable graphene-based tattoo sensor enables rapid, individual diagnostic detection of antibodies.
Findings
The sensor achieved instant detection with a 30-second detection time.
Anodic and cathodic currents increased linearly in phosphate-buffered saline using redox potential.
The tattoo probe allows individual and wearable diagnostics for virus detection.
Abstract
COVID-19 antibody detection is dependent on highly specialized, time-consuming techniques, such as PCR separation, DNA amplification, and other methods such as spectrophotometric absorption. For these reasons, specialized technical training is necessary because individual diagnostic treatment is difficult. We have attempted to perform rapid sensing with a detection time of only 30 s. Additionally, we used a wearable multi-layer graphene oxide nanocolloid synthetic skin tattoo probe assay for influenza and COVID-19 virus detection with an electrochemical antigen–antibody redox ionic titration circuit. Cyclic voltametric−2 V~2.0 V potential windows were used. The diagnostic detection limit was determined using stripping anodic and cathodic amplifiers, and the working probe was fabricated with a graphene molecule structure with a virus antigen-immobilized amplifier. With redox potential…
Genes, proteins, chemicals, diseases, species, mutations and cell lines named across the full text — each resolved to its canonical identifier and authoritative record.
Click any figure to enlarge with its caption.
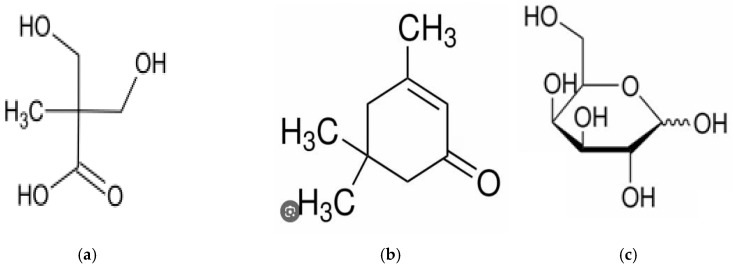 Figure 1
 Figure 2
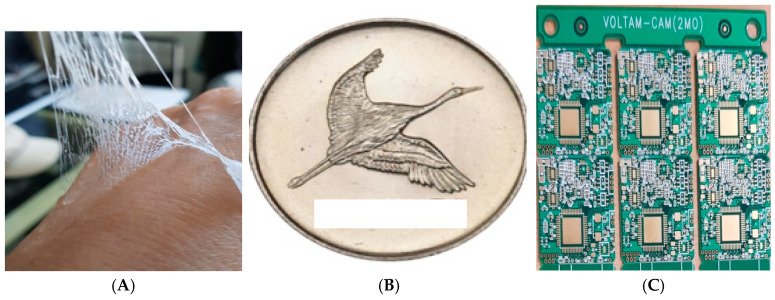 Figure 3
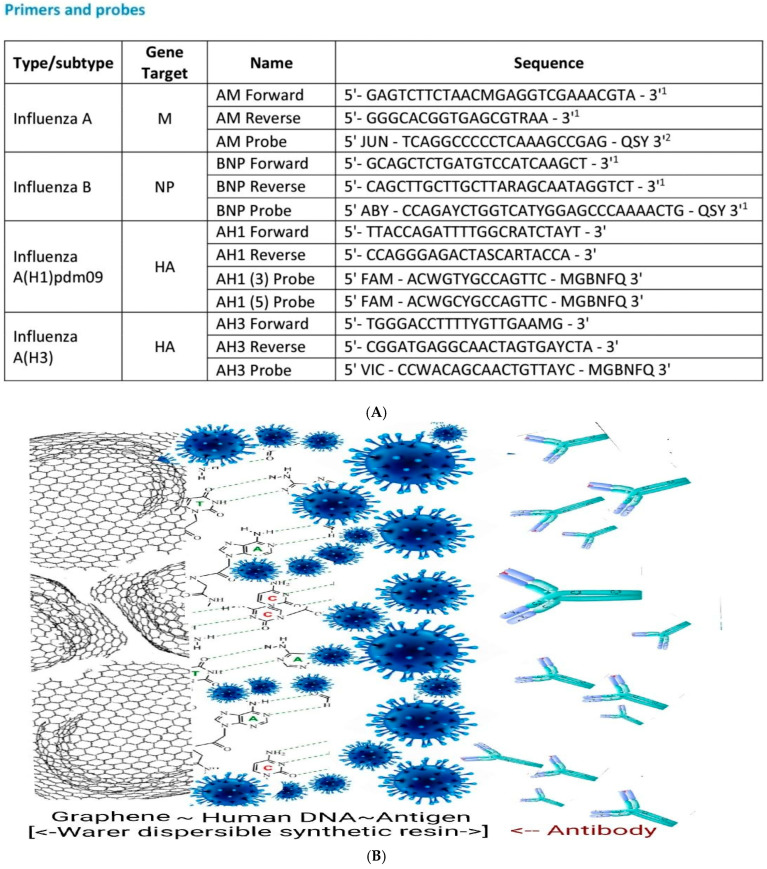 Figure 4
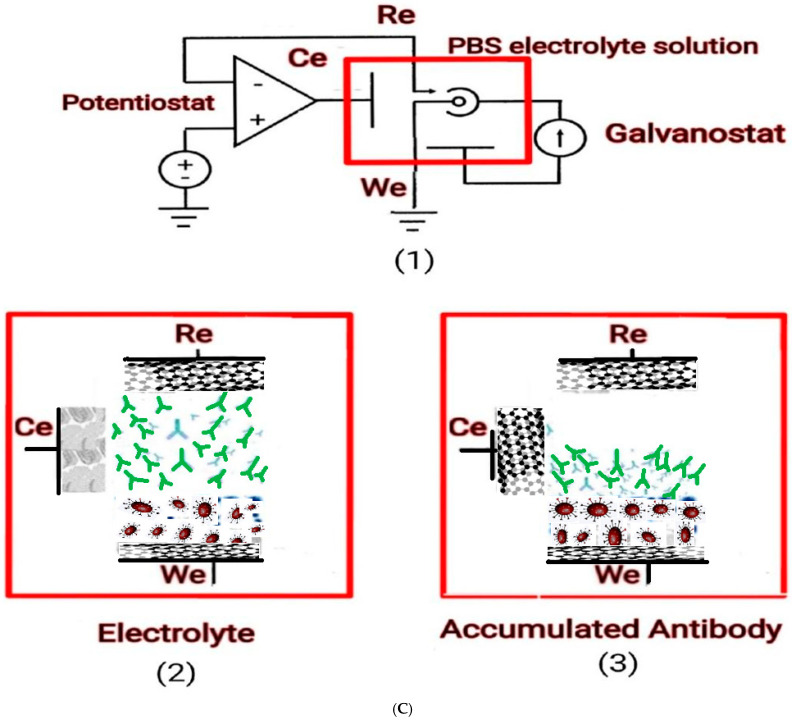 Figure 5
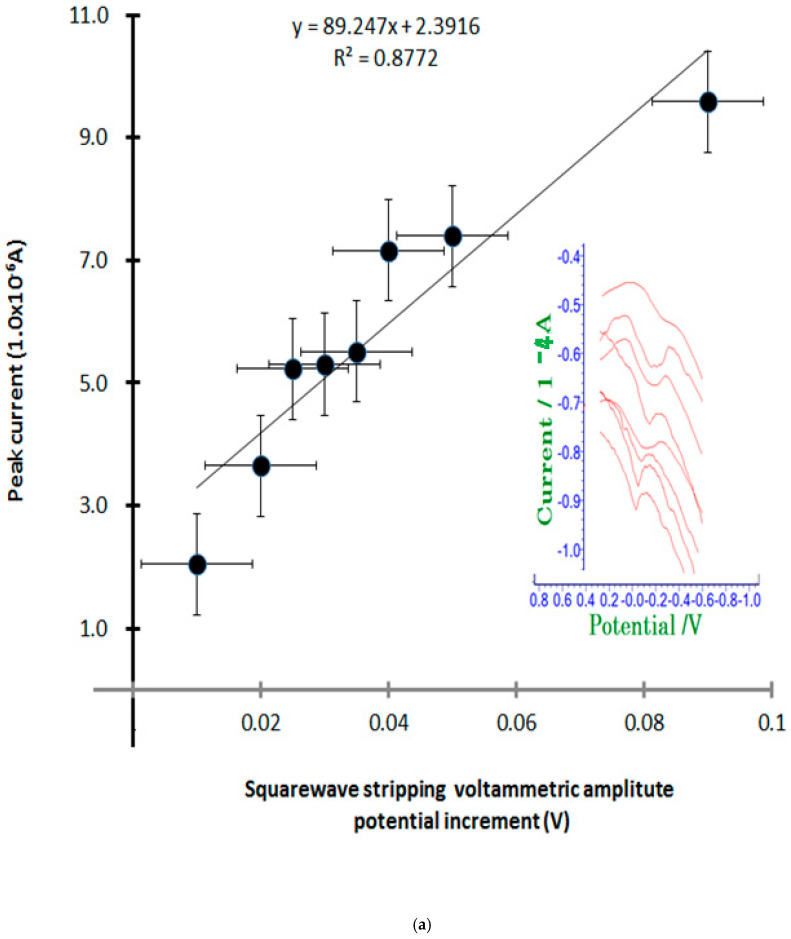 Figure 6
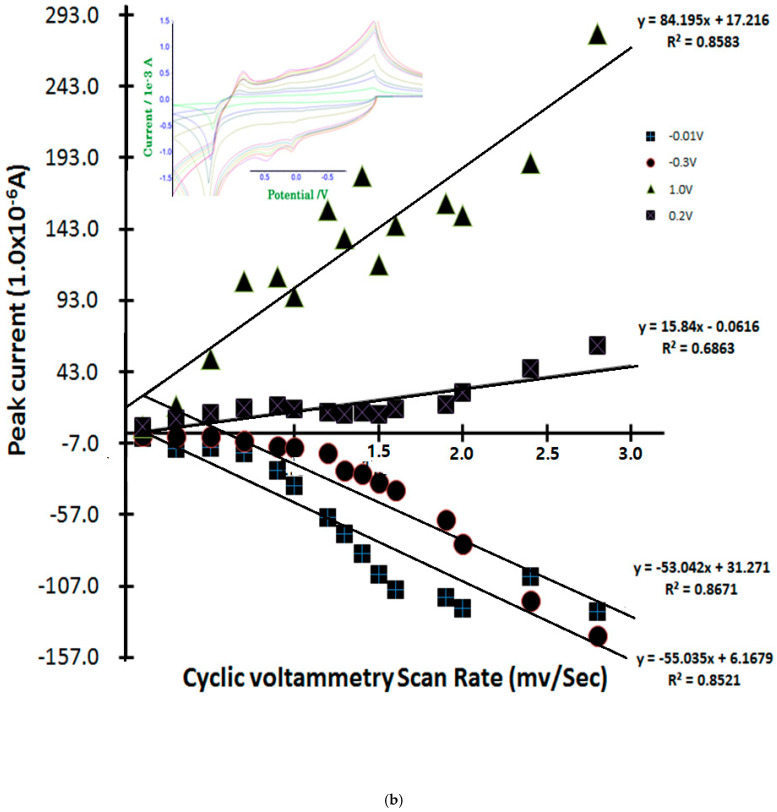 Figure 7
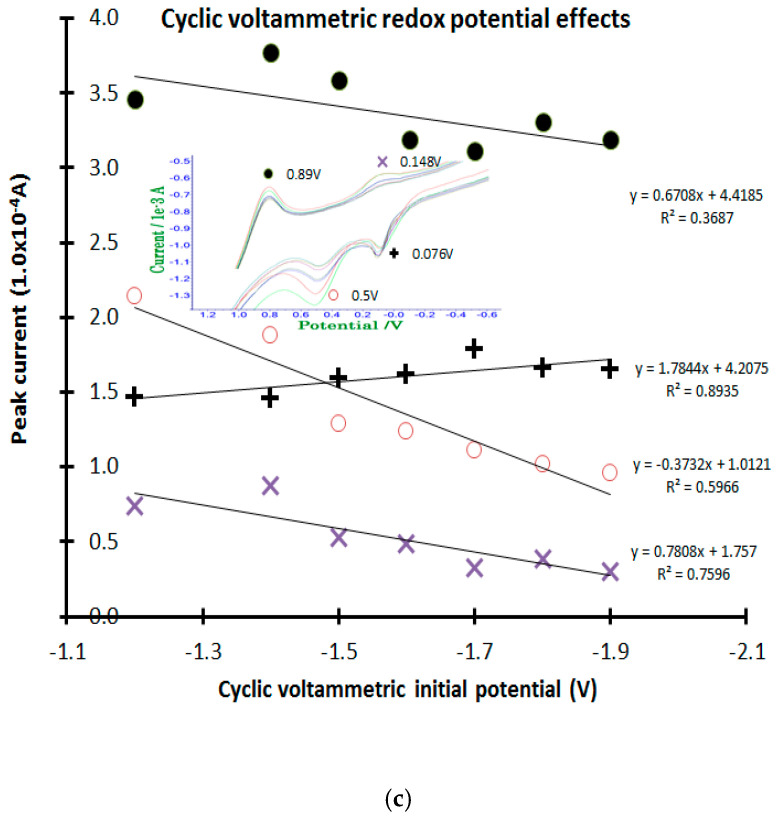 Figure 8
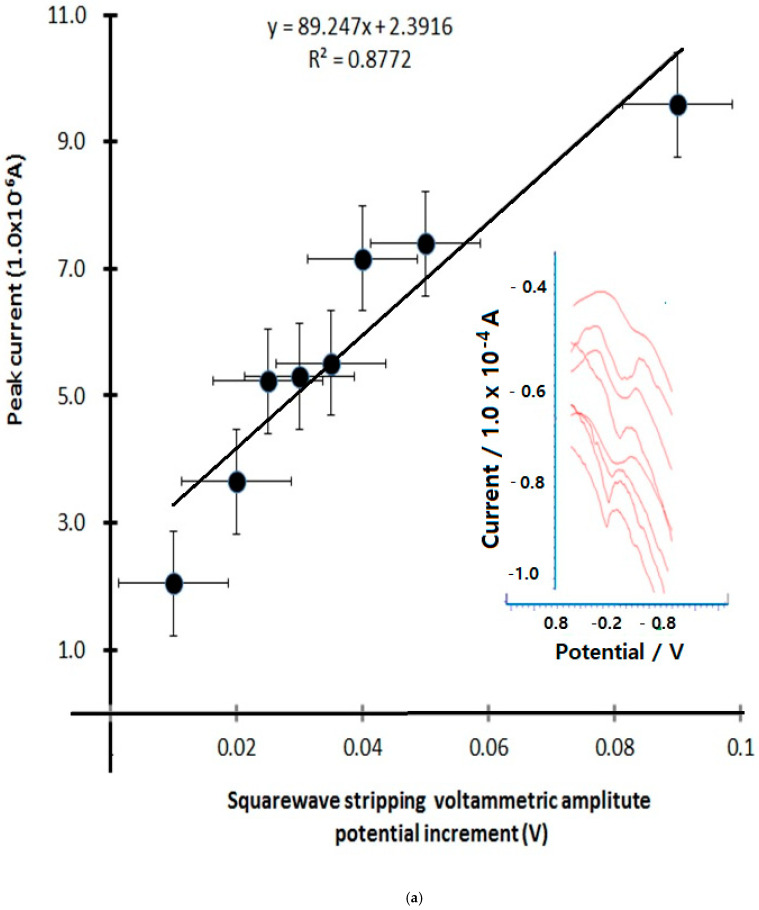 Figure 9
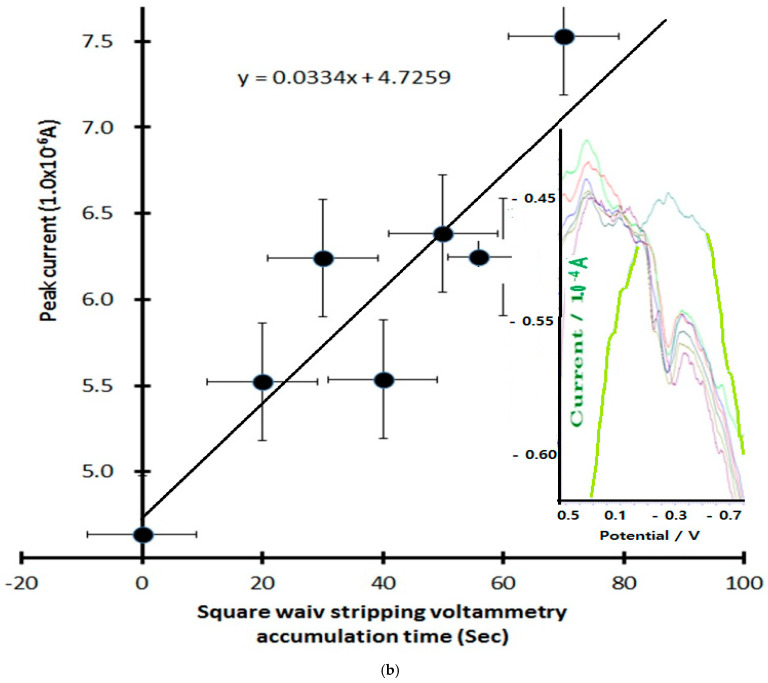 Figure 10
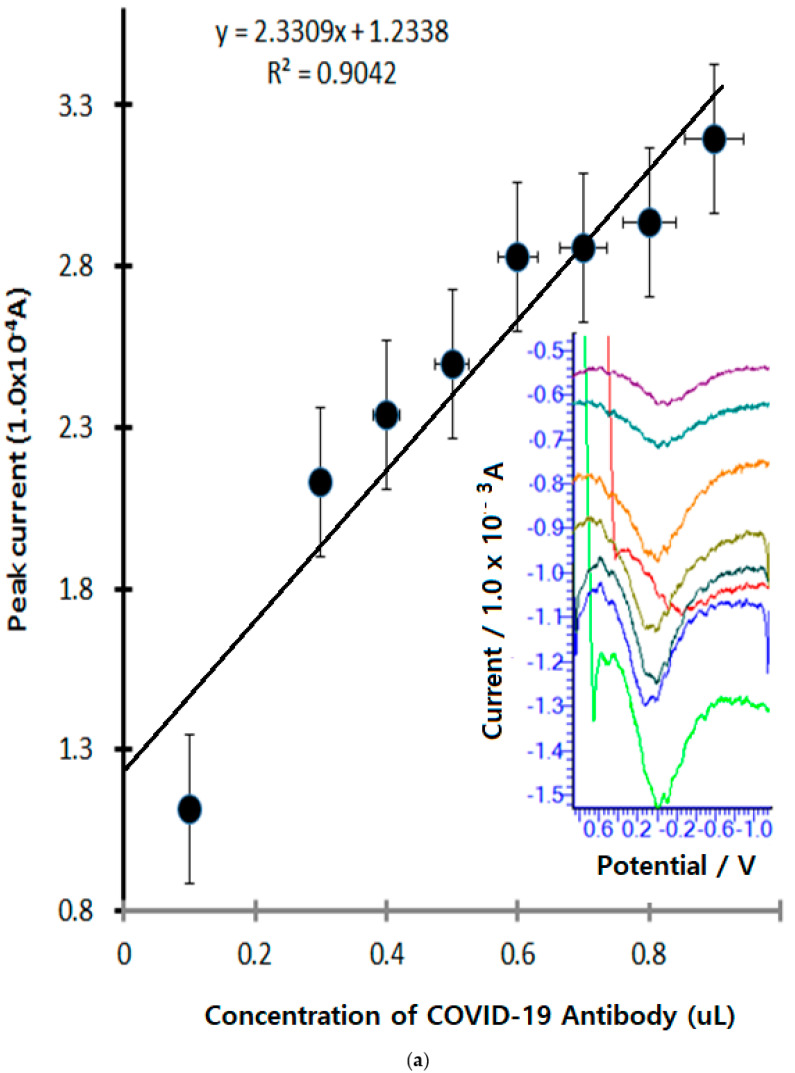 Figure 11
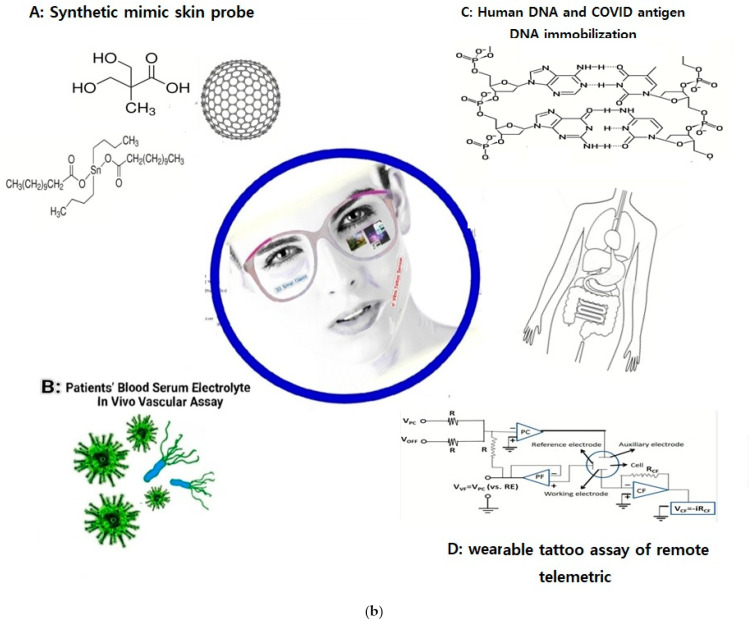 Figure 12
Peer Reviews
No public reviews on file for this paper yet. If you reviewed it on a platform where reviews are public (OpenReview, ICLR, NeurIPS, ICML), you can paste yours below so the community can read it here.
Videos
No videos yet. Explain this paper in a talk, walkthrough, or lecture? Add one.
Taxonomy
TopicsSARS-CoV-2 detection and testing · Biosensors and Analytical Detection · Long-Term Effects of COVID-19
1. Introduction
The COVID-19 pandemic was first identified in December 2019 [1]. After the death toll exploded [2], the WHO declared an international public health emergency in January 2020. After more deaths occurred [3], the status was upgraded to a pandemic in March 2020. The number of confirmed cases exceeded 1.884 billion, and the death toll exceeded 4.06 million.
Symptoms of COVID-19 vary and may include the following: fever, cough, sore throat, nasal congestion or runny nose, shortness of breath or difficulty breathing, chills or recurrent shaking with chills, new loss of smell or taste, fatigue, muscle pain, headache, nausea or vomiting, and diarrhea. If symptoms do appear, they usually appear about 2 to 10 days (incubation period) after infection. In the case of omicron mutations, symptoms usually appear within 2 to 4 days. Many infected people have no symptoms or only mild illness. People with COVID-19 are at increased risk of severe illness and death. For most people, symptoms resolve within about a week. However, in some people, symptoms last longer, sometimes accompanied by shortness of breath, coughing, and extreme fatigue, and remain active for several weeks. Long-lasting illness is more common in people who originally had a severe illness, although even people with mild illness can experience persistent symptoms. For 25–50% of people infected with COVID-19, symptoms persist for several months. This phenomenon has been referred to by various names, including long-term acute COVID-19 post-infection syndrome or condition. Sometimes, the elderly and others with this disease even die. The existing diagnostic technologies are time-consuming to implement.
In addition to respiratory disease, which can be severe and cause death, other serious complications include the following:
- Heart disease, including arrhythmia, myocardial disease, and acute heart injury.
- Coagulation disorders, including blood clots and bleeding in the small and large blood vessels.
- Guillain–Barré syndrome (rare).
A rare complication called multisystem inflammatory syndrome in children (MIS-C), which may be related to COVID-19, has been reported. Symptoms of this syndrome are similar to the rare disease Kawasaki disease and may include fever, abdominal pain, and rash. Vaccination can prevent the development of MIS-C. Similar complications (multisystem inflammatory syndrome in adults, MIS-A) have been reported in young and middle-aged adults. Here, COVID-19 virus detection techniques are related to PCR molecule amplification techniques, such as neutralizing antibody titers [4], a Photon Excitation Assay [5], and the polymerase chain reaction method [6]. All diagnostic methods are time-consuming, and some individual cases cannot be detected. For this reason, we have developed a technology that can be easily analyzed by anyone, anytime, using rapid and simple analytical sensing methods. Other examples of similar sensing methods include the picomolar assay [7] of in vivo gastric cancer cells [8], trace-metal detection in distilled alcoholic drinks or food [9], and the detection of trace cobalt ions in in vivo plant cells [10]. Such methods require skills involving simple working electrode modifications for the implanted neurotransmitter stimulation assay [11] and diagnostics of patient fluid sensing [12], which can be assayed using ex vivo fluid [13]. Furthermore, voltammetric ionic detections are usable for human hepatitis B virus detection in non-treated blood [14] by using DNA-linked carbon nanotube biosensing of helicobacter pylori bacterial infections [15]. Using the more sophisticated circuit of spectrometric [16] infrared photodiode [17] tattoo human skin [18] sensing is possible for the real-time analysis of neurotransmitters in the brain [19] and neurovascular implementation of the signaling pathways of a biocircuit [20]. These previously developed rapid modifications can be applied to COVID-19 antibody detection using self-diagnostic technology.
2. Materials and Methods
In this section, we will describe the diagnostic assays of the WHO standard protocols.
The conventional WHO protocols of PCR DNA detection, agarose gel electrophoresis separation, and spectrometric absorption methods are time-consuming and require sophisticated skills. So, highly trained master’s and doctoral technicians are needed for these methods. The necessary equipment, sequence, and reagents indicated are here.
Protocol 1
Conventional RT-PCR analyses for the matrix gene of influenza type A viruses.
Agarose gel electrophoresis of RT-PCR products. Prepare agarose gel, load PCR products and molecular weight markers, and run according to standard protocols. Visualize the presence of markers under UV light. An example of the material required and the procedure is given below.
Materials required:
- Agarose gel casting tray and electrophoresis chamber;
- Power supply and electrode leads;
- UV light box (λ = 302 nm);
- Camera and Polaroid^®^ film or any digital gel documentation system;
- Adjustable pipettes;
- 2% agarose gel in 1× TAE buffer;
- 1× TAE buffer
- Ethidium bromide (10 mg/mL);
- 6× Gel loading buffer (GLB);
- Molecular weight marker.
Also, the next steps are expensive and required skilled personnel.
Procedure A
Casting the agarose gel
Place a gel casting tray onto a gel casting base. Insert a comb and level the base.Prepare 2% agarose by weighing out 4 g of agarose powder and dissolving it in 200 mL 1× TAE buffer.Dissolve the agar by heating it in a microwave oven.Cool the melted agarose to about 60 °C, then add 10 µL of ethidium bromide.Pour the melted agarose into the gel casting tray.Allow the gel to solidify at room temperature.Remove the comb from the frame.Place the tray into the electrophoresis chamber with the wells at the cathode side.Fill the buffer chamber with 1× TAE at a level that can cover the top of the gel.
Also, sample treatment is complicated and requires skilled personnel.
B. Sample loading
Add 5 µL of the gel loading buffer to each PCR tube.Load the molecular weight marker to the first well of the agarose gel.Pipette 15 µL of the PCR product in the gel loading buffer to the gel.Close the lid on the chamber and attach the electrodes. Run the gel at 100 V for 30–35 min.Visualize the presence of the marker and PCR product bands with UV light.Document the gel picture by photographing it. Interpret the results [21].
Interpretation of results
The size of the PCR products obtained should be compared with the expected product size. Tests should always be run with a positive control https://www.who.int/initiatives/global-influenza-surveillance-and-response-system (accessed on 1 January 2024).
Table 1 shows the CDC 2019 novel coronavirus (nCoV) approved rRT-PCR detection primer name of the DNA sequence. This contains the primers for the N1, N2, N3, and RP genes. A specific assay of the amplified fragments is employed using fluorescent spectro-absorption labeled probe oligonucleotides that are complementary to the target sequence numbers. The qualitative tests are described at https://www.fda.gov/medical-devices/emergency-situations-medical-devices/emergency-use-authorizations (accessed on 30 February 2023).
A sequencing protein was used to antigen immobilize the DNA working probe and to diagnose the standard fabrications. So, we have simplified the skin sensor which was prepared as follows.
3. Mimic Skin Synthesis
3.1. Molecular Structure of Standards
All of the standard reagents shown in Figure 1a–h were prepared as follows. The reagents were from Sigma Aldrich. The molecule’s structure is shown below. Also, the synthesis reaction vessel was used with 100% SiO_2_ quartz crystals in laboratory conditions to remove any possible trace interference of ionic effects. All syntheses were performed at a temperature of 25 °C. Tap water was used for purification, repeatedly distilled with 18 M OHM resistance. The metal container was blocked to prevent the elution of impurities by using 100% stainless steel.
The reagents used were of 95.0% or higher purity, supplied by Aldrich Sigma Co. (St. Louis, MO, USA). Nevertheless, if necessary, further purification was also performed to remove any interfering effects. The molecular weight of (b)~(d) ranges from 58.6 to 1513 g/mol, while the density ranges between 0.72 and 1.05 g/cm^3^ at 20 °C. Controlling both the solubility and vapor pressure was possible for water dispersion and oil dispersion. In addition, it was also possible to synthesize these at both the melting point and boiling point of the isotherm. For these reasons, no other additional devices were used [23].
3.2. Synthetic Sequence
The synthesis order is as follows, according to reference [23]. The basic oil dispersion polymer mixing ratio was investigated through trials of a variety of methods. The statistically confirmed optimum molar ratio was examined by using reference methods. The temperature also maintained in the range of 8085 °C to prevent high-temperature evaporation. The reaction time was activated within 8 h, and further optimal sequential substitutions were performed by using reference standard methods; the synthetic molar ratio, the optimal temperature, and other conditions were determined with reference to published research. However, the results optimized for physical functionality were increased via the addition of DMPA, which was then added at 8085 °C for 6 h to allow for sufficient synthesis time. In addition, TRA and water were added to allow for stabilization at 40 °C in the same manner. TEA, EDA, and defamer were sequentially converted in order to enhance ductility, abrasion, resistance, and physicochemical bonding strength. The changed molar ratios were recorded, and the results of the bio physical and chemical properties of impact strength were subsequently combined.
3.3. Electrochemical Voltametric Analyzer
Figure 2A shows a synthetic mimic skin tattoo film prototype coated on a back-hand sensing probe, which was 0.3 mm thick with working conductivity, and a counter and reference electrode, connected by a 0.3 mm copper wire within the terminal.
Figure 2A shows a real artificial skin film coated on the back of the experimenter’s hand. It is shrinkable and transparent. It is a conductive resin. It has strong ductility. Figure 2B shows a 28 mm coin sized-circuit. In this study, the voltametric diagnostic circuit was used as the bioelectrochemical analyzer-2. The workstations of our system are shown in Figure 2C and are used through WiFi. The wearable telemetric circuit, which was fabricated to a 3 cm × 28 mm coin size by telemetric control, has potential windows of 2.0 V~−2.0 V. For oxidation and reduction potential scanning, the detection current range is 1.01 × 0^−3^ A~1.01 × 0^−9^ A. Cyclic voltammetry, difference stripping voltammetry, and chronoamperometry control programs were used in 2D. The x axis is the potential windows and the y axis is the ionic strength. Furthermore, the diagnostic optimum conditions can be controlled, and the modified three-electrode system of the counter reference and antigen film electrode were used. Here, working probe fabrication was performed to achieve an antigen-immobilized DNA-linking synthetic mimic skin membrane.
3.4. COVID-19 Antigen-Immobilized Working Electrode
A diagnostic working probe was fabricated by using a mixing ratio of graphene nano powder (2.0 g) and mineral oil (0.5 g). The water-dispersible synthetic resin (0.5 g) was mixed with 0.5 g antigen COVID-19 mixed plasma DNA, as shown in Figure 3A. The multi-layer is shown in Figure 3B of the working probe and in Figure 3C, it shows the redox electrode surface expansion reaction, the stripping accumulation is amplified by an exponential incress. The paste sensing surface was coated on the graphite crystal load with 0.5 mm diameter × 30 mm length and then connected to the voltametric working electrode terminal using a 0.35 mm pure copper enamel insulation coating wire. The counter and reference electrode were made using the same method with a graphite crystal load. The circuits are usable for wearable tattoo assays such as in vivo or in vitro and feeling sensing analysis.
Figure 3A shows an antigen mimic synthetic DNA sequence, where a 4-type mixed molecule was used as the working electrode immobilization paste. Figure 3B shows the working probe. It shows the overall schematic diagram of a multi-layer schematic image. The first layer is graphene powder, then the human DNA mixed platinum and COVID-19 antigen-immobilized activation layer, and the antibody redox titration current amplifier circuit is shown in Figure 3C. Figure 2C shows the circuit of the voltametric reaction cells, where (1) is the PBS electrolyte inserting skim, with a 5 mL solution buffer and (2) is the antibody 0.2 µL blood positive serum spike. Then, the cyclic voltametric accumulation time absorption skim is shown in (3), which includes the simulated antigen antibody molecular ionic redox titration skim. Under optimum conditions, the anodic and cathodic peak current obtained range within 1.0 × 10^−5^ A1.0 × 10^−7^ A; more amplified signals can be obtained by using a stripping accumulation time with 1.0 × 10^−8^ A1.0 × 10^−9^ A. The results can be used for in vivo or vitro detection.
4. Results and Discussion
4.1. Cyclic Voltametric Ionic Titration
The cyclic voltametric antigen antibody redox titration was performed by using an antigen-immobilized working electrode in purified water with 8 MΩ mega ohm resistance and PBS, Na_2_HPO_4_, and KH_2_PO_4_ buffer, using a 9% sodium chloride electrolyte at 5 mL at room temperature with graphite crystalline and a three-electrode system.
4.2. Cyclic Voltametric Redox Titration
Figure 4a shows the analytical COVID-19 antibody cyclic accumulation time variations. Here, the results are related to the concentrated ionic activity, so a 13-step sequential peak current was examined. Then, it was combined with the inserted voltammograms, −2.0 V initial, 2.0 V feedback cyclic scanning, −0.2 V anodic, and 0.8 V cathodic peak current, obtained with 0.9 mL antibody-containing PBS electrolyte. During the 20140 s accumulation time with redox scanning, the anodic peak is −0.1989 × 10^−6^ A−16.15 × 10^−6^ A at −0.2 V potential windows, and R^2^ = 0.9005 is sensitive; also, the 0.8 V cathodic peak is 0.4848 × 10^−6^ A~−1.156 × 10^−6^ A, and a current appeared, for which the relative standard deviation R^2^ = 0.0129 is sensitive. Under these conditions, cyclic scan rate variations were examined. The results shown in Figure 4b for 0.1 mV/s2.8 mV/s, with 25 step variations show that under optimum conditions, two peaks of anodic current for −0.01 V = −3.263 × 10^−6^ A−124.7 × 10^−6^ A and −0.3 V = −1.362 × 10^−6^ A~−141.6 × 10^−6^ A appeared; here, the relative variation errors are shown to be inserted in the voltammograms. Also, cathodic peak obtained has two peaks. Figure 4c shows the cyclic scan rate variations of the initial potential within −1.2 V~−1.9 V; also, +0.076 V and +0.5 V oxidations appeared and +0.89 V + 0.148 V reduction peaks were obtained. Here, the linear equation for the +0.076 V oxidation peak is y = 0.7808X + 1.757, R^2^ = 0.7596; for the +0.5 V peak, it is y = −0.3737X + 1.01212, R^2^ = 0.5966; for the 0.89 V reduction peak, it is y = 1.7844X + 4.2075, R^2^ = 0.8935; and for 0.148 V, it is Y = 0.6708 + 4.4185, R^2^ = 0.3687. Then, stripping voltametric optimization was performed.
4.3. Stripping Voltametric Optimization
The stripping voltametric differential is dramatically increased by the sensitivity of ion titration. Therefore, only the following functions with the greatest influence were optimized, such as accumulation time change, current amplification rate, and redox titration. Figure 5a shows the results of the anodic stripping current amplitude variations with eight points, 0.01 mV, 0.02 mV, 0.025 mV, 0.03 mV, 0.035 mV, 0.04 mV, 0.05 mV, and 0.09 mV. In the real voltammograms shown in this figure, the sensitive linear current was increased from 2.024 × 10^−6^ A to 9.591 × 10^−6^ A, the linear equation is Y = 89.247X + 2.3916, and the relative standard deviations is R^2^ = 0.8772, so the optimum amplitude obtained is 0.06 mV. Under these conditions, anodic scanning time variations were examined at 0 s, 20 s, 30 s, 40 s, 50 s, 60 s, and 70 s, for which the voltammograms are shown in Figure 5b. The first peak is 4.637 × 10^−6^ A, which then linearly increases to 7.528 × 10^−6^ A; here, the working equation is dx/dy = 0.0334x, the intercept is 4.7259, and the anodic peak potential is fixed at −0.2 V. For these results, the optimum conditions obtained were at 30 s under these conditions. The final optimum conditions will affect the detection limits of the virus investigated, and thus the concentration spike was assessed according to mg~ug variation. The results show only the working curves and anodic scanning; analytical sensitivity comparisons for SARS-CoV-2 are shown in Table 2. The analytical limits of detection for seven SARS-CoV-2 assays using serial dilutions of pooled patient material quantified with droplet digital PCR are shown. Limits of detection ranged from ≤10 to 74 copies/mL for commercial high-throughput laboratory analyzers [24] and from 167 to 511 copies/mL for sample-to-answer [24] and point-of-care instruments (Abbott ID NOW). However, our developed method reached a detection limit of 10 µL, which is more sensitive than that of common methods [25].
Using the final optimized stripping parameters, Figure 6a shows the effects of antibody concentration with 9-step spiking. The anodic scan with oxidized electric titration is shown in Figure 6; the first spike was added to 0.1 µL antibody in PBS electrolyte without any ion, with an obtained current of 1.113 × 10^−4^ A with 0.0 V potential windows. In the oxidized voltammogram, a small peak appears. With continued 0.3 µL0.5 µL spiking, a 2.217 × 10^−4^ A2.494 × 10^−4^ A peak current was obtained under this conditions. Figure 6b shows the oculus glass monitoring of in vitro and in vivo linking for applications such as synthetic artificial skin application. A paper was published on the synthesis of a water-dispersed human-friendly transparent skin sensor. It was synthesized at room temperature using graphene conductive carbon crystals, propylene hydrate, ethyl alcohol solvent, a soft reaction accelerator, and a room-temperature hardener. In vitro coating was used for skin tattooing and it was used as a three-electrode system. It was used as a voltage and current measurement sensor to amplify the signal of the antigen–antibody oxidation reaction. These sensors were suitable for disease diagnosis, virus diagnosis, heavy metal diagnosis, and biological signal amplification. It was possible to diagnose in vivo blood, urine, and body fluids within the human body. The micro sensor could be inserted into muscles, blood vessels, and organs without pain. Therefore, nerve signal detection, pain diagnosis, blood sugar assay, sound wave diagnosis, and joy, anger, and sorrow diagnosis are possible. Nerve current amplification can be linked to a remote unmanned control system. It can be linked with oculus glass monitoring. Therefore, multi-tasking and multi-user operations can be controlled. Figure 6b shows antigen–antibody diagnosis in the body. Antigen electrodes, antigen sensors, and signal amplification for in vivo virus diagnosis are possible. Therefore, virus amplification diagnosis at milli, micro, nano, and pico concentrations is possible. Additionally, an injection of cell-killing water is possible without organ damage. Linkage between voltammetry diagnostic equipment and oculus monitoring is possible. Therefore, wearable self-diagnosis sensors, self-treatment, unmanned diagnosis, drug injection, remote diagnosis treatment, etc., are possible. In addition, real-time human body information can be transmitted, enabling linkage with emergency treatment, micro-nano surgery, etc. The attached circuitry is a partial drawing designed by our laboratory. It was designed with two CPUs, an amplifier, memory, and WiFi transmission circuit. It is possible to convert more than 80% of ions in the periodic table at a cyclic redox voltage in the range of −2 v to 2 v. The ion potential can be amplified from milli to pico. Calculus-enabled 2D plane control is possible. Therefore, quantitative and qualitative methods can be performed. Nanopicomolar amplification of ion analysis is possible. The overall size of the circuit board ranges from the size of a coin to the DC power source. Therefore, we were able to design diagnostic equipment and sensors suitable for a wearable tattoo system.
5. Conclusions
Human DNA and an antigen DNA immobilized synthetic mimic skin probe responded to COVID-19 antibody ionic activity. Here, the redox titration current was amplified to 1.0 × 10^−3^ A~1.0 × 10^−4^ A. The diagnostic relative standard deviation attained was R^2^ = 0.9042, and the cyclic sensing potential was obtained at −0.01 V, −0.3 V for the anodic peak potential, and 1.0 V and 0.2 V for the cathodic peak potentials, which can be titrated for COVID-19 antibody detection in patient blood serum. However, the stripping time was only 0.0 V at the anodic peak and only appeared when 0.1 µL electrolyte was added. Under optimized conditions, analytical detection currents of the micro volume ranges were sought using a handmade mimic skin tattoo synthetic probe. The detection systems used were an electrochemical compact circuit like coin size portable telemetric analyzer. The analytical working time was only 30 s under optimum stripping conditions with 5 mL of electrolyte. The in vitro tattoo skin membrane probe can be used for virus recognition. Thus, a cyber networking human computer interfaced wearable tattoo assay is usable for remote telemetric therapy [25].
The reference list from the paper itself. Each links out to its DOI / PubMed record.
- 1Zhu H. Wei L. Niu P. The novel corona virus outbreak in Wuhan, China Glob. Health Res. Polic 202056610.1186/s 41256-020-00135-632226823 PMC 7050114 · doi ↗ · pubmed ↗
- 2Robinson E. Sutin A.R. Daly M. Jones A. Asystematic review and meta-analysis of longitudinal cohort studies comparing mental health before versus during the COVID 9 pandemic in 2020 J. Affect. Disord.202229656757610.1016/j.jad.2021.09.09834600966 PMC 8578001 · doi ↗ · pubmed ↗
- 3Carter L.J. Garner L.V. Smoot J.W. Li Y. Zhou Q. Saveson C.J. Sasso J.M. Gregg A.C. Soares D.J. Beskid T.R. Assay Techniques and Test Development for COVID-19 Diagnosis ACS Cent. Sci.2020659160510.1021/acscentsci.0c 0050132382657 PMC 7197457 · doi ↗ · pubmed ↗
- 4Sicca F. Martinuzzi D. Montomoli E. Huckriede A. Comparison of influenza-specific neutralizing antibody titers determined using different assay readouts and hemagglutination inhibition titers: Good correlation but poor agreement Vaccine 2010382527254110.1016/j.vaccine.2020.01.08832044163 · doi ↗ · pubmed ↗
- 5Koskinen J.O. Vainionpaa R. Meltola N.J. Soukka J. Hanninen P.E. Soini A.E. Rapid Method for Detection of Influenza A and B Virus Antigens by Use of a Two-Photon Excitation Assay Technique and Dry-Chemistry Reagents J. Clin. Microbiol.2007453581358810.1128/JCM.00128-0717855571 PMC 2168508 · doi ↗ · pubmed ↗
- 6Smith L.E. Potts H.W.W. Amlôt R. Fear N.T. Michie S. Rubin G.J. Do members of the public think they should use lateral flow tests (LFT) or polymerase chain reaction (PCR) tests when they have COVID-19-like symptoms The COVID-19 Rapid Survey of Adherence to Interventions and Responses study Public Health 202119826026210.1016/j.puhe.2021.07.02334487869 PMC 8316130 · doi ↗ · pubmed ↗
- 7Shah N.S. Thotathil V. Zaidi S.A. Sheikh H. Mohamed M. Qureshi A. Sadasivuni K.K. Picomolar or beyond Limit of Detection Using Molecularly Imprinted Polymer-Based Electrochemical Sensors: A Review Biosensors 202212110710.3390/bios 1212110736551073 PMC 9775238 · doi ↗ · pubmed ↗
- 8Basirinia G. Ali M. Comelli A. Sperandeo A. Piana S. Alongi P. Longo C. Di Raimondo D. Tuttolomondo A. Benfante V. Theranostic Approaches for Gastric Cancer: An Overview of In Vitro and In Vivo Investigations Cancers 202416332310.3390/cancers 1619332339409942 PMC 11476023 · doi ↗ · pubmed ↗