Feasibility of using nitrogen distribution of milk to identify adulterated and reconstituted market milk
Md. Mehedi Hasan Khandakar, Md. Nasir Sarker, Md. Rezwanul Habib, Md. Sadakatul Bari, Rawnak Jahan, Md. Nurul Islam, Md. Abid Hasan Sarker, Md. Abunaser, Mohammad Ashiqul Islam

TL;DR
This study shows that analyzing nitrogen distribution in milk can help identify adulterated or reconstituted milk samples.
Contribution
The study introduces nitrogen distribution as a potential method for detecting milk adulteration.
Findings
Significant differences in nitrogen distribution were observed among various milk samples.
Reconstituted and adulterated milk samples showed lower casein and protein content.
A larger dataset is needed for field-level adoption of this method.
Abstract
This study aimed to explore the viability of nitrogen distribution in milk to detect adulteration in market milk. Raw cow milk was obtained from the dairy farm at Bangladesh Agricultural University Dairy Farm (BAUDF). Fluid market milk, nonbranded bulk powdered milk, and local brand powdered milk were bought from the Mymensingh city area. The milk samples were T1 (milk from a known source—BAUDF, control group), T2 (reconstituted nonbranded bulk powdered milk), T3 (reconstituted local brand powdered milk), T4 (fluid market milk from Goala), T5 (mixture of 75% T1 and 25% T2), and T6 (mixture of 50% T1 and 50% T2). There were four replications in each variable, and the samples were tested for their physicochemical properties (specific gravity and acidity), gross composition (total solids, ash, milk fat, lactose, and total protein), and nitrogen distribution [casein nitrogen, noncasein…
Genes, proteins, chemicals, diseases, species, mutations and cell lines named across the full text — each resolved to its canonical identifier and authoritative record.
Click any figure to enlarge with its caption.
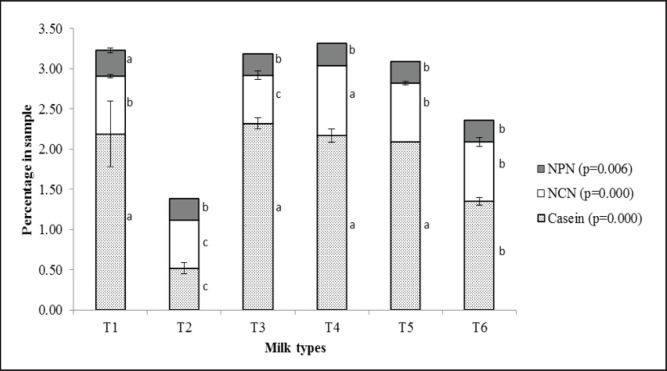 Figure 1
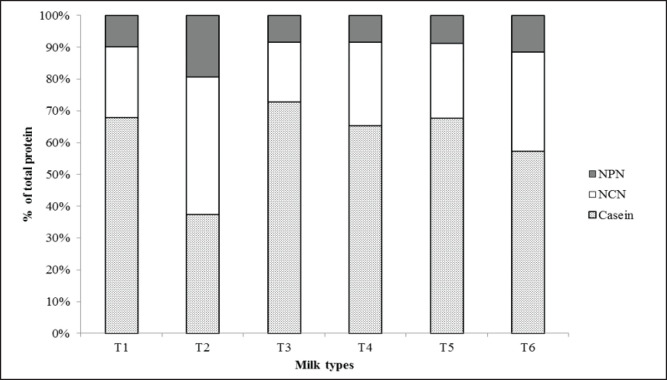 Figure 2
| Parameters | T1 | T2 | T3 | T4 | T5 | T6 | ||
|---|---|---|---|---|---|---|---|---|
| Specific gravity | 1.028b ± 0.00 | 1.031a ± 0.00 | 1.028b ± 0.00 | 1.026c ± 0.00 | 1.028b ± 0.00 | 1.031a ± 0.00 | 0.000 | |
| Acidity (%) | 0.17ab ± 0.00 | 0.06d ± 0.01 | 0.15b ± 0.01 | 0.18a ± 0.01 | 0.12c ± 0.01 | 0.10c ± 0.01 | 0.000 | |
| Total solids (%) | 12.23ab ± 0.17 | 11.63c ± 0.12 | 11.43c ± 0.06 | 12.04b ± 0.02 | 12.44a ± 0.18 | 12.16ab ± 0.15 | 0.000 | |
| Ash (%) | 0.72ab ± 0.10 | 0.79a ± 0.01 | 0.77ab ± 0.01 | 0.66b ± 0.03 | 0.68ab ± 0.02 | 0.73ab ± 0.02 | 0.021 | |
| Milk fat (%) | 3.77a ± 0.59 | 0.63c ± 0.06 | 2.03b ± 0.06 | 3.07a ± 0.12 | 3.40a ± 0.10 | 3.33a ± 0.15 | 0.000 | |
| Protein (%) | 3.24a ± 0.43 | 1.39c ± 0.08 | 3.19a ± 0.03 | 3.32a ± 0.08 | 3.10a ± 0.03 | 2.37b ± 0.03 | 0.000 | |
| Carbohydrate & Others (%) | 4.51c ± 0.85 | 9.32a ± 0.14 | 5.44bc ± 0.05 | 4.99bc ± 0.16 | 5.26bc ± 0.21 | 5.27b ± 0.19 | 0.000 | |
Peer Reviews
No public reviews on file for this paper yet. If you reviewed it on a platform where reviews are public (OpenReview, ICLR, NeurIPS, ICML), you can paste yours below so the community can read it here.
Videos
No videos yet. Explain this paper in a talk, walkthrough, or lecture? Add one.
Taxonomy
TopicsMilk Quality and Mastitis in Dairy Cows · Animal Diversity and Health Studies · Identification and Quantification in Food
Introduction
Long before recorded history, milk was regarded as an ideal meal with unique qualities for human nutrition. Because of its healthful ingredients for all animals, including humans, it is considered a complete meal [1]. Milk production in Bangladesh is rising, but the country still has limitations to cover. In Bangladesh, the annual need for milk is 15.878 MMT, while only 15.04 MMT are produced, and the per-head milk availability is 234.45 ml/day [2]. However, the practical scenario is different as opined by experts in different policy meetings. Eventually, the Bangladesh government imported dairy products, spending $421.273 million in the year 2022–23 [3]. Different types and qualities of powdered milk are available in our country, i.e., from premium quality to nutritionally inferior and, in many cases, contaminated with radioactive materials, heavy metals, and other hazardous materials [4].
Milk powder is the second most susceptible food item to adulteration among the available options. The powdered milk, even with lower grades, is reconstituted and mixed with whole milk and is sold to the market as whole milk. Not only in our country, food adulteration, including milk, is a widespread problem at the food processing and marketing level across the world. In our country, the shortage of milk inspires some unprincipled persons (especially Goalas) to make more adulteration in milk by incorporating cheap quality powdered milk, reconstituted milk, urea, rice flour, salt, starch, glucose, vegetable oil, animal fat, melamine, and whey powder to increase the thickness and viscosity of the milk as well as to maintain the composition of the milk.
It should be remembered that water itself is a good adulterant [5]. Due to the higher prevalence of adulteration, it becomes imperative to identify this questioned quality powdered milk as an adulterant in fluid milk because of their possible hazards to human health, such as cancer, blindness, and immunity problems. Various methods have been employed to detect adulterants in milk, e.g., measurement of freezing point, single-frequency conductance analysis, electrical admittance spectroscopy, ultraviolet–visible light spectroscopy, digital image chromatography, and enzyme-linked immunosorbent assay [6]; RNAase activity in milk [7]; β-casein: α-lactalbumin by capillary electrophoresis [8]; and near-infrared spectroscopy [9]. However, all these methods need sophisticated instruments that require fine skill and massive cost involvement.
Literature is also evident that protein fraction analysis could identify adulterants in milk [10] because nitrogen content from outer sources influences protein levels in milk. However, some research has already been done covering the total nitrogen (TN) estimation of milk and milk products in detecting milk adulteration. In our literature search, no research has yet been done focusing on milk’s nitrogen distribution [casein, whey protein, and nonprotein nitrogen (NPN)] to detect adulteration. Hence, the current work was designed to assess the feasibility of using the nitrogen distribution pattern of milk as a tool to identify the adulteration of market milk.
Materials and Methods
Experimental site and sample collection
The experiment was carried out at the Dairy Chemistry and Technology Laboratory, Department of Dairy Science, Bangladesh Agricultural University Dairy Farm (BAUDF). Whole milk powder (nonbranded bulk and local brand) was collected from the local market (Chhoto Bazar, Mymensingh, Bangladesh, 24°45'29.9"N 90°24'34.2" E). Raw market milk samples were collected from Goalas of different local markets (Bhabakhali Bazar, 24°39'28.8"N 90°27'20.3"E, and Dudhmahal, 24°45'25.7"N 90°24'35.9" E) of Mymensingh Municipality, Bangladesh. A known milk sample was collected from the BAUDF. A total of six groups of milk samples at different adulteration levels were used to compare the distribution of nitrogen among them. There were four replications under one group, and the total number of samples was 24. The milk samples were T1 (milk from BAUDF as a control group), T2 (reconstituted nonbranded bulk powdered milk), T3 (reconstituted local brand powdered milk), T4 (liquid market milk from Goala), T5 (mixture of 75% T1 and 25% T2), and T6 (mixture of 50% T1 and 50% T2).
Reconstituting the powdered milk
In brief, 1 l of reconstituted milk was prepared by dissolving 125 gm of purchased local brand or nonbranded bulk powdered milk with 875 ml of lukewarm water. Rapid powder dissolution was achieved by vigorously shaking the vessel for 20 seconds. After powder dissolution, different samples were prepared by mixing with whole milk with the help of a magnetic stirrer.
Proximate analysis
A phenolphthalein indicator was used to analyze the samples’ acidity by titration with 0.1-N NaOH, and the specific gravity was calculated from the corrected Quevenne Lactometer reading. Oven drying [J.P. Selecta; S.A. ctra Nil km: 585.1, Abrera (Barcelona), Spain] at 105°C for 24 h was used to obtain the total solid (TS) content of the samples. These dried samples were then initiated at 600°C for 6 h in a muffle furnace (VULCAN A-550, Ney^®^, USA) to measure the ash content. The Babcock method was employed to get the fat content of the samples. The carbohydrates (mainly lactose) and other contents (other remaining substitutes) of different samples were calculated by subtracting the sum of milk fat, total protein, and ash content from the TS content. Carbohydrate and others (%) = TS (%) – [Milk fat (%) + Total protein (%) + Ash (%)]
Analysis of nitrogen distribution in the samples
The Kjeldahl method was used to assay the TN, noncasein nitrogen (NCN), and NPN content [11]. To determine the nitrogen content of the samples, the milk was first skimmed by centrifugation at 3,500 rpm for 5 min. Each of the nitrogen content values was multiplied by 6.38 to obtain the respective protein value.
TN estimation
For this purpose, 5 ml of skimmed milk was digested in a Kjeldahl tube by using 20 ml of concentrated H_2_SO_4_, 1–2 gm of catalyst mixture (K_2_SO_4_:CuSO_4_:Se = 100:10:1) for 60 min (or until the contents get clear) at 150°C. After cooling, the content to room temperature, neutralization, and distillation was done using 80 ml of 40% NaOH and 5–7 ml of H_3_BO_3_, followed by titration with 0.1-N HCl using a mixed indicator (methylene blue: methyl red = 2:1; 2–3 drops) until the pink color appears.
NCN estimation
For NCN separation, 5 ml of milk was used. The sample was tempered to 35°C and then cooled to room temperature. Eight milliliters of acetate buffer (10% V/V acetic acid—0.53 ml + 1 N Na-acetate - 0.53 ml + distilled water—6.94 ml) was added to it, followed by centrifugation at 3,500 rpm for 25 min at room temperature. Three-milliliter supernatants containing NCN were used for the estimation of nitrogen following the method as it was in the TN estimation.
NPN estimation
The procedure for the separation of the NPN fraction was similar to NCN, except using 10% (W/V) TCA (20 ml) instead of acetate buffer, and 6 ml of supernatant was employed on the Kjeldahl procedure for the nitrogen estimation in the nonprotein fractions.
Casein nitrogen (CN) estimation
To find the CN, NCN and NPN were subtracted from the TN, and the nitrogen value was multiplied by 6.38 to obtain the casein protein value. The formulas are—CN = TN - (NCN + NPN) and Casein = CN × 6.38.
Statistical analysis
Data were recorded, analyzed, and visualized to figure out the motif of nitrogen distribution in the known whole milk, reconstituted milk, raw market milk, and whole milk adulterated with reconstituted milk (of nonbranded bulk or local brand powdered milk). To compare the mean, one-way ANOVA was done. Tukey’s HSD as a post hoc test was done for mean separation in case of significant differences among the means. Data are presented as mean ± standard deviation. Minitab version 17 was used for this purpose.
Result and Discussion
Gross nutritional quality of different samples
The gross nutritional composition of different milk samples is presented in Table 1. As we see in the table, the highest specific gravity was found in both T2 and T6 samples, which were significantly higher (p < 0.05) than the T1, T3, and T5 samples, followed by the T4 milk sample from Goala. The highest specific gravity in T2 may result in negligible fat content, and T6 might be for using a 50% T2 milk sample. Memon et al. [12] reported that the specific gravity of milk was increased when reconstituted skim milk was added to it. On the other hand, the lowest specific gravity in the T4 group may cause the consequence of the addition of water to market milk [13]. However, the normal range of specific gravity for cow milk samples is 1.027–1.035 with an average of 1.032 [14].
The acidity of the T1, T3, and T4 groups was significantly higher (p < 0.05) than other groups, where the lowest value was found in the T2 milk sample. More than half of the normal acidity of whole milk is due to the presence of casein, which may make a difference in the acidity of milk samples. Hence, the lowest acidity in the T2 milk sample might be the result of the least protein content, more specifically the nominal casein content of this group. On the other hand, the highest acidity content of the T4 group might be the result of a prolonged storage time during transportation and the development of lactic acid content due to the proliferation of lactic acid bacteria during the storage period [15].
The TS found in T1, T4, T5, and T6 milk samples was almost similar, ranging from 12.04% to 12.44%. On the other hand, T2 and T3 milk samples contained lower TS content of 11.63% and 11.43%, respectively. Likely, significant differences (p < 0.05) existed among the groups for their ash contents. The lowest ash content was measured in the T4 (0.66%), which was statistically minimal compared to the T1 and T2 samples. The highest ash content of the T2 (0.79%) is owing to reconstituted milk from low-quality powdered milk, probably due to the presence of minerals with heavy metals in that sample. Free grazing of the animals on bushes or forages cultivated on saline salts could also lead to the high ash content of milk from those animals [16]. In addition, greater consumption of green grass and lower consumption of concentrate and advanced lactation [17] are probable reasons for higher ash content in milk.
The highest milk fat content was found in the control group (T1, 3.77%), and the lowest was in reconstituted low-quality powdered milk samples (T2, 0.63%) in Table 1. The fat content of the T1, T4, T5, and T6 samples was statistically higher (p < 0.05) and ranged from 3.07% to 3.44% but was higher than the T3 group. The imported low-quality skim milk powder and whey powder are not fully safe for human consumption [18], and these poor products are sold in the market as whole milk powder and sometimes mixed with whole milk powder. These low-quality powdered kinds of milk contained the least or negligible average fat content. Closely, the reconstituted milk from the local brand powder milk (T3) did not also meet the minimum standard of milk fat content for whole milk powder. The minimum requirements of milk fat are 3.25%, 3.5%, 3.25%, 3.2%, and 3.5%, according to the Food and Drug Administration, European Union, Codex Alimentarius Commission, Food Safety and Standards Authority, and Bangladesh Standards and Testing Institution, respectively. In this study, T2, T3, and T4 could not satisfy the minimum fat percent requirement.
Table 1 again depicts that there was a significant difference (p < 0.05) among the groups for their protein contents. T1, T3, T4, and T5 groups contained significantly higher (p < 0.05) protein content ranging from 3.10% to 3.32% than T2 (1.39%) and T6 groups (2.37%). Significantly lower (p < 0.05) protein content in T2 and T6 samples was imparted from the low-quality powdered milk containing less fat. While the average protein content in cow’s milk is reported to be 3.32% [19]. Protein content can be influenced by various factors, such as breed, nutrition, parity, stage of lactation, environmental temperature, and diseases [20]. Probably, the main reason for negligible protein content in the T2 group was that it did not contain enough casein protein. Hence, the total protein content was also noticeably below the average value. The T6 milk sample was formulated using 50% reconstituted low-quality powdered milk, which resulted in a lower value than the standard for protein content in market milk.
The carbohydrate content of reconstituted low-quality powder milk samples (T2, 9.32%) was significantly higher (p < 0.05) than other milk samples. Contrarily, the control group contained the lowest carbohydrate content (4.51%). The average lactose (milk sugar, the main carbohydrate) content of cow milk is 4.8%, which is close to the control sample. However, the carbohydrate content of T1, T3, T4, T5, and T6 was close to the finding of Islam et al. [21], who reported average milk carbohydrate content of 4.5% and 3.87% in the milk of the Mymensingh area of Bangladesh. The carbohydrate content of the T2 group might increase due to the adulteration of low-quality powdered milk with different components such as flour or sugar. We calculated the carbohydrate content by using a simple calculation formula, and the T2 group showed dramatically higher lactose content due to the least or minimal fat and protein content in the samples of that group.
Protein distribution pattern of different milk samples. NPN, nonprotein nitrogen; NCN, noncasein nitrogen; T1, control (known source); T2, reconstituted low quality powder milk; T3, reconstituted local brand powder milk; T4, market milk from Goala; T5, 75% T1 + 25% T2; and T6, 50% T1 + 50% T2. abcMean values in the same patterned bar with uncommon superscript letters differed significantly.
Protein distribution pattern
Figure 1 exhibits the protein distribution pattern of different graded milk samples. The N-containing portions (TN) in milk are broadly composed of CN, whey NPN or NCN, and NPN. The T4 sample from Goala entailed maximum protein content, which was 1.4 times higher than the T6 sample and 2.4 times higher than the T2 sample. A similar trend was found in the case of the casein content of different milk samples. The T3 group contained the highest casein protein, which was 0.97% greater (p < 0.05) than the T6 group and 1.8% higher (p < 0.05) than the T2 group. Milk samples from the T1, T3, T4, and T5 groups showed close (p > 0.05) values for casein protein ranging from 2.09% to 2.32%, and these are significantly higher than the T6 group, followed by the T2 sample (0.5%) that contained the significantly lowest (p < 0.05) casein content. The normal range for casein protein in cow milk is 2.46%–2.80% [22].
The casein content of milk could be influenced by using preservatives or storage time [23]. In our study, the probable reason for the low casein content in the T2 group was that the milk powder used for the reconstituted milk might contain higher solids with low protein content. Therefore, lower casein protein content is also reflected in the T6 group. On the other hand, the highest NCN content was found in market milk from Goala (T4, 0.8%) and the smallest in reconstituted low-quality powder milk (T2, 0.6%) and reconstituted milk prepared from local brand powdered milk (T3, 0.6%). In our study, the NCN ranged from 0.60% to 0.87% in the case of all samples. Though the NCN contents were within the normal range, there was a significant difference among the groups (p < 0.05). The NCN content of T4 samples was significantly (p < 0.05) higher, and T2 and T3 samples were significantly lower (p < 0.05) than other samples. Higher storage time could reduce the NCN content of milk [24]. The NPN content in different milk samples was almost similar, entailing the lowest (0.27%) in reconstituted local brand powder milk (T3) and the highest (0.32%) in the control group (T1). The NPN content of the T1 sample (0.3%) was statistically higher (p < 0.05) than all other groups. The NPN content of tested samples was slightly higher than that of their standard value of 0.10%–0.19% [24]. The NPN content of milk is affected by temperature. Li et al. [25] reported higher NPN content in hot than cold weather. The hot tropical weather of Bangladesh might have contributed to the higher NPN content.
Figure 2 illustrates the average percentage of casein protein, NCN, and NPN in the total protein of different milk samples. According to Fox and McSweeney [26], the share of casein protein, NCN, and NPN to the total protein of cow milk is around 78%, 17%, and ≈5%, respectively. All the groups showed similar casein protein percentages with the standard value except T2 and T6 (41% and 21% less than the standard average value, respectively). Contrarily, the T2 and T6 groups had relatively higher NCN (26% and 14% higher than the standard value, respectively) and NPN (around 14% higher for T2 and 6% higher for T6) contents than the standard mean values, whereas other groups contained similar percentages. These results indicate that low-quality powdered milk might be adulterated with low-protein ingredients.
Share of protein fractions to total protein in different milk samples. NPN, nonprotein nitrogen; NCN, noncasein nitrogen; T1, control (known source); T2, reconstituted low-quality powder milk; T3, reconstituted local brand powder milk; T4, market milk from Goala; T5, 75% T1 + 25% T2; and T6, 50% T1 + 50% T2.
Conclusion
The study showed that the specific gravity, acidity, and gross composition of milk can tell the difference between reconstituted milk, raw milk that has been mixed with reconstituted milk (using nonbranded bulk milk powder), and local brand powder milk reconstitution. By using the casein content, we were able to differentiate reconstituted milk (from nonbranded bulk powdered milk) and raw milk added with 50% fluid milk made from nonbranded bulk milk powder from raw cow milk*. *We also observed differences between the reconstituted milk from local brands of powdered milk and the Goalas milk supply. The NCN content was able to distinguish both the powdered milk from the raw milk. The results on NPN were also found to be variable in different samples. The addition of 25% reconstituted nonbranded bulk milk powder with the raw milk made very little detectable change. From this point forward, this technique could be used to form a national milk databank regarding the protein/nitrogen distribution pattern of milk and may be used in milk quality control, especially regarding adulteration.
The reference list from the paper itself. Each links out to its DOI / PubMed record.
- 1Lambrini K Aikaterini F Konstantinos K Christos I Ioanna PV Areti T Milk nutritional composition and its role in human health J Pharm Pharmacol 20219813
- 2DLS Livestock economy at a glance, Department of Livestock Services, Dhaka, Bangladesh, 2023–202401 December 2024 Available via https://dls.portal.gov.bd/sites/default/files/files/dls.portal.gov.bd/page/ee 5f 4621_fa 3a_40ac_8bd 9_898fb 8ee 4700/2024-08-13-10-26-93cb 11d 540e 3f 853de 9848587 fa 3c 81e.pdf
- 3Bangladesh Bank Annual import payments of goods and services 2022–2023, 2022–202301 December 2024 Available via https://www.bb.org.bd/pub/annual/imppayment/imp_2022-23.pdf
- 4Soomro AA Khaskheli M Memon MA Barham GS Haq IU Fazlani SN Study on adulteration and composition of milk sold at Badin Int J Res Appl Nat Soc Sci 2014295770
- 5Karmaker A Das PC Iqbal A Quality assessment of different commercial and local milk available in the local markets of selected area of Bangladesh J Adv Vet Anim Res 2020712633 http://doi.org/10.5455/javar.2020.g 3893221910610.5455/javar.2020.g 389PMC 7096109 · doi ↗ · pubmed ↗
- 6Ionescu AD Cîrîc AI Begea M A review of milk frauds and adulterations from a technological perspective Appl Sci 202313179821 https://doi.org/10.3390/app 13179821
- 7Villa C Costa J Oliveira MB Mafra I Cow’s milk allergens:screening gene markers for the detection of milk ingredients in complex meat products Food Control 20201081106823 https://doi.org/10.1016/j.foodcont.2019.106823
- 8Ghafoori Z Tehrani T Pont L Benavente F Separation and characterization of bovine milk proteins by capillary electrophoresis-mass spectrometry J Separat Sci 20224518361423 https://doi.org/10.1002/jssc.20220042310.1002/jssc.202200423 PMC 980517335866669 · doi ↗ · pubmed ↗