13N-Ammonia PET-CT for Evaluating Response to Antiangiogenic Therapy and Prognosis in Patients with Advanced Hepatocellular Carcinoma: A Pilot Study
Valentina Scolozzi, Alberto Nicoletti, Amedeo Capotosti, Francesca Romana Ponziani, Silvia Taralli, Enza Genco, Lucia Leccisotti, Roberto Moretti, Luca Indovina, Maurizio Pompili, Maria Lucia Calcagni

TL;DR
This study explores using 13N-ammonia PET-CT scans to predict treatment outcomes in advanced liver cancer patients receiving antiangiogenic therapy.
Contribution
The study introduces dynamic 13N-ammonia PET-CT as a potential tool for predicting early progression and survival in hepatocellular carcinoma patients.
Findings
Lower baseline K1mean in HCC lesions was linked to earlier disease progression.
Post-therapy K1 values in non-neoplastic liver correlated with longer survival.
PET-CT could not distinguish responders from non-responders after 8–10 weeks of treatment.
Abstract
The aim of this prospective study was to investigate the role of kinetic parameters derived from dynamic 13N-ammonia PET-CT for evaluating early treatment response and predicting prognosis in patients with advanced hepatocellular carcinoma (HCC) treated with antiangiogenic therapy. Patients with earlier radiological progression showed lower baseline K1mean in HCC lesions. Patients with longer overall survival showed significantly lower post-therapy K1mean, K1max, and K1peak values in non-neoplastic liver parenchyma. However, kinetic parameters could not distinguish between responders and non-responders after 8–10 weeks of treatment. This study suggests a potential role of 13N-ammonia PET-CT in selecting advanced HCC patients that will benefit from antiangiogenic therapy. Purpose: To prospectively investigate dynamic 13N-ammonia PET-CT for evaluating early treatment response and…
Genes, proteins, chemicals, diseases, species, mutations and cell lines named across the full text — each resolved to its canonical identifier and authoritative record.
Click any figure to enlarge with its caption.
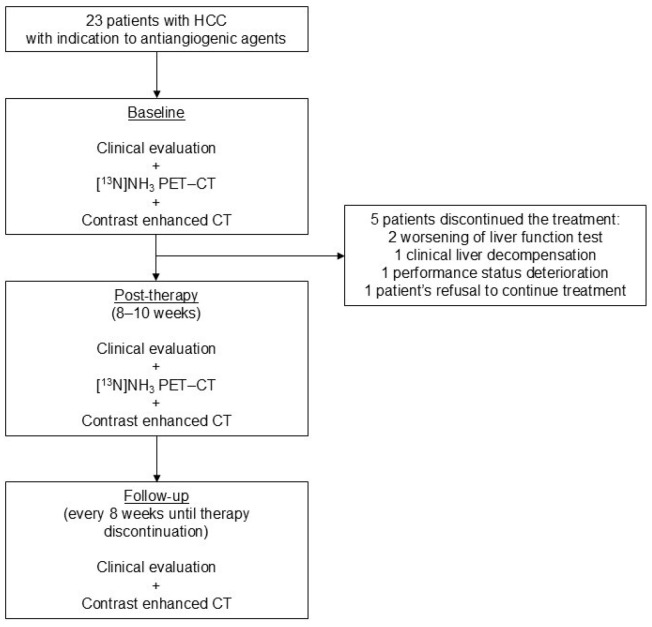 Figure 1
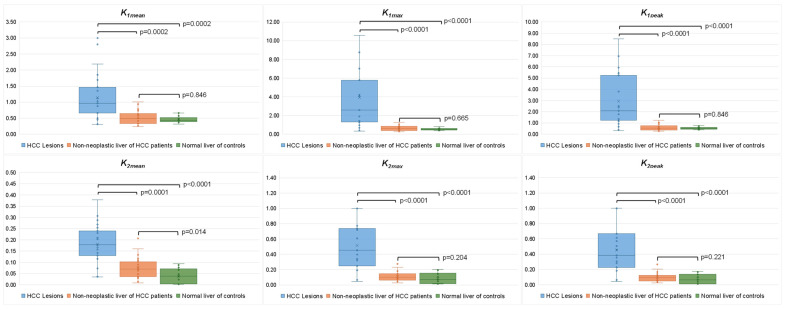 Figure 2
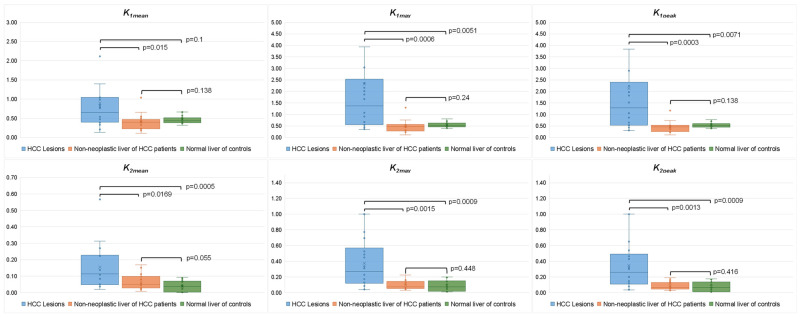 Figure 3
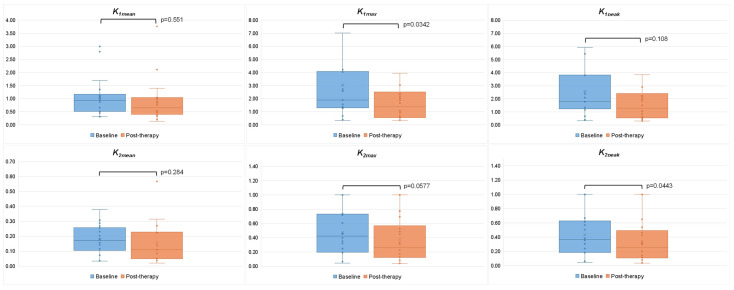 Figure 4
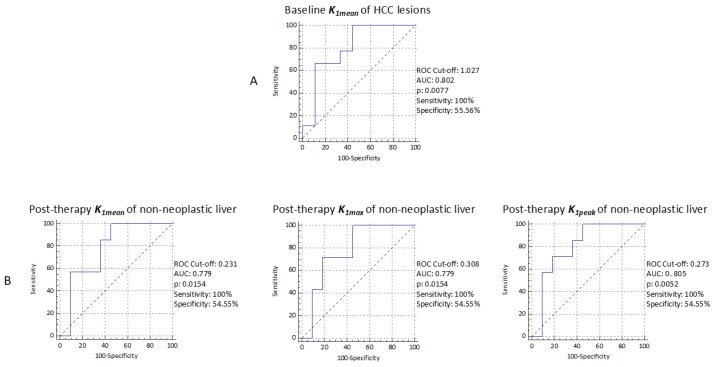 Figure 5
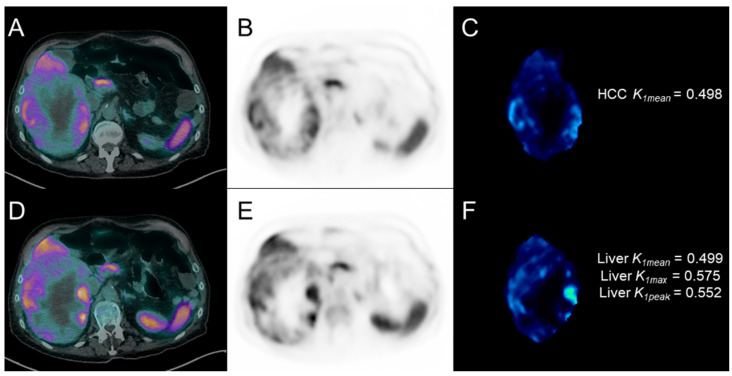 Figure 6
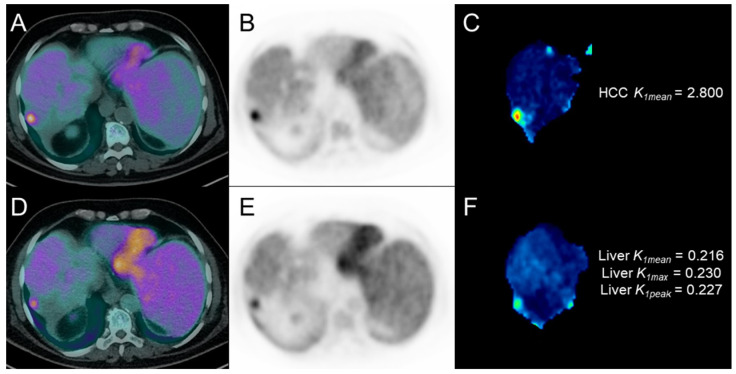 Figure 7
Peer Reviews
No public reviews on file for this paper yet. If you reviewed it on a platform where reviews are public (OpenReview, ICLR, NeurIPS, ICML), you can paste yours below so the community can read it here.
Videos
No videos yet. Explain this paper in a talk, walkthrough, or lecture? Add one.
Taxonomy
TopicsHepatocellular Carcinoma Treatment and Prognosis · Radiomics and Machine Learning in Medical Imaging · Cancer, Hypoxia, and Metabolism
1. Introduction
Hepatocellular carcinoma (HCC) is the most common primary liver tumor in Western countries, generally developing on the cirrhosis background [1]. In patients with advanced HCC (30–35% of patients at diagnosis) according to the Barcelona Clinic Liver Cancer staging system (BCLC C), for vascular invasion or extrahepatic disease with preserved liver function and normal/intermediate performance status (PS), the combination of bevacizumab (an inhibitor of the vascular endothelial growth factor receptor) and atezolizumab (a PD-L1/PD-1 immune checkpoint inhibitor) has been recently introduced as first-line therapy [2,3]. Nevertheless, antiangiogenic therapy with sorafenib (a multi-tirosinkinase inhibitor reducing tumor proliferation and angiogenesis) or lenvatinib (a multikinase inhibitor targeting simultaneously some biomolecular pathways) remains the treatment of choice in case of contraindication to immune checkpoint inhibitors or progression after the bevacizumab/atezolizumab combination [4,5,6]; antiangiogenic agents can also be considered in intermediate HCC patients (BCLC B) not responding to locoregional treatments (e.g., transarterial chemoembolization or radioembolization) [4]. The development of biomarkers that can accurately predict the efficacy of antiangiogenic therapy in terms of both tumor response and prognosis is crucial due to its high cost and prevalence of adverse effects and limited efficacy in some subpopulations. Since the reduction in tumor vascularization is the primary effect of antiangiogenic therapy, assessing perfusion changes should help early response evaluation. In clinical practice, antiangiogenic therapy efficacy is generally evaluated by contrast-enhanced computed tomography (c.e. CT) two months after the treatment start, according to mRECIST criteria that are based on dimensional changes in viable tumor size (i.e., the portion of target lesions with residual arterial enhancement) [6,7]. However, antiangiogenic agents can determine an irregular decline of tumor vascularization not resulting in necrotic tissue, limiting radiological response evaluation, especially in irregularly shaped HCC lesions. In this challenging context, the need emerges for additional imaging tools able to early detect tumor perfusion changes and also to predict prognosis. In the functional imaging field, ^13^N-ammonia is a perfusion Positron Emission Tomography (PET) tracer mainly metabolized in the liver [8,9,10]. In the oncological setting, ^13^N-ammonia PET was applied for assessing tumor perfusion, proving that several neoplasms show increased ^13^N-ammonia uptake (depending on tumor vascularization and tracer extraction efficacy), also suggesting a potential role for assessing response to treatments acting on tumor perfusion, especially if the baseline tracer uptake is sufficiently high [11,12,13]. Interestingly, HCC is a hypervascular tumor, and several enzymes involved in nitrogen metabolism (e.g., carbamyl-phosphate-synthetase and glutamine-synthetase) are overexpressed in HCC cells [14,15]. These characteristics make ^13^N-ammonia the ideal tracer for HCC evaluation, also considering its short half-life (10 min), implying good dosimetry. Conversely, its short half-life allows the use of ^13^N-ammonia only in PET centers equipped with a cyclotron, since it needs on-site tracer production. This practical aspect reasonably limits the widespread use of this tracer and, consequently, the amount of available related literature. The few and “historical” studies (before the clinical introduction of antiangiogenic drugs) that analyzed the role of ^13^N-ammonia in HCC patients demonstrated a relationship between tumor blood flow and tracer uptake [16,17].
The aims of this prospective study were to investigate the role of kinetic parameters derived from dynamic ^13^N-ammonia PET-CT for evaluating early response to antiangiogenic therapy and for predicting prognosis in advanced HCC patients.
2. Materials and Methods
2.1. Patients
The prospective study protocol has been approved by the Ethics Committee of the Fondazione Policlinico Universitario “Agostino Gemelli” IRCCS of Rome, Italy (28603/19, ID 2670). From July 2019 to December 2021, 23 consecutive advanced HCC patients with preserved (Child-Pugh A) or moderately impaired (Child-Pugh B) liver function and Eastern Cooperative Oncology Group (ECOG) PS ≤ 2 were candidates to start antiangiogenic therapy at the local Liver Diseases Outpatient Clinic. Exclusion criteria were contraindication to antiangiogenic therapy, history of other malignancies, contraindication to c.e. CT, and females of childbearing age. Written informed consent was obtained from all enrolled patients. ^13^N-ammonia PET-CT and chest and abdomen c.e. CT were performed before starting antiangiogenic therapy (within 15 days) and after 8–10 weeks of treatment. According to institutional multidisciplinary liver tumor board re-evaluation, antiangiogenic therapy was continued in patients with stable or responding disease, stable liver function, and adequate PS (ECOG < 2). Clinical, laboratory, and imaging data were collected at recruitment and during follow-up; radiologic progression and death were recorded as outcomes until September 2023.
2.2. 13N-Ammonia PET-CT
All ^13^N-ammonia PET-CT scans were performed at the local PET-CT Center, using the Biograph mCT (Siemens Healthineers, Chicago, IL, USA) PET-CT scanner system, with the upper abdomen in the field of view. A 3D dynamic list-mode acquisition lasting 20 min started simultaneously with the i.v. administration of ^13^N-ammonia (370 MBq). Images were reconstructed with the following framing: 9 frames of 5 s each, 1 frame of 30 s, 1 frame of 45 s, 6 frames of 3 min each. PET data were corrected for decay, scatter, random events, dead time, and attenuation and reconstructed with the Ordered Subset Expectation Maximization (OSEM) algorithm, including Time-of-Flight (ToF) and Point Spread Function (PSF) modeling with 21 subsets and 2 iterations, with a 256 × 256 matrix size (3.18 × 3.18 × 5 mm) and applying a 2 mm post-reconstruction Gaussian filter. A static image was also reconstructed. Before PET acquisition, a low-dose CT scan was performed (tube current 50 mAs, voltage 120 kV, pitch 0.9, exposure time 0.5 s) for attenuation correction and morphological information. Kinetic analysis of dynamic PET images was performed using Volumes of Interest (VOIs). For each patient, HCC lesions were manually contoured on c.e. CT images, employing MIM software (v.7.3.4) to achieve precise lesions’ delineation and forming the baseline for subsequent fusion and contouring tasks. Exploiting both rigid and deformable registration capabilities of the MIM software, c.e. CT images were fused with dynamic PET-CT series, facilitating the automatic contour transfer to the dynamic PET-CT series; manual editing on the PET-CT series ensured accuracy and precision of contours. In patients with multiple HCC lesions, the largest one was chosen (HCC VOI). Moreover, the uptake of non-neoplastic liver parenchyma was evaluated by a spherical VOI of 1 cm^3^ placed on normal-appearing liver parenchyma on c.e. CT images and subsequently transferred to PET images (liver VOI). A spherical VOI with the same volume was placed in liver parenchyma to extract the kinetic parameters in a local population of 15 patients who underwent ^13^N-ammonia PET-CT for cardiologic indications and without known liver diseases, used as normal controls. Finally, to construct the Image-Derived Input Function (IDIF), a VOI was manually delineated on the descending aorta, placing three consecutive Regions of Interest (ROI). An evaluation between 2-tissue and 1-tissue compartment models was performed with PKIN to assess the best fit with patients’ data. Kinetic analysis was then conducted using the PXMOD tool, choosing the 1-tissue compartment Alpert model (i.e., a slightly modified version of the classical implementation of Alpert’s time-weighted integral approach for brain perfusion) [18,19] because it was the best fit; this model operates on the principle of a single exchange between blood and tissue compartments and provides the kinetic PET parameters K_1_ (mL/cm^3^/min) and k_2_ (min^−1^), respectively, representing the ^13^N-ammonia blood-to-tissue and tissue-to-blood transport (liver as tissue of interest). The parametric maps for both K_1_ and k_2_ (representing the spatial distribution of the kinetic parameters) were automatically generated, illustrating the quantitative behavior of the tracer over time; HCC and liver VOIs were loaded onto these maps, and the mean, maximum, and peak values of K_1_ and k_2_ from each VOI were extracted.
2.3. Antiangiogenic Therapy
All patients started on antiangiogenic therapy with either sorafenib (start dosage: 400 mg bid) or lenvatinib (start dosage: 8–12 mg qd, according to body weight < or >60 Kg), with dosage reduction in case of adverse effects or liver function test abnormalities. Treatment was discontinued in case of clinical liver decompensation, deterioration of patients’ PS, or severe liver function test alterations.
2.4. Statistical Analysis
Given the absence of previous similar studies on ^13^N-ammonia PET-CT in patients with advanced HCC undergoing antiangiogenic treatment (i.e., the pilot nature of this study), there was no need for a formal calculation of a minimum sample size. However, consistent with proper statistical rules [20], we planned to enroll at least 18 patients, considering the mean annual accesses of advanced HCC patients eligible for antiangiogenic therapy to the local Liver Diseases Outpatient Clinic and a 25% treatment discontinuation before the first imaging follow-up (8 weeks) due to adverse effects.
Response to antiangiogenic treatment were assessed using mRECIST criteria [7] on c.e. CT performed at 8-10 weeks from the start of treatment; patients’ response was classified into four categories: complete response (CR), partial response (PR), stable disease (SD) or progressive disease (PD), then grouping CR, PR, and SD into the “responders” category, and PD into the “non-responders” one. Patients were followed up until death or until September 2023 in still-living patients. Progression-free survival (PFS) and overall survival (OS) were, respectively, defined as the time (months) from the start of treatment to radiologic progression (at c.e. CT or magnetic resonance) or to death during follow-up. For patients who had not experienced recurrence or death at the time of the last follow-up, PFS and OS were censored at the last follow-up date. Patients’ characteristics were reported according to descriptive data analysis techniques. Quantitative variables were described as median and interquartile range (IQR) or mean ± standard deviation (SD), using the Smirnov–Kolmogorov test to assess normal distribution. Qualitative variables were defined as absolute frequency or percentage. According to the Smirnov–Kolmogorov test result, the association between dependent (response to treatment, PFS, OS) and independent variables (kinetic PET parameters) was tested using univariate analysis by Wilcoxon and Mann–Whitney tests; comparison between binary variables was tested using Fisher’s exact test. PET parameter performance was also assessed by receiver operating characteristic (ROC) curve analysis, using PFS at 6 months and OS at 12 months as a reference; the decision cut-off was considered optimal when the product of paired values for sensitivity and specificity reached its maximum. A p-value < 0.05 was considered statistically significant. Data analysis was performed using MedCalc software (version 11.6; Broekstraat, Mariakerke, Belgium).
3. Results
3.1. Patient Characteristics
The clinical characteristics of the study population (n = 23) are summarized in Table 1 and Figure 1. All patients were cirrhotic and underwent a baseline ^13^N-ammonia PET-CT scan. Thirteen (56.5%) patients were started on sorafenib and ten (43.5%) on lenvatinib. In one patient (7.7%) on sorafenib treatment and four patients (40%) on lenvatinib treatment, the dosage was reduced during treatment. Treatment was stopped before 8 weeks in 5/23 patients (21.7%) because of worsening liver function tests (n = 2), clinical liver decompensation (n = 1), PS deterioration (n = 1), or patient’s refusal to continue treatment (n = 1). Therefore, post-therapy ^13^N-ammonia PET-CT was performed in 18/23 patients (78.3%).
3.2. Kinetic PET Parameters in HCC Lesions and Non-Neoplastic Liver Parenchyma
The best fit of the 2-tissue and 1-tissue compartment models to the patient data showed median percentage SE for k_3mean_ and k_4mean_ of 2.31 × 10^24^ (IQR 2.66 × 10^6^–1.94 × 10^30^) and 4.00 × 10^3^ (IQR 8.26 × 10^2^–7.36 × 10^5^), respectively, while the median percentage SE for k_1mean_ and k_2mean_ were 5.02 (IQR 3.74–7.23) and 7.75 (IQR 5.71–12.1), respectively. Due to the large percentage SE for k_3mean_ and k_4mean_, the 1-tissue model was selected to perform the following pixelwise parametric compartmental model calculation. At baseline ^13^N-ammonia PET-CT (n = 23), all kinetic PET parameters were significantly higher in HCC lesions compared to non-neoplastic liver of HCC patients and liver parenchyma of normal controls. A significant difference in k_2mean_ values between non-neoplastic liver and the liver of normal controls was found (0.069 (IQR 0.036–0.101) vs. 0.038 (IQR 0.003–0.070), p = 0.014). However, no significant difference was observed in the other PET parameters (Figure 2).
At post-therapy ^13^N-ammonia PET-CT (n = 18), all PET parameters remained significantly higher in HCC lesions compared to non-neoplastic liver and controls. No significant difference was found in PET parameters between the non-neoplastic liver of HCC patients and the liver parenchyma of control subjects, with only a trend for higher k_2mean_ values in the HCC group (0.050 (IQR 0.028–0.098) vs. 0.038 (IQR 0.003–0.070), p = 0.055) (Figure 3).
Comparing baseline and post-therapy PET-CT parameters in HCC lesions, K_1max_ (1.901 (IQR 1.308–4.047) vs. 1.370 (IQR 0.554–2.335), p = 0.034) and k_2peak_ (0.369 (IQR 0.185–0.615) vs. 0.259 (IQR 0.118–0.478), p = 0.034) were significantly reduced at post-therapy compared to baseline, with also a trend towards statistical significance observed for k_2max_ values (0.425 (IQR 0.198–0.731) vs. 0.270 (IQR 0.129–0.731), p = 0.0557) (Figure 4). No significant difference was found in all kinetic PET parameters of non-neoplastic liver between baseline and post-therapy PET.
3.3. Kinetic PET Parameters and Clinical Outcomes
Considering the 18 patients who completed at least 8–10 weeks of treatment and underwent post-treatment PET, 13/18 patients (72.2%) were classified as responders according to mRECIST criteria (1 CR, 1 PR, and 11 SD), and treatment was continued, with one patient transplanted after CR; 5/18 patients (27.8%) were classified as non-responders (all PD), and the treatment was discontinued. No significant difference was found in baseline and post-therapy dynamic PET parameters, or in their percentage variations, between responders and non-responders. When comparing kinetic parameters in the responder patients (n = 13), significant reductions in K_2max_ and K_2peak_ values were observed between baseline and post-therapy PET (K_2max_ (0.397 (IQR 0.170–0.733) vs. 0.228 (IQR 0.096–0.568), p = 0.014) and K_2peak_ (0.354 (IQR 0.156–0.632) vs. 0.201 (IQR 0.081–0.493), p = 0.02).
During follow-up (median: 14.2 months, range: 2.7–34.3), 15/18 patients (83.3%) experienced radiological progression, nine of whom within 6 months after the start of treatment. Those nine patients with early radiological progression (within 6 months) showed significantly lower K_1mean_ values in HCC lesions at baseline ^13^N-ammonia PET than the remaining nine patients with no-progression or late-progression (0.658 (IQR 0.487–0.973) vs. 1.117 (IQR 0.899–1.969), p = 0.03). Results of the ROC analysis are reported in Figure 5 (section A). No significant difference was found in all the other baseline and post-therapy PET parameters (and in their percentage variations). During follow-up, 9/18 patients (50%) presented clinical decompensation and 14/18 (77.8%) deceased; 7/14 deceased within 12 months after the start of treatment. Patients still alive 12 months after the start of treatment (n = 11) showed significantly lower K_1mean_ (0.231 (IQR 0.216–0.443) vs. 0.461 (IQR 0.394–0.533), p = 0.05), K_1max_ (0.3080 (IQR 0.246–0.506) vs. 0.569 (IQR 0.475–0.600), p = 0.05), and K_1peak_ (0.273 (IQR 0.233–0.489) vs. 0.529 (IQR 0.456–0.572), p = 0.03) values in non-neoplastic liver parenchyma at post-therapy ^13^N-ammonia PET compared with patients with shorter survival (n = 7). Results of the ROC analysis are reported in Figure 5 (section B). No significant difference was found in all baseline and other post-therapy PET parameters in non-neoplastic liver parenchyma. Figure 6 and Figure 7 show representative cases of one patient with early disease progression and death (PFS: 5.0 months; OS: 7.5 months) and one patient with late disease progression and alive at last follow-up (PFS: 12.2 months), respectively.
4. Discussion
To the best of our knowledge, this is the first study that evaluated the potential role of quantitative parameters derived from ^13^N-ammonia PET to predict treatment response and clinical outcomes in HCC patients treated with antiangiogenic therapy. Our results reflect the well-known biological features of HCC lesions, characterized by hyper-vascularization and deranged nitrogen metabolism in most cases [21,22]. Indeed, HCC lesions showed higher K_1_ and k_2_ values, indicative of higher vascular supply and faster ammonia wash-out than non-neoplastic liver and control subjects, both at baseline and post-therapy. In addition, we found that non-neoplastic liver showed higher k_2_ values compared with normal subjects. This faster ammonia wash-out may be due to the impaired hepatocytes’ function of cirrhotic cells, although the vascular supply is preserved, being K_1_ values similar to that of liver parenchyma of control subjects.
In HCC lesions, antiangiogenic agents act by blocking the neoangiogenesis mechanisms and reducing the vascular supply. In this context, response to sorafenib has been evaluated by perfusion parameters from c.e. CT imaging or contrast-enhanced ultrasound, suggesting a potential role of quantitative perfusion data for assessing treatment response and clinical outcomes [23,24]. As PET imaging, we found that HCC lesions showed lower perfusion after therapy, as expressed by a reduction of K_1max_ values, so suggesting a greater efficacy of antiangiogenic agents in more vascularized areas within the lesions, making the tumor perfusion more homogeneous. It would be interesting to evaluate whether a longer treatment period could determine a reduction also in K_1mean_ and K_1peak_ values, unchanged after 8–10 weeks of treatment. Moreover, HCC lesions showed slower wash-out after therapy, as expressed by a reduction of k_2_ values, more pronounced in the responder patients, suggesting an effect of antiangiogenic agents not only on perfusion but also on cell function. Finally, although we found a reduction in kinetic parameters in HCC after 8–10 weeks of treatment, lesions remained more vascularized than non-neoplastic liver parenchyma, suggesting the need for a longer observation period to detect a PET measurable change in the tumor vascular supply.
A thorough estimation of treatment response is crucial to identify patients who benefit from antiangiogenic therapy early, as these agents are characterized by significant adverse effects and high costs. The identification of early non-responders could avoid ineffective and potentially harmful therapies [25]. However, baseline or post-therapy PET parameters did not allow for the discrimination of responders from non-responder patients, probably due to the unbalanced groups’ size.
Several efforts have been made to improve the dismal prognosis of advanced HCC patients during recent years. Although combined treatment with immune checkpoint inhibitors has been shown to provide better OS and PFS than multi-tirosinkinase inhibitors alone, antiangiogenic therapy still represents an indispensable tool in these patients. In the targeted-therapy era, a tool able to predict early progression after antiangiogenic therapy may help to choose the correct treatment in patients with advanced HCC. So far, no validated biomarkers have been found [25]. In this context, our study provides potentially useful clinical findings. Indeed, the most promising result is that patients who experienced early progression (within 6 months) after antiangiogenic therapy showed lower baseline HCC K_1_ values compared to early non-progressors. As expected, antiangiogenic agents demonstrated a greater efficacy in highly vascularized HCC lesions compared to less vascularized ones [26]. Hence, baseline ^13^N-ammonia PET could be useful to a priori select patients that will benefit from antiangiogenic therapy, avoiding adverse effects and ineffective therapies burdened by high costs in patients with expected worse clinical outcomes. The potential role of dynamic PET perfusion imaging to identify oncological patients who will benefit from antiangiogenic treatment was previously explored in different oncological populations, such as by de Langen AJ et al. [27]. The authors evaluated the role of radiolabeled water (H_2_^15^O), another PET perfusion agent, for predicting survival benefit in patients with advanced non-small cell lung cancer treated with antiangiogenic agents, within a wide imaging protocol also including ^18^F-FDG PET and c.e. MRI. In detail, the percentage change in tumor perfusion between H_2_^15^O PET imaging at baseline and 3 weeks after treatment was correlated with PFS. From H_2_^15^O PET results, the authors found that a deeper decrease in tumor perfusion was associated with longer PFS and that perfusion information seemed to allow earlier response evaluation than CT imaging, supporting the valuable role of PET perfusion imaging.
Finally, regarding our results, higher K_1_ values of non-neoplastic liver at post-therapy PET are associated with the occurrence of death within 12 months after the start of treatment. Interestingly, the abnormal vasoconstriction in cirrhosis with portal hypertension can lead to neoangiogenesis that increases liver vascular volume in response to inflammation and fibrosis [28,29]. The increase in non-neoplastic liver perfusion (as reflected by higher K_1_ values) might express a condition of stress, explaining a higher rate of decompensation and subsequent death in this subgroup of patients.
This study has some limitations, mainly the already mentioned small study population; this aspect may limit the statistical power of our analysis, especially when comparing responders (n = 13) vs. non-responders (n = 5), reasonably explaining the lack of significant differences in PET parameters between these two groups. Moreover, the limited number of patients allowed us to perform only a descriptive survival data analysis. However, this is the first study evaluating ^13^N-ammonia PET-CT in advanced HCC patients treated with antiangiogenic therapy, designed as a pilot study, with a sample size defined with a statistical method [20]. Secondly, we limited the PET response evaluation to the first 8-10 weeks after the start of treatment, aiming to intercept early PET measurable perfusion changes; hence, no information on perfusion changes after a longer antiangiogenic therapy period is available, and it should be explored in future studies.
5. Conclusions
This study suggests that, in advanced HCC patients treated with antiangiogenic agents, kinetic parameters from baseline and post-therapy ^13^N-ammonia PET-CT may help to predict early disease progression and survival; therefore, ^13^N-ammonia PET-CT may be a promising tool to select patients with advanced HCC for antiangiogenic therapy. PET parameters seem not able to discriminate responders and non-responders after 8–10 weeks of treatment; information on perfusion changes after longer antiangiogenic treatment periods should be explored in future studies and in larger populations.
The reference list from the paper itself. Each links out to its DOI / PubMed record.
- 1European Association for the Study of the Liver EASL Clinical Practice Guidelines: Management of hepatocellular carcinoma J. Hepatol.201869182236 Erratum in: J. Hepatol. 2019, 70, 8172962828110.1016/j.jhep.2018.03.019 · doi ↗ · pubmed ↗
- 2Golfieri R. Bargellini I. Spreafico C. Trevisani F. Patients with Barcelona Clinic Liver Cancer Stages B and C Hepatocellular Carcinoma: Time for a Subclassification Liver Cancer 20198789110.1159/00048979131019899 PMC 6465743 · doi ↗ · pubmed ↗
- 3Finn R.S. Qin S. Ikeda M. Galle P.R. Ducreux M. Kim T.Y. Kudo M. Breder V. Merle P. Kaseb A.O. Atezolizumab plus Bevacizumab in Unresectable Hepatocellular Carcinoma N. Engl. J. Med.20203821894190510.1056/NEJ Moa 191574532402160 · doi ↗ · pubmed ↗
- 4Cabibbo G. Giannini E. Piscaglia F. Trevisani F. Daniele B. Belli G. ViganòL. Cappabianca S. Romanini L. Volterrani L. Raccomandazioni Multisocietarie Italiane (AISF, AIOM, IT-IHPBA, SIC, SIRM, SITO) per la Gestione Clinica Integrata del Paziente con Epatocarcinoma (HCC)Available online: https://sirm.org/wp-content/uploads/2021/04/304-Documento-intersocietario-AISF-AIOM-IT-IHPBA-SIC-SIRM-SITO-2016-HCC-raccomandazioni-multisocietarie.pdf(accessed on 23 December 2024)
- 5Reig M. Forner A. Rimola J. Ferrer-Fàbrega J. Burrel M. Garcia-CriadoÁ. Kelley R.K. Galle P.R. Mazzaferro V. Salem R. BCLC strategy for prognosis prediction and treatment recommendation: The 2022 update J. Hepatol.20227668169310.1016/j.jhep.2021.11.01834801630 PMC 8866082 · doi ↗ · pubmed ↗
- 6Kudo M. Montal R. Finn R.S. Castet F. Ueshima K. Nishida N. Haber P.K. Hu Y. Chiba Y. Schwartz M. Objective Response Predicts Survival in Advanced Hepatocellular Carcinoma Treated with Systemic Therapies Clin. Cancer Res.2022283443345110.1158/1078-0432.CCR-21-313534907081 PMC 12951728 · doi ↗ · pubmed ↗
- 7Lencioni R. Llovet J.M. Modified RECIST (m RECIST) assessment for hepatocellular carcinoma Semin. Liver Dis.201030526010.1055/s-0030-124713220175033 PMC 12268942 · doi ↗ · pubmed ↗
- 8Molecular Imaging and Contrast Agent Database (MICAD) Bethesda (MD): National Center for Biotechnology Information (US); 2004–2013 Available online: https://www.ncbi.nlm.nih.gov/books/NBK 5330/(accessed on 23 December 2024)20641179 · pubmed ↗