
Abstract
Genes, proteins, chemicals, diseases, species, mutations and cell lines named across the full text — each resolved to its canonical identifier and authoritative record.
Click any figure to enlarge with its caption.
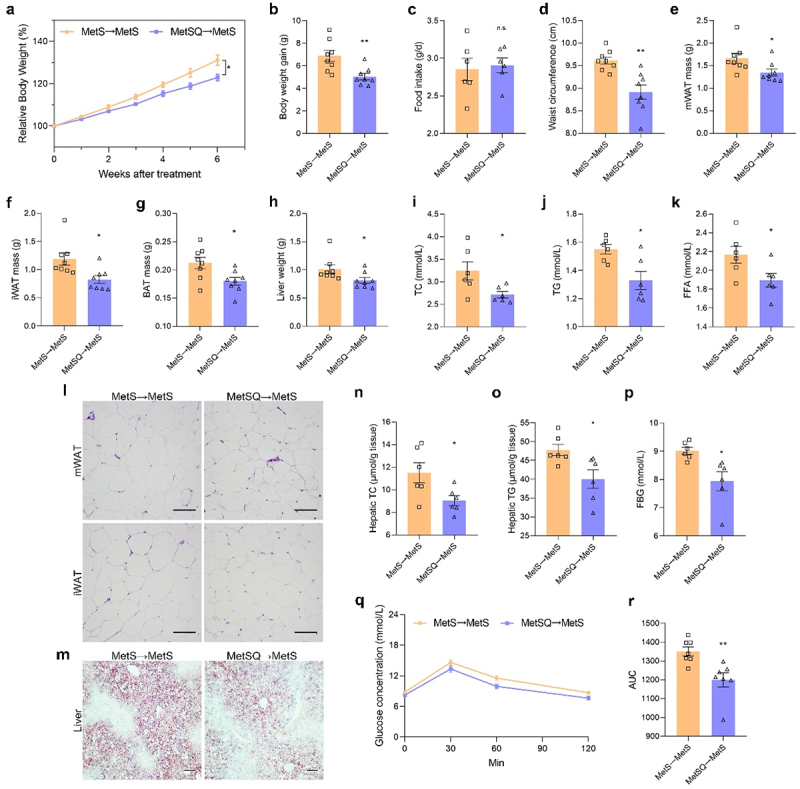 Figure 1
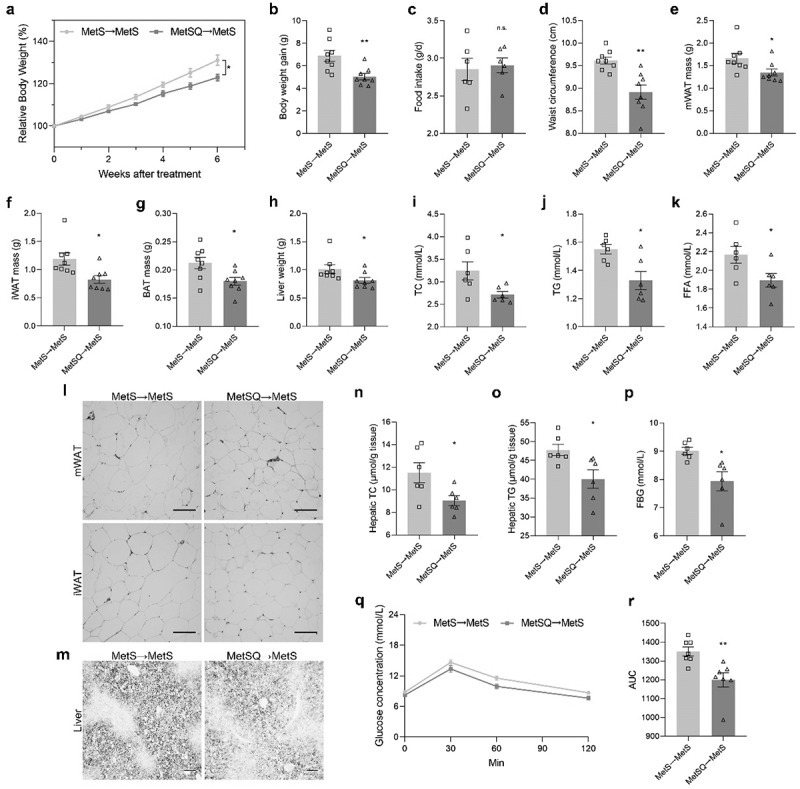 Figure 2
Peer Reviews
No public reviews on file for this paper yet. If you reviewed it on a platform where reviews are public (OpenReview, ICLR, NeurIPS, ICML), you can paste yours below so the community can read it here.
Videos
No videos yet. Explain this paper in a talk, walkthrough, or lecture? Add one.
Article title: Quercetin activates energy expenditure to combat metabolic syndrome through modulating gut microbiota-bile acids crosstalk in mice
Authors: Zhu, X., Dai, X., Zhao, L., Li, J., Zhu, Y., He, W., … Lei, L.
Journal: Gut Microbes
DOI: https://doi.org/10.1080/19490976.2024.2390136
Due to the authors’ oversight, the Figure 6m was incorrect in the published version which is now corrected and republished. The updated figure 6 is provided below. Figure 6.Fecal microbiota transplantation (FMT) effectively conferred metabolic benefits of quercetin to MetS mice. (a) Relative body weight. (b) Body weight gain. (c) Food intake. (d) The waist circumference. (e-g) The mass of mWAT, iWAT, and BAT. (h) Liver weight. (i-k) TC, TG, and FFA concentration in serum. (l) H&E staining images of mWAT and iWAT. Scale bar: 50 μm. (m) Oil red O staining images of liver tissues. Scale bar: 50 μm. (n, o) Hepatic TC and TG concentrations. (p) FBG. (q) The blood glucose concentration in the OGTT. (r) The AUC of the OGTT. All values are shown as mean ± s.e.m, n=8 per group in a, b, and d-h, n=6 per group in c, i-k and n-p, n=7 per group in q and r, *p < 0.05, **p < 0.01, n.s., non-significant.