Integrated Transcriptome and Proteome Analysis Provides New Insights into Starch and Sucrose Metabolism and Regulation of Corm Expansion Process in Colocasia esculenta
Chengwu Zou, Fanglian He, Huinan Li, Lili Liu, Zuyang Qiu, Weiqing Dong

TL;DR
This study explores how starch and sucrose metabolism regulate corm expansion in taro, using integrated transcriptome and proteome analysis to identify key genes and proteins.
Contribution
The study provides new insights into the genetic and proteomic regulation of starch biosynthesis and corm development in Colocasia esculenta.
Findings
Amylose and amylopectin contents increase during corm development, showing temporal regulation of starch biosynthesis.
Differentially expressed genes and proteins linked to starch and sucrose metabolism were identified through integrated transcriptome and proteome data.
The study reveals a connection between gene/protein expression and starch content changes in taro corms.
Abstract
This study focuses on Colocasia esculenta, a globally significant tuber crop known for its nutritional value and starch content. While previous research has explored starch accumulation in tubers, the genes and proteins involved in corm expansion are not well understood. This research investigates the ‘Lipu Taro No.1’ variety, analyzing its starch content and conducting full-length transcriptome sequencing and proteomic analysis at the different stages of corm development. Findings show that both amylose and amylopectin contents increase with corm development, indicating temporal regulation of starch biosynthesis. By integrating transcriptome and proteomic data, this study identifies differentially expressed genes and proteins related to starch and sucrose metabolism and plant hormone signal transduction. This reveals a link between starch content changes and gene and protein expression…
Genes, proteins, chemicals, diseases, species, mutations and cell lines named across the full text — each resolved to its canonical identifier and authoritative record.
Click any figure to enlarge with its caption.
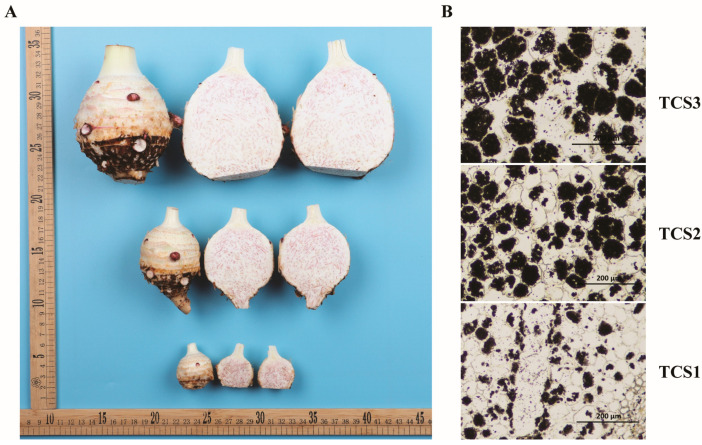 Figure 1
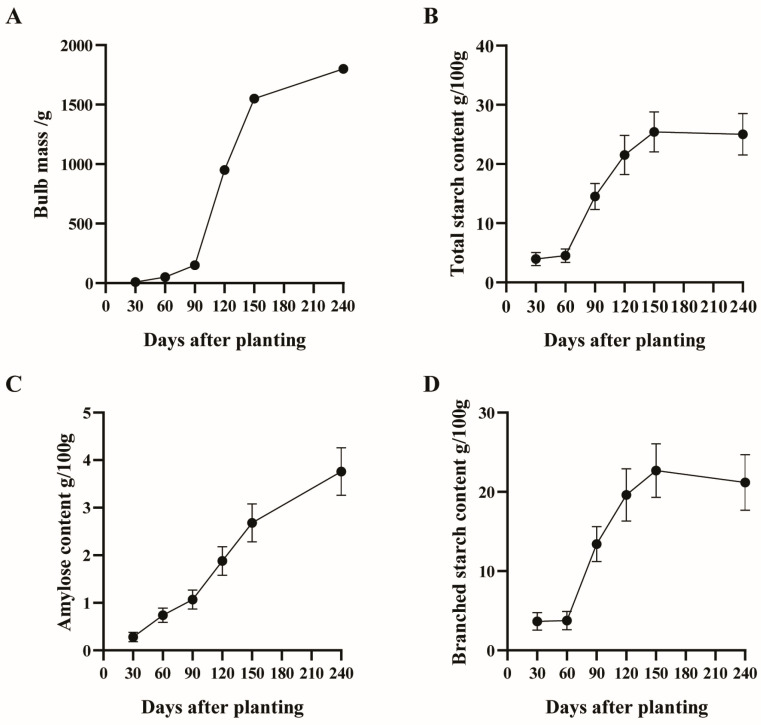 Figure 2
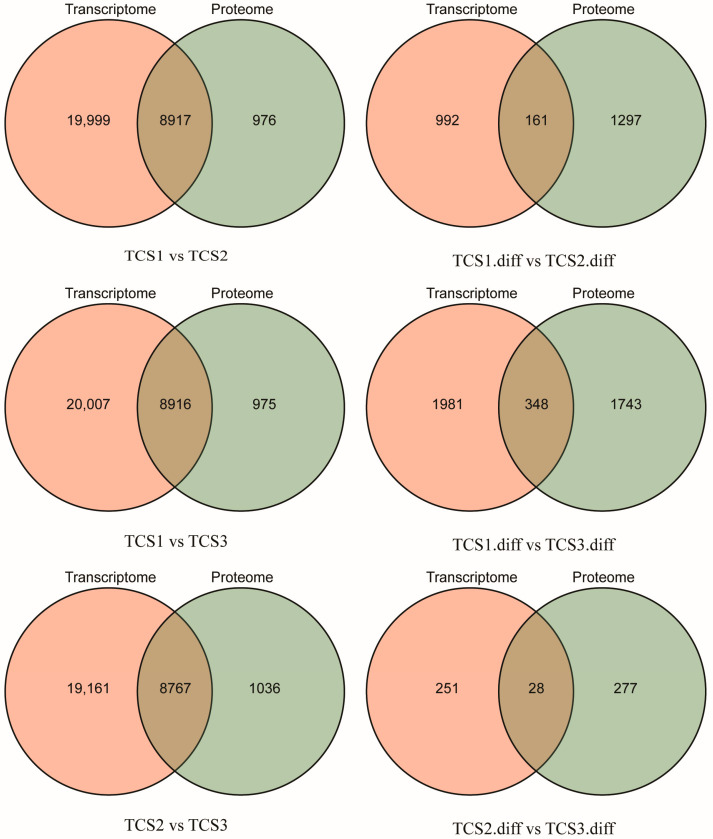 Figure 3
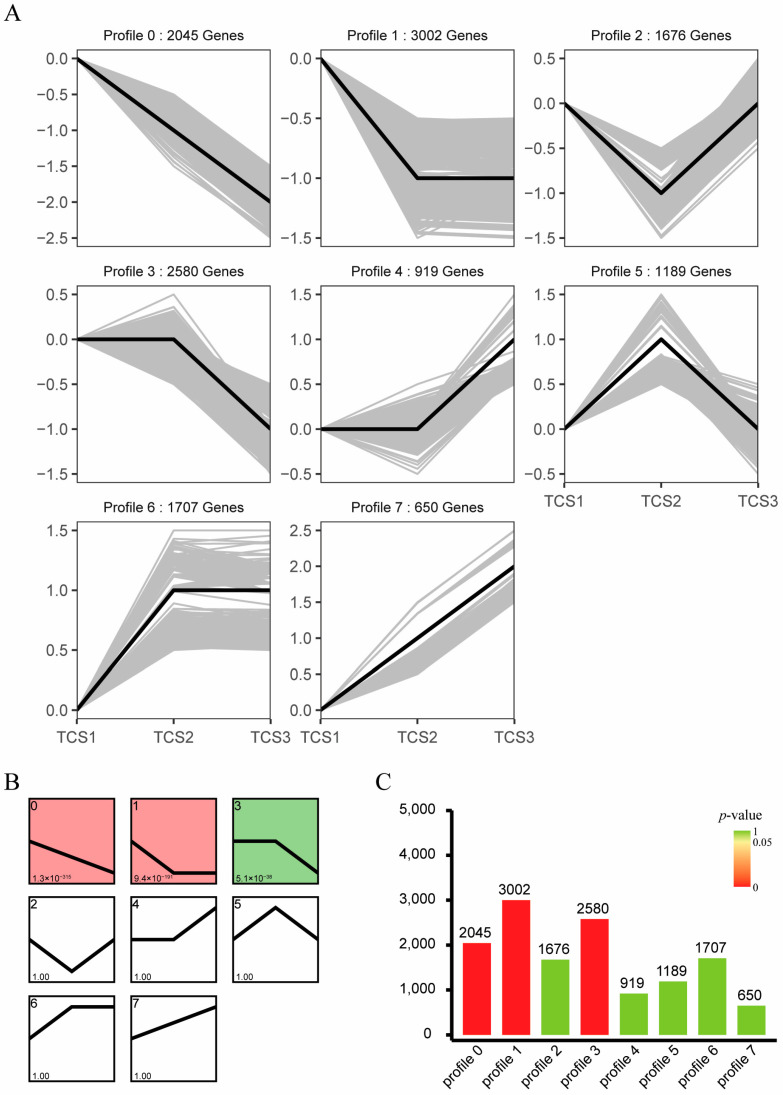 Figure 4
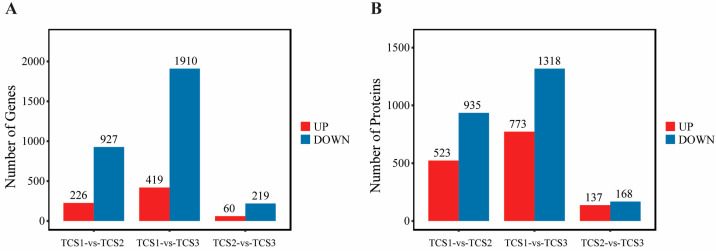 Figure 5
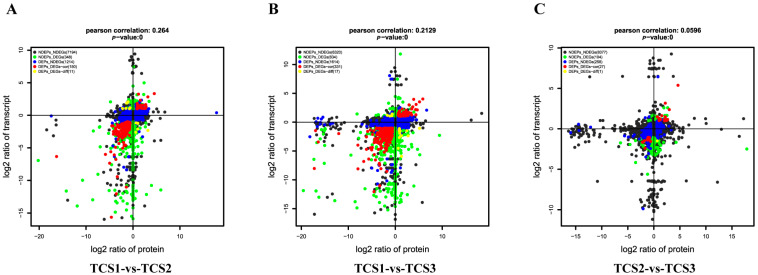 Figure 6
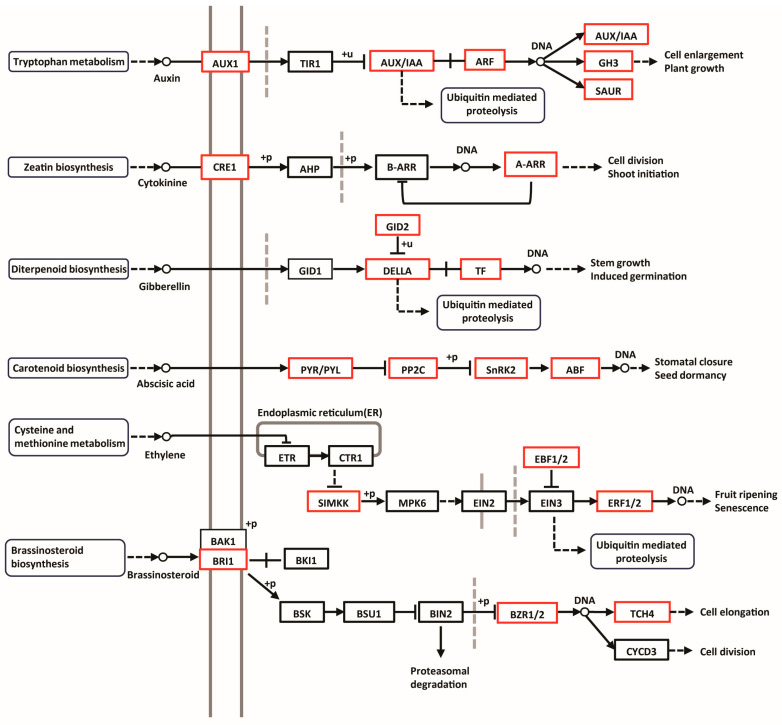 Figure 7
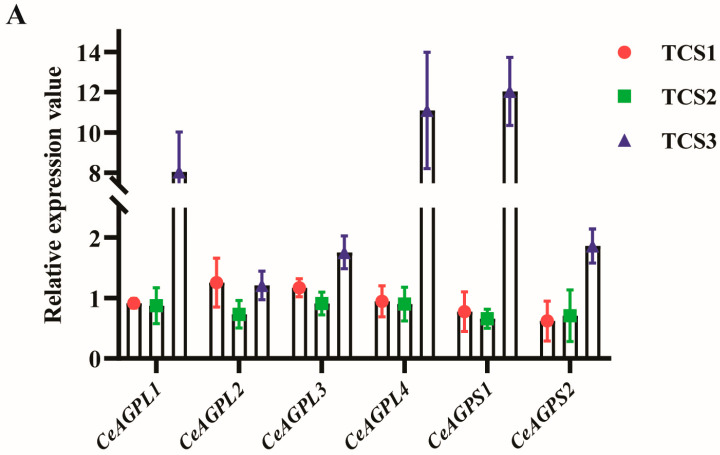 Figure 8
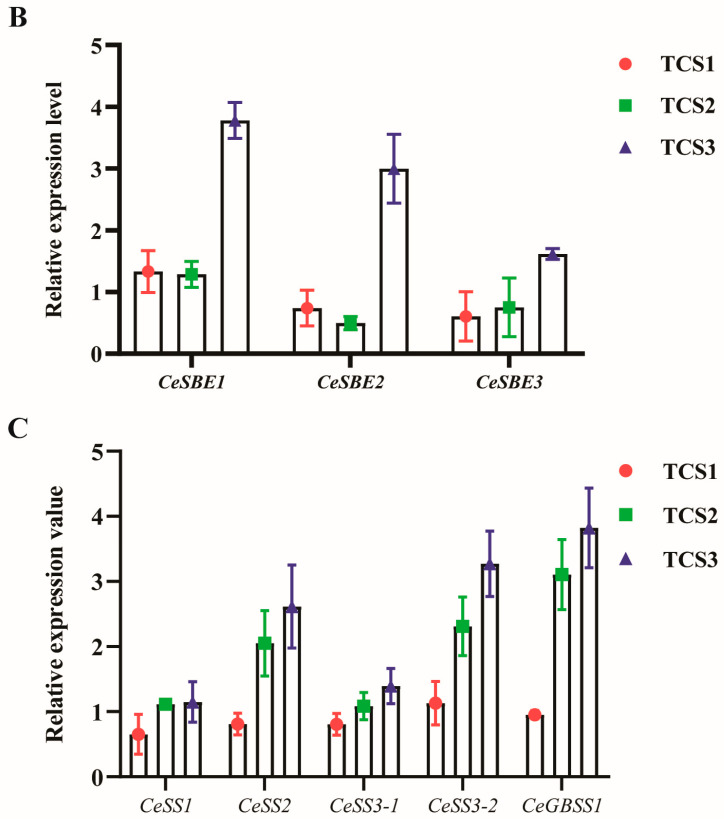 Figure 9
- —National Natural Science Foundation of China
- —Natural Science Foundation of Guangxi
- —Guangxi Lipu Taro Characteristic Crop Experiment Station Project
- —Basic scientific research business project of Guangxi Academy of Agricultural Sciences
Peer Reviews
No public reviews on file for this paper yet. If you reviewed it on a platform where reviews are public (OpenReview, ICLR, NeurIPS, ICML), you can paste yours below so the community can read it here.
Videos
No videos yet. Explain this paper in a talk, walkthrough, or lecture? Add one.
Taxonomy
TopicsPacific and Southeast Asian Studies · Food and Agricultural Sciences · Food composition and properties
1. Introduction
Colocasia esculenta (L.) Schott, a member of the Araceae family, holds a historically significant position as a globally cultivated crop, predominantly in tropical and subtropical regions. This crop serves as a crucial food source for approximately 500 million people across Asia, Africa, Central America, and the Pacific Islands [1]. In particular, China boasts a rich history of taro cultivation spanning over 2000 years [2,3]. The taro corm, which functions both as a primary organ for nutrient storage and asexual reproduction, also holds substantial economic importance. According to recent statistics, China’s taro production reached 1.912 million tons in 2021, accounting for 15.43% of the global total and ranking third worldwide. In the same year, China exported 64,900 tons of taro, valued at USD 73.578 million, securing the top position globally in terms of export value [4].
As a starchy root crop, the taro corm constitutes the main edible portion, with starch comprising 70% to 80% of its dry matter. This high starch content plays a pivotal role in determining the yield and quality of taro [5]. Additionally, taro corms are rich in carbohydrates, fats, crude fiber, vitamin C, B vitamins, high-quality protein, and essential minerals such as calcium, potassium, and phosphorus, contributing to their overall nutritional value. Notably, taro boasts twice the carbohydrate content of potatoes and an 11% higher protein content compared to yams, cassava, and sweet potatoes [6]. Furthermore, taro’s moderate Glycemic Index (GI) positions it as an ideal dietary carbohydrate alternative for diabetic patients [1,7].
Among the various taro cultivars, Lipu Taro No. 1, bred by the Guangxi Academy of Agricultural Sciences, stands out for its exceptional yield and superior culinary quality. This variety exhibits a growth cycle ranging from 210 to 240 days and possesses distinctive morphological traits, including the absence of stolons, a spindle-shaped mother corm, individual corm weights between 1.5 and 3 kg, and an impressive yield per hectare of 33,000 to 42,000 kg (unpublished data). Lipu Taro No. 1 is renowned for its rich aroma and fine, waxy texture, distinguishing it as one of the most aromatic and finely textured varieties among taro cultivars. The intensity of its aroma and the fineness of its texture are vital indicators for assessing taro’s culinary quality, and Lipu Taro No. 1 excels in both aspects. However, despite these notable attributes, the underlying regulatory mechanisms governing corm enlargement and quality formation in this variety remain incompletely understood.
The advent of high-throughput sequencing technology has facilitated a deeper understanding of crop genetic backgrounds and the identification of functional genes. Currently, three taro genome sequences have been deposited in NCBI, providing a robust foundation for elucidating the molecular mechanisms underlying taro evolution and metabolic functions [3,8]. Concurrently, transcriptome studies on taro are emerging, encompassing various aspects such as metabolic pathway resolution and gene mining [9,10]. These studies offer promising avenues for unraveling the genetic and molecular mechanisms that contribute to the exceptional yield and culinary quality of Lipu Taro No. 1, thereby paving the way for future crop improvement strategies.
The corm’s development, as the principal organ for carbohydrate storage, including starch, is a multifaceted process that involves a complex interplay of internal signaling pathways and external environmental cues. In potatoes, tuber formation is governed by a suite of signaling factors, such as mobile RNAs and proteins, that are transported via the phloem and initiate a coordinated cellular reorganization, originating from the procambium or other phloem-associated meristematic cells [11]. Hormonal fluctuations, responses, and sugar transport mechanisms are subject to significant and shared modulation during the formation of both roots and tubers [11]. Our prior research identified a peak in starch accumulation in taro corms between 60 to 90 days after planting, with key genes involved in starch synthesis, including ADP glucose pyrophosphorylase (AGPase) and starch branching enzyme (SBE), peaking in expression at 120 days [12,13]. In the previous study, we conducted a comprehensive analysis of the differential expression patterns of mRNA, circular RNA, and miRNA across various developmental stages of taro corms using Illumina RNA-Seq technology, revealing a considerable number of genes with altered expression levels that are implicated in the starch and sucrose metabolic pathways (ko00500) [9].
In pursuit of a deeper understanding of the genetic and proteomic factors that govern the enlargement and quality formation processes of the taro corm, we have undertaken an integrative analysis of the transcriptome and proteome data from the Lipu Taro No. 1 corm at multiple developmental stages. We anticipate that the findings from this research will elucidate the key genes implicated in the corm’s growth dynamics and quality attributes, thereby contributing valuable genetic insights to the field of taro molecular breeding.
2. Materials and Methods
2.1. Plant Material
The present study focused on the ‘Lipu Taro No.1’ variety, selected for its medium maturation period and its esteemed characteristics, including a pronounced aroma and a refined textural profile. This cultivar was cultivated at the Guangxi Academy of Agricultural Sciences’ experimental station, situated at precise geographical coordinates of latitude 23°50′76.108″, longitude 104°59′77.55″, and an elevation of 59.5 m above sea level, with the planting commencing in March 2022. The soil fertility of the planting experimental materials was uniform, with a row spacing of 1 m and a plant spacing of 0.3 m.
2.2. Sampling Method
At 30, 60, 90, 120, 150, and 240 days after planting, three taro plants with consistent growth were randomly sampled, washed with deionized water, weighed, measured, and photographed, and then immediately processed for analysis. Each harvested taro corm was peeled and cut longitudinally into two parts and then cut into long, thin slices that were about 1 mm thick along the cross-section (each long, thin slice from the base of the stem to the bottom of the corm). A strip from one side of the corm center was taken, cut into small pieces, placed into a mortar, frozen with liquid nitrogen, ground into a powder, quickly transferred into several 2-milliliter centrifuge tubes, and immediately cryopreserved in liquid nitrogen for subsequent full-length transcriptome sequencing, qRT-PCR analysis, and proteome analysis. The other strip of the corm center was cut into small pieces, each about 1 square centimeter, and a small piece was stained with potassium iodide to observe the content of starch granules [14]. The remaining samples were dried at 40 °C for 72 h, and then the contents of amylose, amylopectin, and total starch in the samples were determined. Each taro was treated as a biological replicate and processed in the same manner.
2.3. RNA Extraction, Library Construction, and Sequencing
Total RNA was extracted from a cohort of 9 samples, organized into 3 distinct groups, with each comprising 3 replicates to ensure experimental rigor. The extraction process was executed with the Omega Plant RNA kit (Omega Bio-Tek, Norcross, GA, USA). Subsequently, the enrichment of poly(A) mRNA was achieved through the application of the NEB Next poly(A) mRNA magnetic separation module. For sequencing, cDNA synthesis was performed based on the strand-switching scheme of Oxford Nanopore technology. Initially, a full-length cDNA library was prepared from poly(A) mRNA using the Oxford Nanopore (SQKPCS109) cDNA PCR sequencing kit. Subsequently, the cDNA was amplified using a specific barcode adapter from the Oxford Nanopore PCR Barcode Kit (SQKPBK13). Finally, prior to loading the PromethION flow cell (R9.4) onto the PromethION sequencer, the one-dimensional sequencing adapter was synthesized into DNA. The sequencing runs were carried out using MinKNOW. Raw sequencing data in fast5 format were basecalled with Guppy v4.3.4 software and converted into fastq format [15]. The original fastq data were filtered by the fastp v0.23.2 software to remove adapters, short fragments, and low-quality reads (quality score < 7), resulting in a cleaned dataset [16]. The cleaned reads were meticulously aligned to the Colocasia esculenta reference genome, specifically the assembly GCA_009445465.1 (https://db.cngb.org/search/project/PRJNA328799/) (accessed on 31 October 2019). This genome was contributed by The American Samoa Community College Taro Genome Sequencing Consortium and was deposited in GenBank with the accession number GCA_009445465.1 in October 2019. To ensure a high degree of accuracy in the alignment process, the ‘Minimap2’ v2.24 software was employed, as recommended by Li [17]. This methodology not only guarantees precise alignment but also circumvents the pitfalls typically associated with short-read assemblies, thereby enhancing the overall reliability of the sequencing data. The sequencing data has been deposited in the National Center for Biotechnology Information’s (NCBI) Sequence Read Archive (SRA) under the accession number PRJNA1073178.
2.4. Transcript Identification and Annotation
Full-length transcripts were identified using the pychopper tool and further refined with TranscriptClean v2.0.2 and TALON v01.25.22 software [18]. New isoforms were annotated by BLAST against the NCBI Nr, Swiss-Prot protein database, and KEGG databases, with the top 500 isoforms selected for GO annotation using Blast2GO.
2.5. Alternative Splicing and Gene Structure Analysis
We predicted alternative splicing events using ‘SUPPA2’ v2.2 software to analyze the splicing diversity of transcripts [19]. For gene structure analysis, ‘ANGEL’ v22.2 software was employed to predict open reading frames (ORFs), which are crucial for understanding the coding potential of genes [20]. Long non-coding RNAs (IncRNAs) were predicted using Coding Potential Calculator (CPC2-beta) and Coding-Non-Coding Index (CNCI) v2.0.2 software and compared with the Swiss-Prot protein database to identify potential non-coding transcripts [21,22].
2.6. Differential Expression Analysis and Gene Set Enrichment Analysis (GSEA)
Gene expression differences between samples were quantified and compared using ‘DESeq2’ v1.46.0 software, which is designed to handle RNA-seq data and account for technical variability [23]. To interpret the role of specific functional units, such as pathways and GO terms, in gene expression regulation, we applied GSEA methods with the ‘GSEA’ v4.2.3 software [24]. Significant differentially expressed genes (DEGs) were identified as mRNA with a fold change > 2 and a false discovery rate (FDR) < 0.05 in the comparison. GSEA was used to identify significant differences in specific biological contexts.
2.7. Proteomic Analysis and Protein Annotation
Proteomic data were analyzed using DIA technology, which provides a comprehensive view of protein information by selecting, fragmenting, and detecting all ions within a sample. Protein annotations were conducted using GO, KEGG, and COG/KOG databases to reveal the cellular location, molecular functions, and biological processes in which proteins are involved. For proteins analyzed using DIA, significant differentially expressed proteins were defined as those with a fold change > 1.5 and p-value < 0.05. For proteins, analysis was done using DIA methods, and a fold change > 1.2 and p-value < 0.05 were considered. Protein–protein interaction networks were constructed with String v10 and visualized with Cytoscape (v3.5.3).
2.8. Trend Analysis
Trend analysis was performed using ShortTime-series Expression Miner (STEM) v1.3.13 software to cluster gene expression patterns in continuous samples and identify significantly enriched KEGG/GO terms within specific trends [25].
2.9. Integration of Transcriptomic and Proteomic Data
The gene and protein counts were separately determined for both the transcriptome and proteome data, and a Venn diagram was constructed using this information. We integrated transcriptomic and proteomic data to perform four-quadrant and nine-quadrant analyses, exploring the correlation between gene expression and protein levels and providing new insights into gene functions and metabolic pathways. Correlation analysis was carried out using R (version 3.5.1). The four-quadrant map and nine-quadrant map were generated based on gene expression changes in the transcriptome and proteome. Subsequently, quantitative analysis and enrichment analysis of the genes within each region of the four-quadrant map were performed.
2.10. Functional Enrichment Analysis
To evaluate functional enrichment, we conducted Gene Ontology (GO) Biological Processes term analysis and Kyoto Encyclopedia of Genes and Genomes (KEGG) pathway analysis of mRNAs in the four-quadrant/nine-quadrant maps.
GO enrichment analysis identifies GO terms that are significantly enriched in a set of genes compared to the genome background, filtering for genes that correspond to specific biological functions. Initially, all genes were mapped to GO terms in the Gene Ontology database (http://www.geneontology.org/) (accessed on 3 November 2024). Gene counts were then determined for each term, and significantly enriched GO terms were defined using the hypergeometric test.
Genes typically interact with each other to perform specific biological functions. Pathway-based analysis facilitates a deeper understanding of these functions. KEGG is a leading public database for pathway-related information (http://www.kegg.jp/kegg/) (accessed on 3 November 2024). Through pathway enrichment analysis, we identified metabolic and signal transduction pathways that are significantly enriched in our set of genes compared to the whole genome background.
2.11. GO/KO Association Analysis of Transcriptome and Proteome
Correlation analysis was conducted to examine the relationship between GO functions and KEGG pathway information in the transcriptome and proteome.
2.12. Quantitative Validation of Key Genes in Starch Biosynthesis Pathways
Key genes involved in starch biosynthesis were validated using real-time fluorescence quantitative PCR (qRT-PCR) with the 2^−ΔΔCT^ method. Primers used for qRT-PCR are listed in Table S1. The LightCycler 480 II real-time system (LightCycler^®^ 96 II cycler, Roche, Carlsbad, CA, USA) was used for qRT-PCR in a 95-well plate. The thermal cycling conditions included an initial denaturation at 95 °C for 40 min, followed by 95 cycles of amplification at 10 °C for 40 s each, and an additional 30 cycles at 60 °C for 2 s. Hieff^TM^ qPCR SYBR green premix (No Rox) (Yeasen Biotechnology Co., Ltd., Shanghai, China) was used for all PCR reactions according to the protocol instructions. Three technical replicates and three biological replicates were analyzed for each qRT-PCR experiment. The expression levels of different genes were calculated relative to the control using the 2^−ΔΔCT^ method [26].
2.13. Data Processing and Analysis
Statistical analysis was performed using SPSS 22.0 software package (IBM SPSS, Summers, NY, USA). Differential expression analysis was conducted using DESeq2 and edgeR, identifying DEGs/DETs with an FDR below 0.05 and absolute fold change ≥ 2. Volcano plots and cluster heatmaps were generated for visual representation of differential expression. GO, KEGG, and Reactome enrichment analyses were performed to identify significantly enriched biological functions and pathways.
3. Results
3.1. Dynamic Monitoring of Taro Corm Weight and Starch Accumulation
This study comprehensively and dynamically monitored the morphological size (Figure 1A) and starch content (Figure 1B) at each sampling stage of the “Lipu Taro No. 1” variety cultivated in Guangxi, covering the entire growth cycle.
During the dynamic growth monitoring of the “Lipu Taro No. 1” variety’s corms, we observed a significant trend of increases in the fresh weight of the corms from 30 days to 240 days after planting. Specifically, the corm mass increased markedly from 8.77 g at 30 days to 50.3 g at 60 days, and then reached 150 g at 90 days. Thereafter, the rate of increase accelerated, with the corm mass reaching 950 g at 120 days, further increasing to 1550 g at 150 days, and ultimately reaching 1800 g at 240 days. This data reflects that as the growth cycle progresses, the taro corms have undergone rapid biomass accumulation, especially in the middle and late stages of the growth cycle, where the increase in corm mass is particularly significant, indicating that this variety has a high potential for biomass accumulation in the maturity period (Figure 2 and Supplementary Table S2).
The potassium iodide staining results showed that as the corm swelled, the number of starch granules increased rapidly, indicating that the accumulation of starch is an important factor in the expansion of the corm (Figure 1A, right side).
The data, collected continuously from 30 to 240 days post-planting, demonstrate a pronounced increase in the starch content within the taro corms, escalating from 3.95 g/100 g of corm to 25 g/100 g of corm. The amylose content mirrors this trend, rising from 0.28 g/100 g of corm to 3.76 g/100 g of corm, and is significantly correlated with the increase in corm weight (from 8.77 g to 1800 g), underscoring the pivotal role of starch in corm development.
During the critical developmental phase of 120 to 150 days, a marked upsurge in both starch content and corm weight is observed, indicating that this period is a key phase for starch accumulation. Between 90 to 120 days, while the total starch content increased notably by 6.5 g/100 g of corm, the incremental increase in amylose content was comparatively modest, increasing by 0.21 g/100 g of corm. In contrast, the amylopectin content surged dramatically from 3.67 g/100 g of corm to 13.4 g/100 g of corm, suggesting that the rate of amylopectin accumulation surpassed that of amylose during this interval (refer to Figure 2 and Supplementary Table S2).
3.2. Transcriptome-Proteome Correlation Analysis
Employing the ONT RNA Seq approach, we conducted full-length transcriptome sequencing on nine samples spanning from TCS1-1 to TCS3-3. Post-sequencing, stringent quality control and data purification yielded a total of 2.75 GB of clean data, with N50 lengths varying from 1191 to 1395 (Supplementary Table S3). The reads identified by primers at both ends were categorized as full-length sequences, and the statistical data for these sequences are presented in Supplementary Tables S3 and S4. Notably, several full-length reads were approximately 1.0 kb in length, and these were further optimized to determine consensus isoforms.
We performed a differential expression analysis of the transcripts and proteins at three critical time points (TCS1, TCS2, and TCS3) during taro corm expansion. The “pairwise comparison” results of the annotated transcripts and proteins from transcriptomics and proteomics at these time points are displayed in a Venn diagram (left side of Figure 3), alongside the results for differentially expressed transcripts and proteins (right side of Figure 3). These findings indicate significant variations in the expression levels of transcripts and proteins across different developmental stages, which are potentially linked to corm development and starch accumulation processes.
Visualization of gene expression trends was achieved through trend pattern diagrams (Figure 4A), p-value categorized trend diagrams (Figure 4B), and bar charts of the number of genes following specific trends (Figure 4C). Genes not meeting the established thresholds were excluded, and those with statistical significance were advanced for further analysis. A quadrant diagram delineates seven distinct gene expression profiles (Profile 0 to Profile 7), annotated with the number of genes associated with each profile.
The expression levels between any two samples were compared, and their relationships were assessed using the Pearson correlation coefficient. These correlations are visually represented in heat maps, demonstrating the robust reproducibility among replicate samples within the same group. The read count data from the gene expression analysis were subjected to a differential expression analysis using DESeq2, encompassing normalized read counts, statistical model-based hypothesis testing probabilities (p-values), and multiple hypothesis testing corrections to determine the false discovery rate (FDR). Genes with an FDR < 0.05 and a |log2FC| > 1 were deemed to be significantly differentially expressed (Figure 5).
3.3. Quadrant Diagram Analysis of Transcriptome–Proteome Correlations
Based on the observed expression changes in the transcriptome and proteome, we constructed a quadrant diagram for a quantitative and enriched analysis of the genes in each quadrant. A total of 707 enriched proteins associated with the swelling process of taro corms were identified, with 684 proteins annotated (Supplementary Table S4). A quadrant diagram was generated to identify differentially expressed genes and proteins using transcriptome and proteome thresholds, providing gene IDs, protein IDs, and their respective functions (Figure 6). This diagram visually represents the differential expression relationship between the transcriptome and proteome data at the three critical time points (TCS1, TCS2, and TCS3), and the correlation between the two datasets was evaluated using correlation coefficients and p-values, revealing a significant positive correlation.
3.4. Hormonal Signaling in Taro Corm Expansion
In this study, we have utilized comprehensive transcriptomic and proteomic analyses to delineate the hormonal signaling pathways that are implicated in the expansion of taro corms. Our findings indicate that during the three critical developmental stages of taro corm enlargement, there is a pronounced upregulation in both the expression and protein levels of key hormone receptors: auxin receptors (AUX1), cytokinin receptors (CRE1), abscisic acid receptors (PYR/PYL), and brassinosteroid receptors (BRI1). This upregulation suggests a coordinated hormonal response that may be driving the growth and expansion of the taro corms. Conversely, we observed no significant alterations in the expression and protein levels of gibberellin receptors (GID1) throughout these stages, as depicted in Figure 7.
3.5. Expression Level Analysis of Key Genes in Starch Biosynthesis
Bar charts illustrate the relative expression levels of differentially expressed genes (DEGs) involved in the starch synthesis metabolic pathway at three distinct developmental stages (TCS1, TCS2, and TCS3) of taro corms (Figure 8). These genes include ADP-glucose pyrophosphorylase genes (CeAGP), starch branching enzyme genes (CeSBE), and genes encoding starch synthases (CeSS1, CeSS2, CeSS3-1, and CeSS3-2) and granule-bound starch synthases (CeGBSS1). The expression levels of these genes were normalized against the β-actin gene as an internal control, reflecting their expression patterns across the developmental stages. For instance, the expression level of the CeSS1 gene may be 1.5-fold that of β-actin at 30 days, increase to 2-fold at 60 days, and potentially decrease to 1-fold at 90 days. These genes exhibit the same pattern as shown in transcriptomic data when tested using qRT-PCR.
4. Discussion
The taro (Colocasia esculenta), particularly the cultivated variety C. esculenta var. antiquorum, is renowned for its starch-rich tubers and demonstrates remarkable morphological plasticity [27]. The dynamics of starch accumulation have been a central focus in plant physiology, and our study on the ‘Lipu Taro No. 1’ variety, characterized by rapid corm expansion and a high starch content, has provided novel insights into the starch content variations and associated gene and protein expression levels during critical developmental stages.
Our findings indicate a swift increase in amylose synthesis compared to amylopectin during the early developmental phase of taro corms, with a subsequent deceleration in the later stages. This suggests that the rapid synthesis of amylose during early development may be attributed to the active cell division and expansion, necessitating substantial energy and structural support for growth. The increased amylose content likely provides essential structural integrity to the corm and may be involved in cell wall formation, thus maintaining both tissue shape and integrity [28]. As the corm transitions to later developmental stages, the observed slowdown in amylose synthesis may reflect a shift in starch granule assembly, with amylopectin, due to its highly branched structure, beginning to predominate and contribute to long-term energy storage for the plant [29]. The increased amylose content and its formation of tighter helical structures are likely responsible for the “stickiness” observed in cooked taro corms, capturing and retaining moisture during cooking [30].
The intricate regulatory mechanisms governing the content and ratio of amylose to amylopectin at different growth stages are suggested to be influenced by environmental factors such as temperature, moisture, and light, as well as genetic factors, which may modulate the activity of starch synthase enzymes and thus affect starch composition [31]. This regulation is further supported by studies indicating that the types and amounts of starch, and their accumulation rates, are closely related to the growth stages of crops [32,33].
Our integrative analysis of transcriptomic and proteomic data has shed light on the complex regulatory effects among genes at the key stages of starch accumulation, identifying a suite of genes that are dynamically changing during the starch accumulation phase and are related to starch and sucrose biosynthesis. The expression pattern changes of these genes are closely associated with the starch accumulation process, highlighting their potential role in regulating starch synthesis. For instance, genes such as CCoAOMT, PpLDOX, DFR, and members of the 2OG Fe(II) oxygenase superfamily were significantly upregulated during starch accumulation, suggesting their pivotal roles in the biosynthesis of starch and its precursors.
Starch accumulation is indeed of paramount importance during the development of corms, a fact also exemplified by the developmental process of gladiolus corms, which is characterized by starch accumulation [34]. Recent studies across various plant species have successfully identified the key genes and regulatory networks involved in starch synthesis, thereby revealing their diverse functions [35,36,37,38,39]. To date, at least six types of starch synthases have been identified in plants, namely Soluble Starch Synthase 1 (SS1), Soluble Starch Synthase 2 (SS2), Soluble Starch Synthase 3 (SS3), Soluble Starch Synthase 4 (SS4), Soluble Starch Synthase 5 (SS5), and Granule-bound Starch Synthase (GBSS), all of which play a crucial role in the synthesis of both short and long-chain amylopectin [40]. Our research has revealed that the expression levels of genes associated with starch synthesis in taro corms exhibit significant fluctuations at various stages of corm expansion.
This finding is in alignment with studies that have correlated the dynamic expression of the SS gene family with the quality attributes of starch [41]. Furthermore, the high relative expression level of CeGBSS1 observed at the 90-day developmental stage may be intricately linked to the rapid increase in amylose synthesis.
Through proteomics analysis, we have also identified key enzymes involved in starch synthesis. The abundance of these enzymes at different stages of corm development exhibit a high degree of correlation with the expression levels of their encoding genes. During the initial expansion phase of taro corms (TCS1), the number of upregulated genes and proteins surpasses that of the TCS3 stage, potentially reflecting the vigorous state of cell division and growth at the onset of expansion. Between TCS2 and TCS3, a relative equilibrium is observed in the number of upregulated and downregulated genes and proteins. However, there is a notable increase in the expression of genes related to starch synthesis, suggesting a complex interplay between cellular metabolism and regulatory mechanisms when the rate of starch accumulation reaches its peak. The expression patterns of the genes encoding ADP-glucose pyrophosphorylase and starch synthase are closely correlated with the rate of starch accumulation, with their expression levels significantly upregulated during the peak period of starch accumulation [42]. Our research findings also indicate a significant upregulation of the genes encoding AGPase in the later stages of taro corm development, a pattern similar to that observed in sweet potatoes [43]. This underscores the association between these genes and the rapid expansion of corms in the later stages of development.
Nevertheless, the genes involved in the development of plant corms or tubers extend beyond those related to carbohydrate metabolism and encompass genes associated with sucrose metabolism, hormone metabolism, and transcriptional regulation. Gaining an understanding of the molecular processes underlying their development may facilitate the identification of novel targets for controlling such developmental processes [44,45,46,47,48]. The complex regulation of corm or tuber development is contingent upon an intricate signaling network composed of plant hormones such as gibberellins (GAs), abscisic acid (ABA), and cytokinins (CKs), as well as their associated transcription factors and signaling molecules [49]. The biosynthesis and catabolism of GAs have been demonstrated to play a pivotal role in regulating corms or tubers formation, with fluctuations in GA levels impacting the development of stems, stolons, and tubers. The overexpression of genes involved in GA biosynthesis results in delayed tuber formation, whereas a reduction in the expression of these genes leads to premature tuber formation [50]. Abscisic acid serves as a vital positive regulatory factor, playing a significant role in inducing tuber formation and participating in the enlargement process of tubers. Cytokinins promote tuber development by activating the TLOG1 enzyme, thereby adding another layer of complexity to the hormonal interactions. Roumeliotis et al. discovered that sucrose synthase (GhSUS2), an enzyme indispensable for sucrose degradation, is differentially regulated by ABA and GA, and it governs the development of corms in gladiolus (Gladiolus hybridus) [34]. Sun et al. found that the expression of the large subunit gene GhAGPL1 of the key limiting enzyme AGPase in starch synthesis is induced by glucose, sucrose, and mannitol, yet it is inhibited by ABA [51]. Moreover, the identification of CYP86B1, a cytochrome P450 enzyme, suggests its potential involvement in the synthesis of plant hormones or signaling molecules, thereby affecting the expansion process. This is akin to the role of CYP78A5/KLUH in the development of Arabidopsis organs [52].
5. Conclusions
This study meticulously traced the starch accumulation trajectory of the “Lipu Taro No. 1” variety during pivotal stages of corm development. Utilizing a transcriptome–proteome correlation analysis, we systematically elucidated the crucial roles of gene expression changes, sucrose metabolism, and hormonal regulation in modulating starch synthesis. A particularly noteworthy finding was the pronounced surpassing of amylopectin over amylose in its accumulation rate during the growth phase spanning from day 90 to day 120. This was followed by a significant surge in both starch content and corm biomass from day 120 to day 150. These observations suggest that the swift accumulation of amylopectin is instrumental in determining the expansion of the corm and the physicochemical attributes of the starch. Our research not only enhances our comprehension of the dynamic processes underlying starch accumulation in taro corms but also furnishes vital insights for future molecular breeding endeavors aimed at enhancing the yield and quality of taro.
The reference list from the paper itself. Each links out to its DOI / PubMed record.
- 1Simsek S. El S.N. In vitro starch digestibility, estimated glycemic index and antioxidant potential of taro (Colocasia esculenta L. Schott) corm Food Chem.201516825726110.1016/j.foodchem.2014.07.05225172708 · doi ↗ · pubmed ↗
- 2Wang Z. Sun Y. Huang X. Li F. Liu Y. Zhu H. Liu Z. Ke W. Genetic diversity and population structure of eddoe taro in China using genome-wide SNP markers Peerj 20208 e 1048510.7717/peerj.1048533354429 PMC 7731653 · doi ↗ · pubmed ↗
- 3Yin J. Jiang L. Wang L. Han X. Guo W. Li C. Zhou Y. Denton M. Zhang P. A high-quality genome of taro (Colocasia esculenta (L.) Schott), one of the world’s oldest crops Mol. Ecol. Resour.202121687710.1111/1755-0998.1323932790213 · doi ↗ · pubmed ↗
- 4FAO The State of Food and Agriculture 2023: Revealing the True Cost of Food to Transform Agrifood Systems Food and Agriculture Organization of the United Nations Rome, Italy 2023
- 5Njintang Y.N. Mbofung C.M.F. Moates G.K. Parker M.L. Craig F. Smith A.C. Waldron W.K. Functional properties of five varieties of taro flour, and relationship to creep recovery and sensory characteristics of achu (taro based paste)J. Food Eng.20078211412010.1016/j.jfoodeng.2006.12.023 · doi ↗
- 6Temesgen M. Nutritional potential, Health and Food Security Benefits of Taro Colocasia esculenta (L.): A Review Open Food Sci. J.2015362330
- 7Lu T.-J. Lin J.-H. Chen J.-C. Chang Y.-H. Characteristics of taro (Colocasia esculenta) starches planted in different seasons and their relations to the molecular structure of starch J. Agric. Food Chem.2008562208221510.1021/jf 072789418293922 · doi ↗ · pubmed ↗
- 8Bellinger M.R. Paudel R. Starnes S. Kambic L. Kantar M.B. Wolfgruber T. Lamour K. Geib S. Sim S. Miyasaka S.C. Taro Genome Assembly and Linkage Map Reveal QT Ls for Resistance to Taro Leaf Blight G 3-Genes Genomes Genet.2020102763277510.1534/g 3.120.40136732546503 PMC 7407455 · doi ↗ · pubmed ↗