Hypertensive Diabetic Patients: Casual Pulse Pressure and Ambulatory Blood Pressure Monitoring (ABPM) as Superior Predictors of Future Cardiovascular Events
Inês S Pinheiro, Adriana Pacheco, Simão Carvalho, Tiago Aguiar, José Mesquita Bastos

TL;DR
This study shows that ambulatory blood pressure monitoring better predicts cardiovascular risks in diabetic patients compared to standard methods.
Contribution
The study introduces ABPM as a superior predictor for cardiovascular events in hypertensive diabetic patients.
Findings
Diabetic patients had more severe cardiovascular events, heart failure, and higher mortality rates.
Elevated pulse pressure values in ABPM were linked to worse survival outcomes in diabetic patients.
Resistant hypertension was more common in diabetic patients and associated with poorer survival.
Abstract
Hypertensive (HTN) patients with type 2 diabetes mellitus (T2DM) are at an increased risk of adverse survival outcomes compared to non-diabetic individuals. This study aimed to retrospectively evaluate the prognostic significance of ambulatory blood pressure monitoring (ABPM) in a subgroup of diabetic patients. A total of 823 HTN patients, followed since 1994 at a hospital (follow-up: 11.8 ± 5.6 years), were included in the study. These patients underwent ABPM using a SpaceLabs 90207 device (SpaceLabs Healthcare, Snoqualmie, WA, USA) during a normal working day. Data from both the ABPM and office blood pressure (BP) values, as well as cardiovascular risk factors, were analysed. The patients were divided into two groups: diabetic (n = 240) and non-diabetic (n = 583). Data were analysed using IBM SPSS Statistics for Windows, Version 25 (Released 2017; IBM Corp., Armonk, NY, USA). Our…
Genes, proteins, chemicals, diseases, species, mutations and cell lines named across the full text — each resolved to its canonical identifier and authoritative record.
Click any figure to enlarge with its caption.
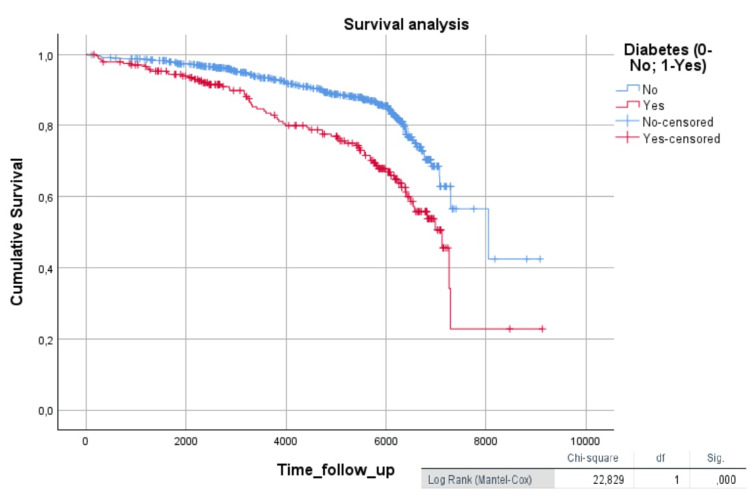 Figure 1
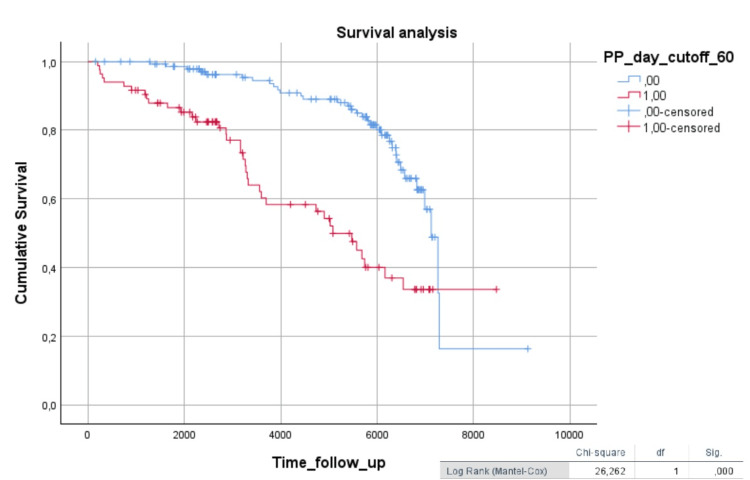 Figure 2
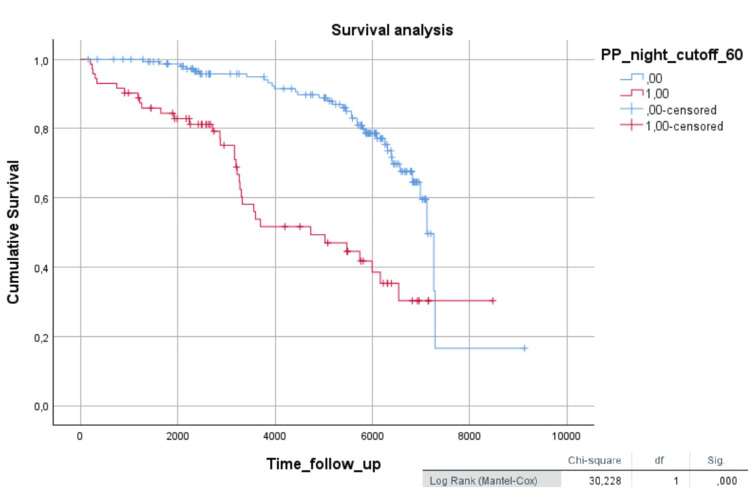 Figure 3
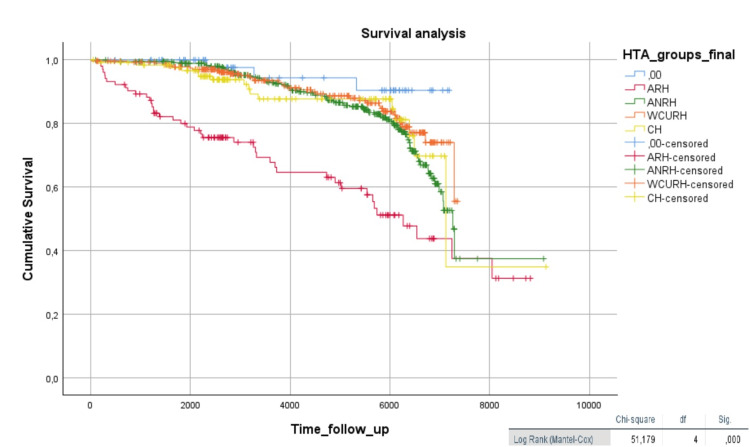 Figure 4
| Diabetic patients | Non-diabetic patients | Student’s t-test, p-value (<0.05) | |
| Age (years) | 61.92 ± 10.37 | 56.64 ± 12.22 | 0.001 |
| Weight (kg) | 80.42 ± 13.798 | 73.73 ± 13.33 | 0.000 |
| BMI (kg/m2) | 29.98 ± 5.269 | 27.33 ± 4.37 | 0.000 |
| DBP casual (mmHg) | 93.98 ± 15.01 | 96.63 ± 14.45 | 0.019 |
| SBP 24h (mmHg) | 134.14 ± 15.70 | 131.65 ± 15.87 | 0.04 |
| DBP 24h (mmHg) | 77.80 ± 10.13 | 80.83 ± 11.09 | 0.000 |
| PP casual (mmHg) | 61.58 ± 19.07 | 57.49 ± 17.61 | 0.003 |
| PP 24h (mmHg) | 56.37 ± 12.21 | 51.02 ± 10.23 | 0.000 |
| Daytime PP (mmHg) | 56.90 ± 12.30 | 51.45 ± 10.52 | 0.000 |
| Nighttime PP (mmHg) | 55.70 ± 13.07 | 50.23 ± 10.50 | 0.000 |
| Diabetic patients | Non-diabetic patients | χ2 | p-value | |
| CV events | 59.30% | 40.70% | 25.34 | <0.001 |
| Heart failure | 67.60% | 32.40% | 27.67 | <0.001 |
| Death | 70.00% | 30.00% | 11.81 | 0.001 |
| HR (95% CI) | Cox regression, p-value (<0.05) | |
| SBP 24h | 1.04 (1.00-1.10) | <0.05 |
| Night SBP | 1.03 (1.00-1.06) | <0.05 |
| Night PP | 1.05 (1.05-1.09) | <0.05 |
| PP 24h >60mmHg | 4.65 (1.26-17.1) | <0.05 |
| Night PP >60mmHg | 6.70 (1.68-26.7) | <0.01 |
Peer Reviews
No public reviews on file for this paper yet. If you reviewed it on a platform where reviews are public (OpenReview, ICLR, NeurIPS, ICML), you can paste yours below so the community can read it here.
Videos
No videos yet. Explain this paper in a talk, walkthrough, or lecture? Add one.
Taxonomy
TopicsBlood Pressure and Hypertension Studies · Heart Rate Variability and Autonomic Control · Cardiovascular Health and Disease Prevention
Introduction
Type 2 diabetes mellitus (T2DM) is a well-established condition associated with an increased risk of developing hypertension (HTN), while HTN is also recognized as a significant risk factor for the development of diabetes [1]. The Framingham Heart Study demonstrated that T2DM is linked to a two- to four-fold increased risk of HTN, peripheral arterial disease, and myocardial infarction. Similarly, the CARDIA (Coronary Artery Risk Development in Young Adults) Study identified HTN as a precursor to diabetes development, emphasizing the bidirectional relationship between these conditions [2,3].
The pathophysiological mechanisms linking HTN and diabetes are predominantly driven by insulin resistance. This process contributes to arterial stiffening, which is associated with elevated systolic blood pressure (SBP) and pulse pressure (PP). Additionally, the maintenance of HTN contributes to vascular remodelling and reduced arterial compliance, which further exacerbates arterial stiffness [4,5].
For instance, a study analysing arterial stiffness indices and glucose metabolism in a biracial cohort of 4,701 individuals aged 45 to 64 revealed that patients with borderline abnormal glucose tolerance or T2DM exhibited greater arterial stiffness compared to those with normal glucose tolerance [6]. These findings propose that elevated glucose and insulin levels may synergistically intensify arterial stiffness, playing a critical role in the early pathophysiology of HTN and cardiovascular disease in T2DM [4,6-9].
Ambulatory blood pressure monitoring (ABPM) is well-established as a superior method for assessing BP variability and provides a more accurate correlation with target organ damage in HTN patients [10]. In diabetic populations, however, significant gaps remain in understanding how ABPM findings can guide clinical interventions and predict outcomes.
This study aimed to longitudinally and retrospectively evaluate the prognostic significance of ABPM in a subgroup of diabetic patients, addressing the need for more targeted research in this area. By investigating the role of ABPM in this context, the study seeks to provide a deeper understanding of BP dynamics and their implications for managing HTN and reducing cardiovascular risk in individuals with T2DM.
Materials and methods
Study population
This study included a cohort of 823 patients with HTN who had been followed since 1994 at a hospital. The time of follow-up was 11.8 ± 5.6 years. The inclusion criteria encompassed patients with confirmed HTN who had undergone ABPM. Those who had not undergone ABPM or whose HTN diagnosis was not confirmed during the consultation were excluded.
ABPM
ABPM was conducted using the Spacelabs 90207 (SpaceLabs Healthcare, Snoqualmie, WA, USA) device, and its accuracy was validated by previous studies [11,12]. BP measurements were recorded over a 24-hour period on a typical working day. Patients were instructed to maintain their regular daily activities during the monitoring period. The nighttime period was self-reported by patients in a sleep diary and subsequently validated during the interpretation of the results.
Office BP measurements
In addition to ABPM, office BP values were recorded during routine clinical visits. Both systolic and diastolic BP readings were taken according to established guidelines [13], ensuring proper cuff size, patient positioning, and resting time prior to measurement.
Additional clinical data collected
Other clinical characteristics were also collected, such as age, weight, body mass index (BMI), and comorbidities, including dyslipidemia, previous cardiovascular events, heart failure, and mortality.
Group classification
The patients were stratified into two primary groups based on comorbidity status: diabetic and non-diabetic. Further subgroup phenotypes were defined based on BP control and treatment response as follows: (i) resistant hypertension (RH) (n = 103), defined as BP ≥130/80 mmHg over 24 hours on ABPM, despite treatment with three or more anti-HTN medications at maximum tolerated doses, including a diuretic; (ii) non-resistant hypertension (NRH) (n = 375), patients on three or more anti-HTN medications at maximum tolerated doses, including a diuretic, who met RH criteria in office BP but not on ABPM; (iii) white coat resistant hypertension (WCRH) (n = 284), patients with office BP readings meeting HTN criteria but normal values on ABPM; (iv) controlled hypertension (CH) (n = 106), patients whose BP was controlled with two anti-HTN medications in both office and ABPM measurements.
Statistical analysis
Data were analysed using IBM SPSS Statistics for Windows, Version 25 (Released 2017; IBM Corp., Armonk, NY, USA). For continuous variables with normal distribution, parametric tests, including the Independent Samples t-test, were applied. Non-parametric variables were analysed using the Chi-square test. Survival analysis was performed using Kaplan-Meier event-free survival curves to evaluate outcomes over time. Additionally, univariate and multivariate Cox regression analyses were conducted to identify predictors of adverse events and to evaluate the impact of clinical and demographic variables on outcomes.
Results
The subgroup of diabetic HTN patients consisted of 240 patients, with an average age of 61.2 ± 10.3 years, 45.4% of whom were female. In the non-diabetic group (n = 583), the average age was 56.6 ± 12.2 years, with 49.3% being female.
Diabetic patients had a worse Kaplan-Meier hypertensive event-free survival curve compared to non-diabetic patients (log-rank = 22.9, p < 0.001) (Figure 1).
Kaplan-Meier survival curve comparing diabetic patients to non-diabetic patientsThe Kaplan-Meier curve graphically represents the survival function (time until death or the occurrence of a cardiovascular event). Time is plotted on the x-axis, and the survival rate is plotted on the y-axis.
In the exploratory analysis of the two groups (diabetic vs. non-diabetic), using a Student’s t-test, statistically significant differences were found in age, weight, BMI, casual diastolic blood pressure (DBP), 24-hour SBP, and 24-hour DBP. The PP for both casual measurements and ABPM during the daytime and nighttime also showed statistical significance between the two groups, with diabetic patients having higher values (p < 0.05) (Table 1).
Diabetic patients also had a higher prevalence of previous cardiovascular events (χ² = 25.34, p < 0.001), heart failure (χ² = 27.7, p < 0.001), and mortality (χ² = 11.8, p < 0.01) (Table 2).
In the Kaplan-Meier survival analysis, diabetic patients with 24-hour PP values above 60 mmHg (Figure 2) and nighttime PP values above 60 mmHg (Figure 3) showed worse survival (log-rank = 26.2, p < 0.001; log-rank = 30.2, p < 0.001, respectively).
Kaplan-Meier survival analysis in diabetic patients, comparing 24-hour PP (cutoff 60 mmHg)The Kaplan-Meier curve graphically represents the survival function (time until death or the time of a cardiovascular event). Time is plotted on the x-axis, and the survival rate is plotted on the y-axis.PP: Pulse Pressure
Kaplan-Meier survival analysis in diabetic patients, comparing nighttime PP (cutoff 60 mmHg)The Kaplan-Meier curve graphically represents the survival function (time until death or the time of a cardiovascular event). Time is plotted on the x-axis, and the survival rate is plotted on the y-axis.PP: Pulse Pressure
In the multivariate Cox analysis, adjusted for confounding variables (age, weight, sex, casual SBP, casual PP, dyslipidemia, and previous cardiovascular events), the 24-hour SBP, nighttime SBP, nighttime PP, 24-hour PP with a cut-off >60 mmHg, and nighttime PP with a cut-off >60 mmHg were significant negative predictive independent factors for the occurrence of an event (Table 3).
In the analysis of HTN phenotypes (RH, NRH, WCRH, and CH), the presence of RH was significantly higher in the diabetic group (χ² = 8.14, p < 0.05). It is worth noting that, in the analysis of the total sample (n = 823), patients with RH exhibited worse survival compared to the other groups (log-rank = 51.2, p < 0.001) (Figure 4).
Kaplan-Meier analysis of hypertension phenotypesThe Kaplan-Meier curve graphically represents the survival function (time until death or the time of a cardiovascular event). Time is plotted on the x-axis, and the survival rate is plotted on the y-axis.RH: Resistant Hypertension; NRH: Non-resistant Hypertension; WCRH: White Coat Resistant Hypertension; CH: Controlled Hypertension
Discussion
Our results showed that HTN patients with T2DM experience worse survival outcomes compared to non-diabetic patients. Furthermore, patients with T2DM more commonly present with RH, which is associated with poorer survival [14].
Also, the findings of this study reinforce the prognostic value of PP, particularly as measured through ABPM, in patients with HTN and T2DM. Elevated PP values (analysed either as a continuous variable or using a 60-mmHg cut-off within ABPM values), especially during the nighttime period, were associated with worse cardiovascular outcomes. In the literature, high PP is associated with an increased risk of death, cardiovascular events, stroke, chronic kidney disease, and retinopathy [15,16]. The reason why nighttime PP is an independent predictor of total mortality remains unknown, but there are other studies that have had similar results [17].
The literature further mentions that, in diabetic patients, PP has a predictive value for the occurrence of cardiovascular events, and PP >60 mmHg in elderly diabetic patients may increase the risk of cardiovascular events [9,18,19].
These results underscore the importance of incorporating PP into cardiovascular risk assessment for these patients, particularly in high-risk subgroups, such as those with RH.
Moreover, the results highlight that ABPM not only improves BP evaluation in diabetic patients but also provides more accurate insights into circadian PP patterns, which may assist in tailoring therapeutic strategies. Recent studies suggest that specific interventions, such as the use of SGLT2 inhibitors, can significantly reduce BP, offering additional cardiovascular benefits [20]. For instance, empagliflozin has demonstrated the ability to lower 24-hour PP, comparable to conventional anti-HTN therapies, while also reducing the risk of heart failure and cardiovascular mortality [21,22]. In the future, studies may be conducted to evaluate the impact of these drugs on ABPM.
It is noteworthy, however, that gaps remain in the literature regarding the impact of various antidiabetic regimens on BP and PP. Future studies should explore the interplay between glucose levels, insulin resistance, and arterial stiffness to identify more effective therapeutic strategies for preventing cardiovascular events in T2DM patients.
Finally, this study emphasizes the necessity of a multidisciplinary approach to managing these patients, combining pharmacological and non-pharmacological interventions to optimize cardiovascular outcomes.
It is important to take into consideration the limitations of this study: it is a retrospective study with a sample from a single hospital, and other variables could have been assessed, such as other comorbidities.
Conclusions
The findings highlight the increased risk of poorer survival outcomes in HTN patients with T2DM, particularly those with RH. These results emphasize the need for targeted interventions to improve patient prognosis.
Furthermore, to our knowledge, there are currently no studies in the literature using ABPM data specifically in diabetic patients, which could provide valuable insights into the BP patterns of these patients and help define the best therapeutic strategies.
The reference list from the paper itself. Each links out to its DOI / PubMed record.
- 1Hypertension in diabetes: an update of basic mechanisms and clinical disease Hypertension Jia G Sowers JR 119712057820213460196010.1161/HYPERTENSIONAHA.121.17981 PMC 8516748 · doi ↗ · pubmed ↗
- 2Blood pressure and the risk of developing diabetes in African Americans and Whites: ARIC, CARDIA, and the Framingham heart study Diabetes Care Wei GS Coady SA Goff DC Jr 8738793420112134618010.2337/dc 10-1786 PMC 3064044 · doi ↗ · pubmed ↗
- 3Cardiovascular disease risk factors, type 2 diabetes mellitus, and the Framingham heart study Trends Cardiovasc Med Fox CS 90952020102113095210.1016/j.tcm.2010.08.001PMC 3033760 · doi ↗ · pubmed ↗
- 4Arterial stiffness and hypertension Clin Hypertens Kim HL 312920233803715310.1186/s 40885-023-00258-1PMC 10691097 · doi ↗ · pubmed ↗
- 5Arterial stiffness and hypertension Clin Hypertens Oh YS 172420183051948510.1186/s 40885-018-0102-8PMC 6271566 · doi ↗ · pubmed ↗
- 6Non-insulin-dependent diabetes mellitus and fasting glucose and insulin concentrations are associated with arterial stiffness indexes: the ARIC study Circulation Salomaa V Riley W Kark JD Nardo C Folsom AR 14321443911995786718410.1161/01.cir.91.5.1432 · doi ↗ · pubmed ↗
- 7Diabetes mellitus and vascular disease Hypertension Sowers JR 9439476120132359513910.1161/HYPERTENSIONAHA.111.00612 PMC 3648858 · doi ↗ · pubmed ↗
- 8Diabetes, hypertension, and cardiovascular disease: clinical insights and vascular mechanisms Can J Cardiol Petrie JR Guzik TJ Touyz RM 5755843420182945923910.1016/j.cjca.2017.12.005PMC 5953551 · doi ↗ · pubmed ↗