Comparison of 13-, 15- and 20-valent pneumococcal conjugate vaccines in the paediatric Canadian population: A cost-utility analysis
Alison E Simmons, Gebremedhin B Gebretekle, Robert Pless, Aleksandra Wierzbowski, Matthew Tunis, Ashleigh R Tuite

TL;DR
This study compares the cost-effectiveness of three pneumococcal vaccines in Canadian children, finding that newer vaccines may offer better value if they reduce disease spread significantly.
Contribution
The study evaluates the cost-utility of new pneumococcal vaccines in Canada, considering both direct and indirect effects on disease burden.
Findings
Pneu-C-20 and Pneu-C-15 are projected to reduce pneumococcal disease burden compared to Pneu-C-13.
Cost-effectiveness of Pneu-C-15 and Pneu-C-20 depends on the magnitude of indirect vaccine effects.
ICERs for Pneu-C-20 and Pneu-C-15 fall below $30,000 per QALY gained with sufficient indirect effects.
Abstract
Two pneumococcal conjugate vaccines, covering 15 and 20 Streptococcus pneumoniae serotypes (Pneu-C-15 and Pneu-C-20, respectively), were recently approved for use in the Canadian paediatric population. To assess the cost-effectiveness of Pneu-C-15 and Pneu-C-20 in unvaccinated infants initiating routine pneumococcal vaccination, compared to the currently used 13-valent conjugate vaccine (Pneu-C-13). A static cohort model was used to estimate sequential incremental cost-effectiveness ratios (ICERs in 2022 Canadian dollars per quality-adjusted life year [QALY]) of Pneu-C-13, Pneu-C-15 and Pneu-C-20 in the paediatric population starting their primary series. Costs and outcomes were calculated over a 10-year time horizon at the program level and a lifetime time horizon at the individual level and discounted at a rate of 1.5% per year. We explored the impact of uncertainties in model…
Genes, proteins, chemicals, diseases, species, mutations and cell lines named across the full text — each resolved to its canonical identifier and authoritative record.
Click any figure to enlarge with its caption.
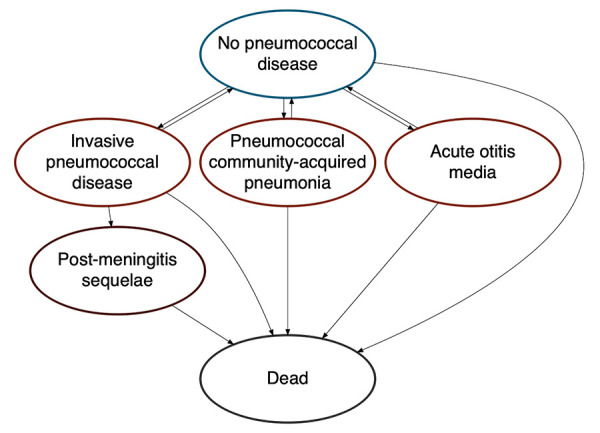 Figure 1
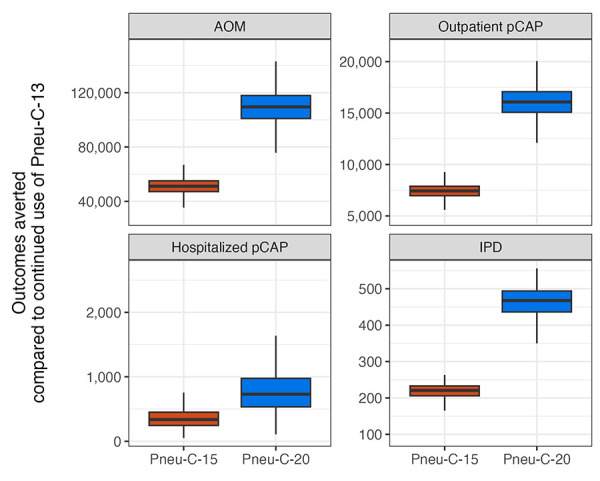 Figure 2
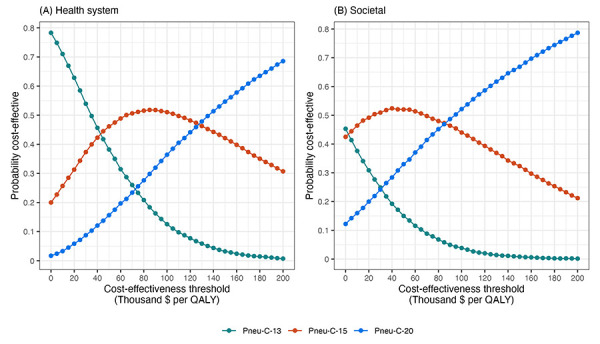 Figure 3
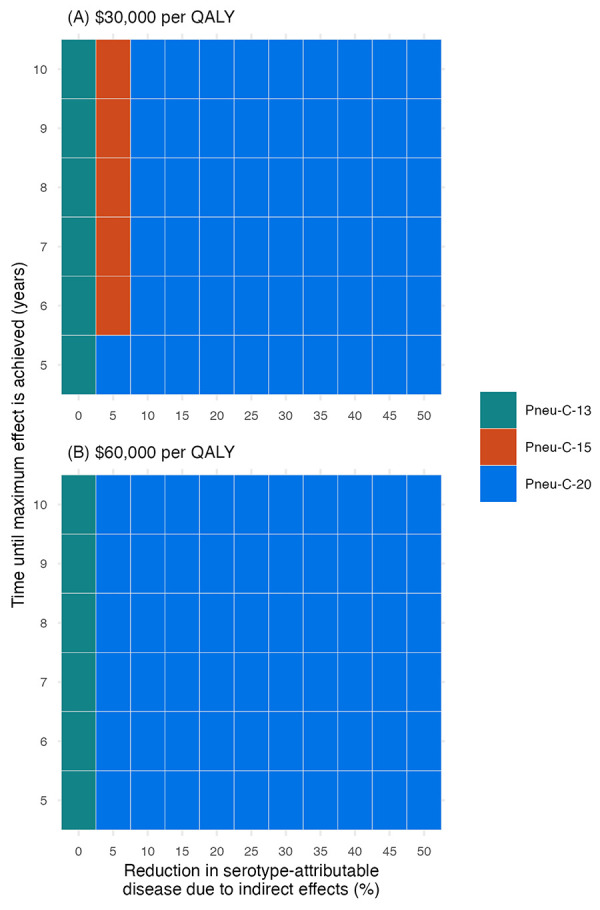 Figure 4
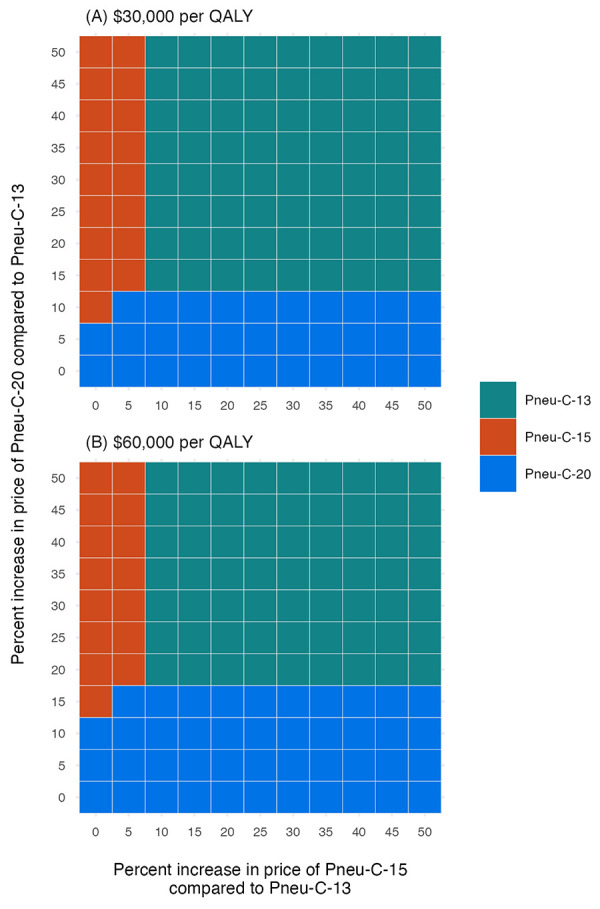 Figure 5
| Parameter | Base | Range | Reference(s) |
|---|---|---|---|
|
| |||
| Younger than 2 years | 14.5 | - | CNDSS, 2019; ICS program, 2019 (( |
| 2–4 years | 10.2 | - | |
| 5–17 years | 2.1 | - | |
| 18–49 years | 5.2 | - | |
| 50–64 years | 13.6 | - | |
| 65 years and older | 23.8 | - | |
|
| |||
| Younger than 5 years | 4,991.1 | - | Nasreen |
| 5–17 years | 1,249.0 | - | |
| 18–39 years | 815.9 | - | |
| 40–64 years | 1,529.9 | - | |
| 65–74 years | 3,095.7 | - | |
| 75–84 years | 5,398.1 | - | |
| 85 years and older | 10,122.7 | - | |
|
| |||
| Younger than 5 years | 25,467.6 | - | Nasreen |
| 5–17 years | 7,225.9 | - | |
| 18–39 years | 2,204.4 | - | |
| 40–64 years | 2,058.6 | - | |
| 65–74 years | 1,954.7 | - | |
| 75–84 years | 1,857.4 | - | |
| 85 years and older | 1,621.4 | - | |
|
| |||
| Younger than 2 years | 6.8 | - | CNDSS, 2019; ICS program, 2015–2019 (( |
| 2–4 years | 0.9 | - | |
| 5–17 years | 3.9 | - | |
| 18–49 years | 2.1 | - | |
| 50–64 years | 2.1 | - | |
| 65 years and older | 2.4 | - | |
|
| |||
| Younger than 1 year | 6.0 | 5.1–9.1 | King, 2023; LeBlanc |
| 1–15 years | 12.0 | 10.1–18.2 | |
| 16–49 years | 19.5 | 17.3–21.7 | |
| 50–64 years | 19.0 | 17.3–20.7 | |
| 65 years and older | 11.2 | 10.4–12.1 | |
|
| |||
| Younger than 18 years | 17 | 14–22 | Kim |
|
| |||
| Younger than 65 years | 4.6 | 2.2–9.3 | O’Reilly |
| 65 years and older | 12.3 | 7.9–18.6 | |
|
| |||
| Younger than 1 year | 16.9 | 13.3–21.1 | Morrow |
| 1–4 years | 4.6 | 3.0–6.8 | |
| 5–9 years | 8.7 | 4.1–15.9 | |
| 10–19 years | 8.5 | 5.1–13.3 | |
| 20–64 years | 5.1 | 3.9–6.4 | |
| 65 years and older | 3.1 | 2.2–4.1 | |
|
| |||
| Neurologic sequelae | 12.2 | 5.3–19.1 | Jit, 2010 (( |
| Hearing loss | 8.2 | 4.5–11.9 | |
|
| |||
| Younger than 10 years | 6 | 4–12 | Canadian Institute for Health Information, 2020; Chuck |
|
| |||
| Younger than 1 year | 11.8 | 11.2–12.3 | Wijayasri |
| 1–4 years | 1.6 | 0.8–2.7 | |
| 5–49 years | 5.7 | 4.9–6.7 | |
| 50–64 years | 10.9 | 9.9–12 | |
| 65 years and older | 17.2 | 16.2–18.3 | |
|
| |||
| Younger than 10 years | 1.0 | 0.3–3.1 | LeBlanc |
| 10–15 years | 1.6 | 0.6–4.3 | |
| 16–49 years | 3.8 | 1.7–7.0 | |
| 50–64 years | 4.8 | 2.7–7.1 | |
| 65 years and older | 9.9 | 7.7–12.3 | |
|
| |||
| ST3 | 8 | - | National Microbiology Laboratory, 2019 (( |
| Pneu-C-13/non-ST3 | 9 | - | |
| Pneu-C-15/non-Pneu-C-13 | 21 | - | |
| Pneu-C-20/non-Pneu-C-15 | 19 | - | |
| NVT | 43 | - | |
|
| |||
| ST3 | 11 | - | National Microbiology Laboratory, 2019 (( |
| Pneu-C-13/non-ST3 | 16 | - | |
| Pneu-C-15/non-Pneu-C-13 | 16 | - | |
| Pneu-C-20/non-Pneu-C-15 | 23 | - | |
| NVT | 33 | - | |
|
| |||
| ST3 | 8 | - | National Microbiology Laboratory, 2019 (( |
| Pneu-C-13/non-ST3 | 23 | - | |
| Pneu-C-15/non-Pneu-C-13 | 20 | - | |
| Pneu-C-20/non-Pneu-C-15 | 14 | - | |
| NVT | 35 | - | |
|
| |||
| ST3 | 10 | - | National Microbiology Laboratory, 2019 (( |
| Pneu-C-13/non-ST3 | 32 | - | |
| Pneu-C-15/non-Pneu-C-13 | 11 | - | |
| Pneu-C-20/non-Pneu-C-15 | 21 | - | |
| NVT | 26 | - | |
|
| |||
| ST3 | 12 | - | National Microbiology Laboratory, 2019 (( |
| Pneu-C-13/non-ST3 | 32 | - | |
| Pneu-C-15/non-Pneu-C-13 | 11 | - | |
| Pneu-C-20/non-Pneu-C-15 | 21 | - | |
| NVT | 26 | - | |
|
| |||
| ST3 | 13 | - | National Microbiology Laboratory, 2019 (( |
| Pneu-C-13/non-ST3 | 16 | - | |
| Pneu-C-15/non-Pneu-C-13 | 15 | - | |
| Pneu-C-20/non-Pneu-C-15 | 14 | - | |
| NVT | 42 | - | |
| Parameter | Base | Range | Reference(s) |
|---|---|---|---|
|
| |||
| 2 doses | 87 | - | Assumptiona |
| 2+1 doses | 84.5 | - | Childhood National Immunization Coverage Survey (cNICS), 2022 (( |
|
| |||
| VT-IPD | 85 | 67–96 | Farrar |
| ST3-IPD | 33 | 10–66 | Farrar |
| VT-pCAP | 64 | 50–72 | Prasad |
| ST3-pCAP | 25 | 19–28 | Assumption (based on IPD) |
| VT-AOM | 54 | 40–64 | Eskola, 2001 (( |
| ST3-AOM | 21 | 15–25 | Assumption (based on IPD) |
|
| |||
| % of VE achieved with first 2 doses of series | 75 | 60–90 | Andrews |
|
| |||
| Pneu-C | 15 years: stable for 5 years, linear decline to 0 over 10 years | - | Prasad |
| Parameter | Base ($) | Range ($) | Reference(s) |
|---|---|---|---|
|
| |||
| Vaccine administration | 16.77 | 12.58–20.96 | O’Reilly |
| Pneu-C-13 | 71.5 | - | Centers for Disease Control and Prevention; Assumption (( |
| Pneu-C-15 | 78.1 (9.2% higher than Pneu-C-13) | 72.2–87.9 (1%–23% higher than Pneu-C-13) | |
| Pneu-C-20 | 90.1 (26.1% higher than Pneu-C-13) | 78.6–107.2 (10%–50% higher than Pneu-C-13) | |
|
| |||
| Younger than 5 years | 20,468 | 17,422–23,755 | Discharge Abstract Database, 2015–2019 (( |
| 5–17 years | 14,717 | 12,510–17,100 | |
| 18–49 years | 28,812 | 26,559–31,155 | |
| 50–64 years | 29,146 | 27,363–30,984 | |
| 65–74 years | 28,955 | 26,727–31,271 | |
| 75 years and older | 21,501 | 20,001–23,054 | |
|
| |||
| Younger than 18 years | 7,345 | 7,189–7,545 | O’Reilly |
| 18–64 years | 14,185 | 13,708–14,686 | |
| 65 years and older | 14,179 | 13,931–14,433 | |
|
| |||
| Younger than 18 years | 450 | 438–461 | O’Reilly |
| 18–64 years | 1,187 | 1,154–1,221 | |
| 65 years and older | 3,343 | 3,283–3,400 | |
|
| |||
| Younger than 2 years | 260 | 258–301 | Gaboury |
| 2–9 years | 178 | 148–207 | |
| Cost of surgery for ear tube placement | 1,790 | 1,340–2,240a | Canadian Institute for Health Information, 2020 (( |
|
| |||
| Annual cost of care for those with auditory sequelae | 2,783.3 | 2,087.5–3,479.2a | Christensen |
| Annual cost of care for those with neurologic sequelae | 9,262.4 | 6,946.8–11,578.0a | |
|
| |||
| Medication, younger than 65 years | 18.1 | 13.6–22.6 | American Academy of Pediatrics, 2021; Metlay |
| Transportation to inpatient care | 139 | 29–333 | Canada Revenue Agency, 2022; Colbert, 2020; Discharge Abstract Database, 2015–2019 (( |
| Transportation to outpatient care | 3.7 | 2.8–4.6a | Canada Revenue Agency, 2022; Pong and Pitblado, 2005 (( |
|
| |||
| Inpatient case | 1.8 | - | NACI (( |
| Outpatient case | 1.2 | - | |
| Travel for outpatient case | 33 | - | |
|
| |||
| Inpatient IPD or pCAP | 15 | 9–29 | Pasquale |
| Outpatient pCAP | 5.4 | 1.8–6.3 | |
|
| |||
| Auditory sequelae | 25 | 15–35 | Bizier |
| Neurologic sequelae | 98 | 75–100 | Jiang |
|
| |||
| Younger than 5 years | 11.2 | 9.4–13.0 | Discharge Abstract Database, 2015–2019 (( |
| 5–15 years | 9.9 | 7.8–12.0 | |
| 16 years and older | 5.4 | 1.5–10.8 | Wyrwich |
|
| |||
| Younger than 5 years | 4.2 | 4.2–4.3 | Discharge Abstract Database, 2015–2019 (( |
| 5–15 years | 5.0 | 7.8–12.0 | |
| 16 years and older | 5.4 | 1.5–10.8 | Wyrwich |
|
| |||
| Younger than 16 years | 5.4 | 1.8–6.3 | Pasquale |
| 16 years and older | 1.1 | 1.0–1.2 | Dubé |
|
| |||
| AOM | 1.3 | 0.8–1.7 | Barber |
| Ear tube placement | 2.1 | - | Petit |
|
| |||
| Auditory sequelae (annual) | 0 | - | Assumption |
| Neurologic sequelae (annual) | 190 | 146–240a | Ganapathy |
|
| |||
| Visit healthcare provider for vaccination | 0.5 | - | Assumption |
|
| |||
| Age 16 years and older | Age-specific values | - | Statistics Canada (( |
| Caregiver | 58,811 | - | |
|
| |||
| Age 16 years and older | Age-specific values | - | Statistics Canada (( |
| Caregiver (age 25–54 years) | 87 | - | |
| Parameter | Base | Range | Reference(s) |
|---|---|---|---|
|
| |||
| Younger than 6 years | 0.97 | 0.96–0.98 | Molina |
| 6–11 years | 0.95 | 0.94–0.96 | Molina |
| 12–17 years | 0.89 | 0.87–0.91 | Yan |
| 18–24 years | 0.879 | 0.863–0.895 | |
| 25–34 years | 0.881 | 0.864–0.898 | |
| 35–44 years | 0.878 | 0.863–0.893 | |
| 45–54 years | 0.855 | 0.838–0.872 | |
| 55–64 years | 0.839 | 0.822–0.856 | |
| 65–74 years | 0.867 | 0.849–0.885 | |
| 75 years and older | 0.861 | 0.835–0.887 | |
|
| |||
| Younger than 19 years | 0.028 | 0.0165–0.0308 | Tang |
| 19–64 years | 0.0533 | 0.0425–0.0547 | |
| 65 years and older | 0.0745 | 0.0001–0.0745 | |
|
| |||
| Younger than 19 years | 0.0004 | 0.0001–0.0329 | Tang |
| 19–64 years | 0.0094 | 0.0001–0.0205 | |
| 65 years and older | 0.0586 | 0.0271–0.0659 | |
|
| |||
| Younger than 19 years | 0.0105 | 0.001–0.0155 | Tang |
| 19–64 years | 0.0396 | 0.0001–0.168 | |
| 65 years and older | 0.1154 | 0.0068–0.29 | |
|
| |||
| Younger than 10 years | 0.0016 | 0–0.1461 | Tang |
|
| |||
| Younger than 19 years | 0.2137 | 0.07–0.72 | Tang |
| 19 years and older | 0.365 | 0.273–0.418 | Tang |
|
| |||
| Younger than 19 years | 0.2456 | 0.16–0.49 | Tang |
| 19 years and older | 0.5278 | 0.22–0.783 | Tang |
| Strategy | Effect | Cost | Sequential ICER |
|---|---|---|---|
|
| |||
| Pneu-C-13 | 229,769 | 4,945 | - |
| Pneu-C-15 | 229,272 | 4,975 | 58,823 |
| Pneu-C-20 | 228,730 | 5,048 | 135,289 |
|
| |||
| Pneu-C-13 | 229,769 | 432,243 | - |
| Pneu-C-15 | 229,272 | 432,252 | 18,272 |
| Pneu-C-20 | 228,730 | 432,303 | 93,416 |
Peer Reviews
No public reviews on file for this paper yet. If you reviewed it on a platform where reviews are public (OpenReview, ICLR, NeurIPS, ICML), you can paste yours below so the community can read it here.
Videos
No videos yet. Explain this paper in a talk, walkthrough, or lecture? Add one.
Taxonomy
TopicsPneumonia and Respiratory Infections · Bacterial Infections and Vaccines · Gastroesophageal reflux and treatments
Introduction
Pneumococcal disease (PD), caused by Streptococcus pneumoniae, causes significant global morbidity and mortality, particularly in children, older adults and people with immunocompromising conditions. Although S. pneumoniae frequently colonizes the human nasopharynx without causing illness, it can cause severe invasive (e.g., meningitis and bacteremia) and, more commonly, non-invasive (e.g., pneumococcal community acquired pneumonia [pCAP] and acute otitis media [AOM]) disease ((1)). More than 100 distinct capsular types, or serotypes, of S. pneumoniae have been identified, but the majority of invasive pneumococcal disease (IPD) cases are attributed to a subset of these serotypes ((2,3)).
Infectious disease modelling is often used to support pneumococcal vaccine decisions due to complex serotype dynamics observed over years under previous vaccination schedules. In the early 2000s, the first pneumococcal conjugate vaccines (Pneu-C-7 and Pneu-C-10) were authorized for use in Canada and were provided in publicly funded immunization programs. In 2009, Pneu-C-13 vaccine received approval and in 2010, Canada’s National Advisory Committee on Immunization (NACI) recommended that healthy children receive 2+1 doses of Pneu-C-13 at two, four and 12–15 months of age or 3+1 doses of Pneu-C-13 at two, four, six and 12–18 months of age ((4)). The Pneu-C-13 vaccine consists of serotypes 1, 3, 4, 5, 6A, 6B, 7F, 9V, 14, 18C, 19A, 19F and 23F. Two pneumococcal conjugate vaccines, covering 15 and 20 S. pneumoniae serotypes, were authorized by Health Canada for use in paediatric populations on July 8, 2022 (Pneu-C-15) and July 21, 2023 (Pneu-C-20). The Pneu-C-15 vaccine includes Pneu-C-13 serotypes as well as serotypes 22F and 33F, and Pneu-C-20 includes Pneu-C-13 serotypes as well as serotypes 8, 10A, 11A, 12F, 15B, 22F and 33F ((5,6)).
Following the introduction of Pneu-C-13, the incidence of IPD caused by the 13 S. pneumoniae serotypes included in the vaccine decreased across all age groups ((7–9)); however, overall IPD incidence remained relatively unchanged across all age groups due to S. pneumoniae serotype replacement as well as persistence of some Pneu-C-13 serotypes ((10,11)). Between 2016 and 2020, a significant increase in IPD caused by serotypes 19F and 11A was observed among children younger than five years old in Canada ((12)). Serotype 19F is included in Pneu-C-13, Pneu-C-15 and Pneu-C-20, and serotype 11A is included only in Pneu-C-20.
Given the broader serotype coverage provided by Pneu-C-15 and Pneu-C-20, we conducted a model-based economic evaluation to assess the cost-effectiveness of their use in the Canadian paediatric population compared to the current standard of care.
Methods
We developed a static Markov cohort model to quantify the health impact of three paediatric pneumococcal vaccination strategies in previously unvaccinated infants. We compared 2+1 doses of Pneu-C-13 (current policy), Pneu-C-15 and Pneu-C-20. *Streptococcus pneumoniae-*associated health outcomes from the cohort model were used to inform a cost-utility analysis. Outcomes included the incidence of IPD, non-invasive pCAP and AOM, hospitalizations, deaths, costs, quality-adjusted life years (QALYs) and incremental cost-effectiveness ratios (ICERs). At the time of the analysis, NACI had not yet published recommendations for the use of Pneu-C-15 and Pneu-C-20 in the paediatric population. This economic analysis was conducted to support the development of NACI’s recommendations and additional details of the economic evidence considered are available online ((13)).
Model structure
Our model followed a multi-age, open population cohort over 10 years. Birth and death rates within the cohort were informed by Canadian population projections ((14–16)). Individuals were free of PD at model entry, but could develop IPD, pCAP and AOM over their lifetime (Figure 1, Table 1). A subset of individuals with IPD developed post-meningitis sequelae. We assumed IPD was treated in an inpatient setting, pCAP was treated in an inpatient or outpatient setting and AOM was treated in an outpatient setting. Incidence, costs and health consequences of AOM were restricted to individuals younger than 10 years of age ((17)).
Pneumococcal disease model health statesa,ba Vaccinated and unvaccinated people experienced the same health states, with risk modified based on vaccination status, type of vaccine received and time since vaccinationb Post-meningitis sequelae include auditory and neurologic sequelae
Upon model entry, a proportion of each birth cohort was vaccinated at two, four and 12 months of age, based on estimated Pneu-C-13 vaccination coverage (Table 2) ((28)). Vaccination was assumed to reduce the risk of PD caused by the serotypes included in the vaccine. We assumed vaccine effectiveness (VE) for Pneu-C-15 and Pneu-C-20 was equivalent to VE for Pneu-C-13. All vaccines had a lower VE against serotype 3 compared to the other vaccine serotypes. In the model, vaccine-derived protection began after the second dose and waned over 15 years ((29)). The base case model did not include indirect effects of vaccination including herd immunity and serotype replacement.
Cost-utility analysis
We used the outputs from our model to inform a cost-utility analysis of the three vaccination strategies over a 10-year programmatic time horizon. A lifetime time horizon was used at the individual level (i.e., all long-term consequences of PD accrued over an individual’s lifetime were included). The assumed cost per dose in our base case was 78.10 for Pneu-C-15 and $90.10 for Pneu-C-20 (Table 3). An unpublished analysis conducted by the Public Health Agency of Canada found that Canadian negotiated vaccine prices across all vaccine programs are typically 30%–50% of United States contract prices; we applied a 40% discount rate to the United States’ Centers for Disease Control and Prevention public vaccine prices to estimate the cost per dose in our base case ((34)). Costs and utilities were derived preferentially from Canadian surveillance data and published studies, and by assumption (Table 3, Table 4). We applied a discount rate of 1.5% to QALYs and costs, with costs inflated to 2022 Canadian dollars ((35)). Probabilistic model estimates were based on 10,000 simulations. For each model simulation, parameters were drawn from distributions and results were calculated for each scenario; summary results across the 10,000 simulations were computed. Values with ranges provided in Tables 1-4 indicate model parameters that were sampled probabilistically to capture uncertainty (i.e., sampled from beta distributions for probabilities and utilities and gamma distributions for costs). The model was constructed in R and parameters specifying distributions (shape and scale for gamma distributions and shape1 and shape2 for beta distributions) were estimated using the specified means and ranges ((36,37)). We conducted our analyses from both the health system and societal perspectives. In addition to including health outcome and health system costs, the latter also incorporates costs not paid by the publicly funded health system (e.g., direct out-of-pocket costs, productivity loss) ((38)).
To compare the three vaccination strategies, we conducted a sequential cost-effectiveness analysis ((38)). In short, the three vaccination strategies were ordered from lowest to highest cost. Incremental costs and QALYs gained were compared between a given strategy and the next less costly strategy. A vaccination strategy was considered dominated if at least one other vaccination strategy was expected to result in additional QALYs gained at a lower cost.
Scenario and sensitivity analyses
We conducted a scenario analysis to estimate the potential impact of vaccine-derived indirect effects on ICERs by including an exponential decline in PD incidence caused by Pneu-C-15 specific serotypes (i.e., 22F and 33F) and Pneu-C-20 specific serotypes (i.e., 8, 10A, 11A, 12F, 15B, 22F and 33F) across all age groups. We included an exponential decline ranging from 0%–50%, with effects beginning one year after the vaccination program was implemented and taking five to 10 years to reach maximum effect.
We also evaluated the cost-effectiveness of the three vaccination strategies in a higher cost, higher PD incidence setting such as that observed in the circumpolar region ((18,67)). Age-specific relative risks were calculated by comparing IPD incidence in Yukon, Northwest Territories and Nunavut to all of Canada (including the territories) ((18)). A relative measure of the increased cost associated with medical care in Yukon, Northwest Territories and Nunavut compared to all of Canada was extracted from an economic analysis of pneumococcal vaccines in older adults ((53)). We applied these multipliers to S. pneumoniae-attributed health outcomes and relevant costs in our base case analysis.
In addition to a probabilistic sensitivity analysis, we conducted deterministic sensitivity analyses to examine the robustness of the base case findings to our assumptions. First, we examined the impact of varying key model parameters in our base case in a one-way sensitivity analysis. Parameters were varied across a range of values (Tables 1-4). Second, given the uncertainty of the prices of Pneu-C-15 and Pneu-C-20, we conducted a two-way sensitivity analysis. We varied the incremental price of Pneu-C-15 and Pneu-C-20 to be up to 50% higher than the assumed price of Pneu-C-13. Third, we lowered the incidence of pCAP and AOM in our model, reflective of data from British Columbia ((19)); data from Ontario informed our base case analysis. Fourth, we lowered the number of AOM cases projected to be prevented by replacing Pneu-C-13 with Pneu-C-15 or Pneu-C-20. This reflects the lower AOM incidence attributed Pneu-C-15 and Pneu-C-20 vaccine serotypes in the United States ((68)).
Although Canada does not have a set cost-effectiveness threshold, we used two common thresholds, 60,000 per QALY, in our scenario and sensitivity analyses for illustrative purposes ((69,70)).
Our study follows the Professional Society for Health Economics and Outcomes Research (ISPOR) Consolidated Health Economic Evaluation Reporting Standards (CHEERS) 2022.
Results
The use of Pneu-C-15 and Pneu-C-20 averted additional S. pneumoniae-attributable health outcomes over 10 years compared to the continued use of Pneu-C-13 (Figure 2). On average, Pneu-C-15 averted an additional 221 (interquartile range [IQR]: 206–233) IPD cases, 337 (IQR: 533–976) hospitalized pCAP cases, 7,428 (IQR: 6,965–7,885) outpatient pCAP cases and 51,143 (IQR: 47,184–55,089) AOM cases in the Canadian population compared to the continued use of Pneu-C-13 in our base case. The Pneu-C-20 vaccine averted an additional 468 (IQR: 436–494) IPD cases, 730 (IQR: 533–976) hospitalized pCAP cases, 16,084 (IQR: 15,082–17,071) outpatient pCAP cases and 109,527 (IQR: 101,054–117,926) AOM cases compared Pneu-C-13.
Outcomes averted in all age groups compared to continued use of Pneu-C-13 over 10 years in the base case scenarioaAbbreviations: AOM, acute otitis media; IPD, invasive pneumococcal disease; pCAP, pneumococcal community acquired pneumonia; Pneu-C, pneumococcal conjugate vaccinea Results are shown for 10,000 model simulations
From the health system perspective, replacing Pneu-C-13 with Pneu-C-15 is expected to save an average of 497 QALYs and cost an additional 30 million over 10 years ([Table 5](#t5)). Replacing Pneu-C-13 with Pneu-C-20 is expected to save an average of 1,039 QALYs and cost an additional 103 million over ten years. From the societal perspective, Pneu-C-15 is expected to cost an additional 60 million over 10 years compared to the continued use of Pneu-C-13. From the health system perspective, Pneu-C-15 is most likely to be the optimal strategy at cost-effectiveness threshold ranges of 127,000 per QALY (Figure 3). Above 3,000 to 86,000 per QALY.
Percent of simulations for which each vaccination strategy was the optimal strategy for a given cost-effectiveness threshold in the base case from the health system and societal perspectives, in the absence of indirect effectsAbbreviations: Pneu-C, pneumococcal conjugate vaccine; QALY, quality-adjusted life year
The inclusion of indirect effects leads to lower ICERs because of the resulting reduction in PD among population members who did not receive the vaccine (Figure 4). At a cost-effectiveness threshold of 30,000 per QALY, a 10% or greater percent decrease in PD over a five-year period caused by the additional serotypes contained in Pneu-C-20 results in Pneu-C-20 being the preferred strategy. From the societal perspective, even smaller indirect effects would result in Pneu-C-15 or Pneu-C-20 being the optimal strategy.
Impact of a reduction in serotype-attributable disease due to indirect vaccine effects on the optimal vaccination strategy at 60,000 per QALY from a health system perspectiveaAbbreviations: Pneu-C, pneumococcal conjugate vaccine; QALY, quality-adjusted life yeara Results are a function of the percent reduction in serotype-attributable disease due to indirect effects and the time until the maximum effect is achieved
In a higher cost and higher PD incidence setting, on average, Pneu-C-15 averted an additional 925 (IQR: 859–979) IPD cases, 1,116 (IQR: 855–1,545) hospitalized pCAP cases, 25,638 (IQR: 24,055–27,254) outpatient pCAP cases and 190,760 (IQR: 175,466–205,884) AOM cases on average over 10 years compared to the continued use of Pneu-C-13 (**Appendix, **Figure A1). The Pneu-C-20 vaccine averted an additional 1,808 (IQR: 1,680–1,914) IPD cases, 2,294 (IQR: 1,683–3,039) hospitalized pCAP cases, 50,446 (IQR: 47,333–53,624) outpatient pCAP cases and 373,543 (IQR: 343,610–403,099) AOM cases compared Pneu-C-13. The Pneu-C-20 vaccine dominates (i.e., is less costly and more effective than) Pneu-C-13 and Pneu-C-15 from the both the health system and societal perspectives (Appendix, Table A1). The Pneu-C-20 vaccine is dominant, with lower costs and fewer QALYs lost than the current strategy (i.e., Pneu-C-13) and Pneu-C-15.
Our base case conclusions relied on several assumptions that we examined in sensitivity analyses. In our one-way sensitivity analysis of model parameters, vaccine price was the most influential parameter (not shown). When the relative vaccine prices of Pneu-C-15 and Pneu-C-20 compared to Pneu-C-13 were increased compared to their base case values, Pneu-C-13 remained the strategy with the lowest ICER (Figure 5). At a 60,000 per QALY threshold, Pneu-C-15 or Pneu-C-20 was the optimal strategy if the relative price increases for Pneu-C-15 or Pneu-C-20 were 5% or 15% or less than the price of Pneu-C-13, respectively. A lower incidence of pCAP and AOM led to sequential ICERs of over 200,000 per QALY for Pneu-C-20. Additionally, an AOM serotype distribution more similar to the United States, which differs from the serotype distribution of IPD in Canada, results in sequential ICERs of over $100,000 per QALY for Pneu-C-15 and Pneu-C-20.
Sensitivity analysis of vaccine costsa,bAbbreviations: Pneu-C, pneumococcal conjugate vaccine; QALY, quality-adjusted life yeara Incremental cost-effectiveness ratios were calculated for a range of prices per dose for Pneu-C-15 and Pneu-C-20, ranging from 0%–50% higher than the price of Pneu-C-13b The optimal strategy was identified for cost-effectiveness thresholds of 60,000 per QALY from the health system perspective
Discussion
We conducted an economic evaluation to estimate the health impact and cost-effectiveness of replacing Pneu-C-13 with Pneu-C-15 or with Pneu-C-20 for routine use in the paediatric population in Canada. Our base case results found that both Pneu-C-15 and Pneu-C-20 prevented additional cases of IPD, pCAP and AOM compared to the continued use of Pneu-C-13. In our base case, Pneu-C-15 would require a threshold of 18,272 per QALY from the societal perspective to be considered cost effective. The Pneu-C-20 vaccine would require a threshold of 93,416 per QALY from the societal perspective to be considered cost effective. In contrast, with the inclusion of moderate indirect vaccine effects (e.g., a reduction of 5% or greater in serotype-attributable PD), both Pneu-C-15 and Pneu-C-20 could be considered cost effective at thresholds under $30,000 per QALY from the health system and societal perspectives. In a higher cost and higher PD incidence setting, Pneu-C-20 dominates the other vaccination strategies.
A recent comparative analysis of three cost-utility models conducted in the United States compared Pneu-C-20 to either Pneu-C-15 or Pneu-C-13 using a 3+1 schedule in children younger than two years of age ((71)). It showed similar trends as our analysis, with Pneu-C-20 expected to result in the largest gain in health outcomes compared to the other vaccines. From the societal perspective, results varied across the three included models, with ICERs for Pneu-C-20 ranging from dominant to $162,700 per QALY compared to Pneu-C-15. The models included in this analysis were all static but differed in structure, analytic time horizon, assumptions about indirect protection effects and key parameters, further highlighting the sensitivity of these model-based economic evaluation results to model assumptions and input parameters ((13)).
The estimated cost-effectiveness of the different conjugate vaccines was driven, in part, by the presence or absence of indirect effects. After the introduction of Pneu-C-13 in paediatric populations, IPD incidence caused by the serotypes in the vaccine decreased in all age groups ((7,8)), but overall IPD incidence in the population did not substantially decrease ((10)). In several countries including Canada, the introduction of pneumococcal conjugate vaccines (i.e., Pneu-C-7, Pneu-C-10 and Pneu-C-13) resulted in increases in the incidence of IPD caused by serotypes not included in the vaccines across all ages ((72,73)). In our base case analysis, we conservatively did not include indirect effects, given the uncertainty of herd immunity effects and serotype replacement. In our scenario analysis, we modelled indirect effects as a decline in pneumococcal disease in the broader population not receiving the higher valency conjugate vaccines.
Uncertainty about vaccine price in the Canadian context adds complexity to the interpretation of our results, given how influential the prices of Pneu-C-15 and Pneu-C-20 were on the estimated ICERs. In sensitivity analysis, we showed that at lower incremental prices compared to the price per dose of Pneu-C-13, both higher valency vaccines can be cost-effective options. Our analysis provides an indication of the prices at which either vaccine may become the optimal strategy based on commonly used thresholds.
Limitations
Because we used a static model, our approach did not fully capture the transmission dynamics associated with herd immunity effects and serotype replacement. Future economic evaluations of pneumococcal conjugate vaccination should consider using dynamic models to inform cost-utility analyses to better capture these effects ((74)).
Additionally, our economic evaluation focused on children beginning their pneumococcal vaccination series. We did not assess the cost-effectiveness of the three strategies among children who were mid-way through their vaccine series, and we did not assess the impact of a potential catch-up program. Our estimates of the incidence of PD included children at both low and high risk of PD. We did not identify the optimal vaccination strategy independently among children at higher risk for PD outside of a higher cost setting.
Conclusion
Our study provides evidence of the impact Pneu-C-15 and Pneu-C-20 could have on reducing the burden of PD in Canada compared to the continued use of Pneu-C-13. Although ICERs were relatively high in the base case analysis, at lower vaccine prices and/or in the presence of indirect effects in the broader population following vaccine introduction, both vaccines have the potential to improve health in a cost-effective manner.
The reference list from the paper itself. Each links out to its DOI / PubMed record.
- 1Scelfo C, Menzella F, Fontana M, Ghidoni G, Galeone C, Facciolongo NC. Pneumonia and Invasive Pneumococcal Diseases: The Role of Pneumococcal Conjugate Vaccine in the Era of Multi-Drug Resistance. Vaccines (Basel) 2021;9(5):420. 10.3390/vaccines 905042033922273 PMC 8145843 · doi ↗ · pubmed ↗
- 2van Hoek AJ, Andrews N, Waight PA, George R, Miller E. Effect of serotype on focus and mortality of invasive pneumococcal disease: coverage of different vaccines and insight into non-vaccine serotypes. P Lo S One 2012;7(7):e 39150. 10.1371/journal.pone.003915022815698 PMC 3398022 · doi ↗ · pubmed ↗
- 3Greenberg D, Givon-Lavi N, Newman N, Bar-Ziv J, Dagan R. Nasopharyngeal carriage of individual Streptococcus pneumoniae serotypes during pediatric pneumonia as a means to estimate serotype disease potential. Pediatr Infect Dis J 2011;30(3):227–33. 10.1097/INF.0b 013e 3181 f 8780220861756 · doi ↗ · pubmed ↗
- 44.Desai S, Mc Geer A, Quach-Thanh C, Elliott D; approved by NACI. Update on the Use of Conjugate Pneumococcal Vaccines in Childhood: An Advisory Committee Statement (ACS) National Advisory Committee on Immunization (NACI). Can Commun Dis Rep. 2010 23;36(ACS-12):1–21. 10.1097/INF.0b 013e 3181 f 8780231697280 PMC 6802447 · doi ↗ · pubmed ↗
- 5Greenberg D, Hoover PA, Vesikari T, Peltier C, Hurley DC, Mc Fetridge RD, Dallas M, Hartzel J, Marchese RD, Coller BG, Stek JE, Abeygunawardana C, Winters MA, Mac Nair JE, Pujar NS, Musey L. Safety and immunogenicity of 15-valent pneumococcal conjugate vaccine (PCV 15) in healthy infants. Vaccine 2018;36(45):6883–91. 10.1016/j.vaccine.2018.02.11330244873 · doi ↗ · pubmed ↗
- 6Hurley D, Griffin C, Young M, Scott DA, Pride MW, Scully IL, Ginis J, Severs J, Jansen KU, Gruber WC, Watson W. Safety, Tolerability, and Immunogenicity of a 20-Valent Pneumococcal Conjugate Vaccine (PCV 20) in Adults 60 to 64 Years of Age. Clin Infect Dis 2021;73(7):e 1489–97. 10.1093/cid/ciaa 104532716500 PMC 8492133 · doi ↗ · pubmed ↗
- 7Wijayasri S, Hillier K, Lim GH, Harris TM, Wilson SE, Deeks SL. The shifting epidemiology and serotype distribution of invasive pneumococcal disease in Ontario, Canada, 2007-2017. P Lo S One 2019;14(12):e 0226353. 10.1371/journal.pone.022635331834926 PMC 6910703 · doi ↗ · pubmed ↗
- 8Waye A, Chuck AW. Value Added by the Prevnar 13 Childhood Immunization Program in Alberta, Canada (2010-2015). Drugs Real World Outcomes 2015;2(3):311–8. 10.1007/s 40801-015-0037-227747577 PMC 4883219 · doi ↗ · pubmed ↗