Kinetic and Thermodynamic Characterization of Human 4-Oxo-l-proline Reductase Catalysis
Ennio Pečaver, Greice M. Zickuhr, Teresa F. G. Machado, David J. Harrison, Rafael G. da Silva

TL;DR
This paper studies the human enzyme BDH2, revealing its role in reducing 4-oxo-l-proline to an anticancer compound and detailing its catalytic and thermodynamic properties.
Contribution
The paper provides the first mechanistic and thermodynamic characterization of human BDH2's catalytic activity.
Findings
The BDH2 reaction strongly favors forming cis-4-hydroxy-l-proline.
NADH binding and dissociation rates were measured at different temperatures.
The reaction's rate is not limited by the chemical step but may involve product release.
Abstract
The enzyme 4-oxo-l-proline reductase (BDH2) has recently been identified in humans. BDH2, previously thought to be a cytosolic (R)-3-hydroxybutyrate dehydrogenase, actually catalyzes the NADH-dependent reduction of 4-oxo-l-proline to cis-4-hydroxy-l-proline, a compound with known anticancer activity. Here we provide an initial mechanistic characterization of the BDH2-catalyzed reaction. Haldane relationships show the reaction equilibrium strongly favors the formation of cis-4-hydroxy-l-proline. Stereospecific deuteration of NADH C4 coupled with mass spectrometry analysis of the reaction established that the pro-S hydrogen is transferred. NADH is co-purified with the enzyme, and a binding kinetics competition assays with NAD+ defined dissociation rate constants for NADH of 0.13 s–1 at 5 °C and 7.2 s–1 at 25 °C. Isothermal titration calorimetry at 25 °C defined equilibrium dissociation…
Genes, proteins, chemicals, diseases, species, mutations and cell lines named across the full text — each resolved to its canonical identifier and authoritative record.
Click any figure to enlarge with its caption.
 Scheme 1
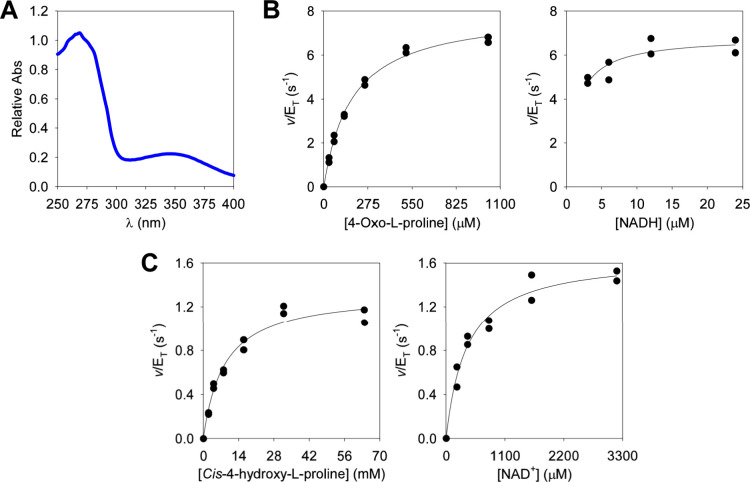 Figure 1
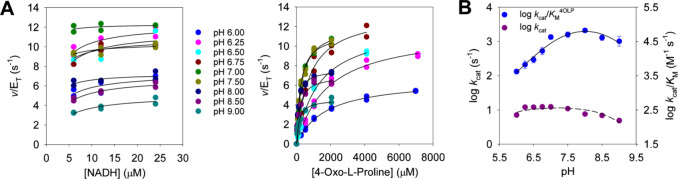 Figure 2
 Figure 3
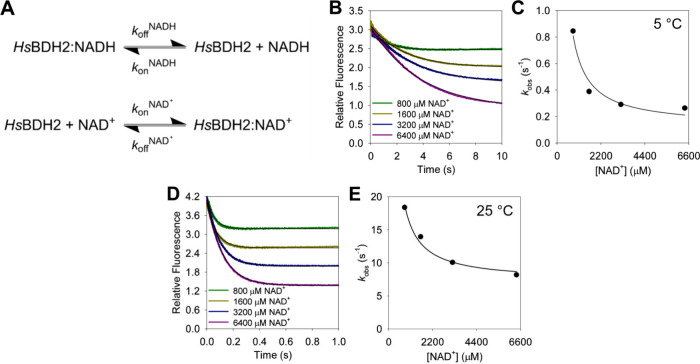 Figure 4
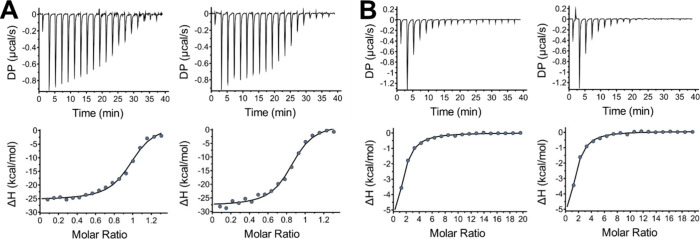 Figure 5
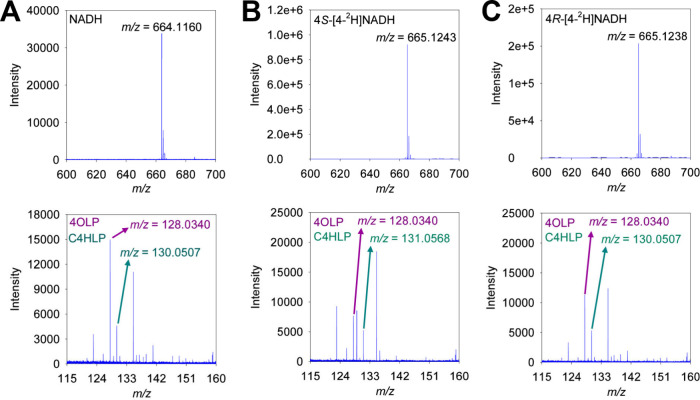 Figure 6
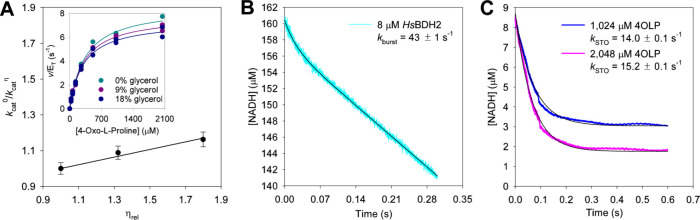 Figure 7
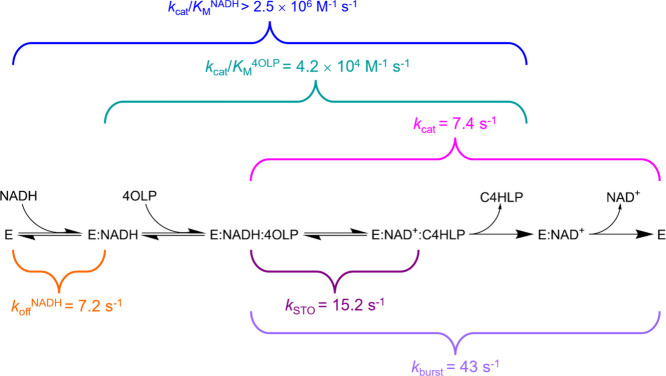 Scheme 2
- —Cunningham TrustNA
Peer Reviews
No public reviews on file for this paper yet. If you reviewed it on a platform where reviews are public (OpenReview, ICLR, NeurIPS, ICML), you can paste yours below so the community can read it here.
Videos
No videos yet. Explain this paper in a talk, walkthrough, or lecture? Add one.
Taxonomy
TopicsMetal-Catalyzed Oxygenation Mechanisms · Photosynthetic Processes and Mechanisms · Redox biology and oxidative stress
Introduction
Mammalian cytosolic protein BDH2, encoded by the bdh2 gene, was initially thought to be an (R)-3-hydroxybutyrate dehydrogenase involved in ketone body metabolism, homologous to, yet distinct from, the bdh1-encoded mitochondrial (R)-3-hydroxybutyrate dehydrogenase known to be responsible for the interconversion between acetoacetate and (R)-3-hydroxybutyrate.^1^ In murine cells, BDH2 was demonstrated to be responsible for the synthesis of 2,5-dihydroxybenzoic acid, a mammalian siderophore, and bdh2 expression downregulation causes iron imbalance in the cell.^2^ Recently, the human orthologue was also shown to accept l-2-keto-3-deoxyfuconate, a constituent of prokaryotic cell walls, as a substrate.^3^
BDH2 belongs to the short-chain dehydrogenase/reductase (SDR) superfamily, with a Rossmann fold for NAD(P)H binding and a characteristic Ser-Tyr-Lys catalytic triad.^1,4^ In SDRs, the Ser residue is proposed to position the substrate for catalysis while the Tyr residue acts as a general acid/base. The Tyr side-chain pKa is lower than its typical solution value due to the proximity to the Lys residue.^5,6^ In human BDH2 (HsBDH2), the Ser133-Tyr147-Lys151 triad is the catalytic triad, and the enzyme is specific for NAD^+^ over NADP^+^.^1^
A seminal study showed HsBDH2 to be a 4-oxo-l-proline reductase (EC 1.1.1.104), catalyzing the reversible, NADH-dependent reduction of 4-oxo-l-proline to cis-4-hydroxy-l-proline^7^ (Scheme 1), providing evidence for cis-4-hydroxy-l-proline synthesis in human cells.^7^ Interestingly, cis-4-hydroxy-l-proline is produced as the free amino acid^7^ as opposed to the post-translational modification of l-proline residues that generates trans-4-hydroxy-l-proline, catalyzed by prolyl hydroxylases.^8^ Importantly, cis-4-hydroxy-l-proline is a compound with known anticancer properties, having been the subject of preclinical and clinical studies against pancreatic cancer,^9−11^ even though its metabolic fate in normal cells and its specific mode of action against cancer are still elusive.^7,9−11^
HsBDH2-Catalyzed Reversible Reduction of 4-Oxo-l-proline
Because of the importance of HsBDH2 in the production of an endogenous anticancer metabolite, compounds that specifically modulate HsBDH2 activity would be useful chemical tools to uncover the role of the enzyme in cancerous and healthy tissues. Understanding the biochemical features of the HsBDH2-catalyzed synthesis of cis-4-hydroxy-l-proline could constitute an early step to enable inhibitor design. Here we employ UV–VIS absorbance and fluorescence spectroscopy, isothermal titration calorimetry (ITC), differential scanning fluorimetry (DSF), liquid chromatography-electrospray ionization-mass spectrometry (LC-ESI-MS), pH–rate profiles, steady-state kinetics, and pre-steady-state kinetics to investigate HsBDH2-catalyzed 4-oxo-l-proline reduction. The interaction between HsBDH2 and NADH is explored as well as the rate-limiting steps for the reaction.
Materials and Methods
Materials
All chemicals were used without further purification or modification. Ampicillin, dithiothreitol (DTT), and isopropyl β-d-1-thiogalactopyranoside (IPTG) were purchased from Formedium. Escherichia coli DH5α (high efficiency) and BL21(DE3) competent cells, Q5 DNA polymerase, and a Gibson Assembly Cloning Kit were purchased from New England Biolabs. Ethylenediaminetetraacetic acid-free complete protease inhibitor cocktail, 2-(N-morpholino)ethanesulfonic acid (MES), 4-oxo-l-proline, acetoacetate, lysozyme, 2-(cyclohexylamino)ethanesulfonic acid (CHES), and PEG-8000 were purchased from Merck. Agarose, 4-(2-hydroxyethyl)piperazine-1-ethanesulfonic acid (HEPES), cis-4-hydroxy-l-proline, dNTPs, and NaCl were purchased from ThermoFisher Scientific.
Cloning and Expression of HsBDH2
The DNA encoding HsBDH2 (UniProt Q9BUT1) containing a tobacco etch virus protease-cleavable N-terminal six-His tag with restriction sites for NdeI and HindIII at the 5′- and 3′-ends, respectively, was purchased as gBlock with codons optimized for E. coli expression (IDT). The gBlock was inserted into a modified pJexpress414 vector plasmid via Gibson assembly^12^ following the manufacturer’s instructions (New England Biolabs). After Ni^2+^-affinity chromatography (described below), tobacco etch virus protease-catalyzed cleavage of the six-His tag was unsuccessful; thus, we decided to keep the six-His tag but remove the cleavage site from the final sequence. The construct was therefore modified by site-directed mutagenesis^13^ to remove the tobacco etch virus protease cleavage site to minimize deviation from the wild-type sequence. The forward primer 5′-TTCCATATGGGTCGTCTTGACGGGAAAGTAATTATCC-3′ and the reverse primer 5′-CGACCCATATGGAATTCCAAAAGTTAAACAAAATTATTTCTAG-3′ were used in the polymerase chain reaction (PCR) for site-directed mutagenesis, and the final protein sequence was MHHHHHHMGRLDGKVIILTAAAQGIGQAAALAFAREGAKVIATDINESKLQELEKYPGIQTRVLDVTKKKQIDQFANEVERLDVLFNVAGFVHHGTVLDCEEKDWDFSMNLNVRSMYLMIKAFLPKMLAQKSGNIINMSSVASSVKGVVNRCVYSTTKAAVIGLTKSVAADFIQQGIRCNCVCPGTVDTPSLQERIQARGNPEEARNDFLKRQKTGRFATAEEIAMLCVYLASDESAYVTGNPVIIDGGWSL.
The final construct was used to transform E. coli DH5α competent cells and sequenced (Eurofins) from plate colonies to verify mutation-free gene insertion. Then, the construct was used to transform BL21(DE3) competent cells (New England Biolabs). Transformed cells were grown in lysogeny broth supplemented with 100 μg mL^–1^ ampicillin at 37 °C until an optical density at 600 nm of 0.6–0.8 was reached. HsBDH2 expression was induced with 0.5 mM IPTG, after which the cells were grown at 25 °C for an additional 16 h, harvested by centrifugation (6774g for 20 min at 4 °C), and stored at −20 °C.
Purification of HsBDH2
All chromatographic steps were performed using a AKTA Start FPLC system (Cytiva). Harvested cells were thawed on ice and resuspended in buffer A [50 mM HEPES, 500 mM NaCl, and 10 mM imidazole (pH 8.0)] supplemented with lysozyme (0.2 mg/mL), 0.05 mg/mL BaseMuncher (Expedeon), and a half-tablet of complete protease inhibitor cocktail (Roche). Resuspended cells were lysed in a cell disruptor (Constant Systems) at 30 000 psi and 5 °C and centrifuged (56000g for 20 min at 4 °C). The supernatant was filtered using a syringe with a 0.45 μm membrane filter and loaded onto a 5 mL HisTrap FF column (Cytiva) pre-equilibrated with buffer A.
For HsBDH2 used in steady-state and pre-steady-state assays, chromatographic purification procedures were carried out at 4 °C. The column was washed with 15 column volumes (CV) of 8% buffer B [50 mM HEPES, 500 mM NaCl, and 500 mM imidazole (pH 8.0)]. Adsorbed protein was eluted with a 20 CV gradient of 8% to 70% buffer B. Fractions were collected and analyzed by sodium dodecyl sulfate–polyacrylamide gel electrophoresis (SDS–PAGE) in NuPAGE Bis-Tris 4–12% precast gels (ThermoFisher Scientific) alongside the PageRuler Plus Stained Protein Ladder (ThermoFisher Scientific). Fractions containing purified HsBDH2 were collected, dialyzed against 2 × 2 L of buffer C [100 mM HEPES, 12.5 mM NaCl, and 1 mM DTT (pH 7.0)], and concentrated using a 10 000 molecular weight cutoff (MWCO) ultrafiltration membrane.
For HsBDH2 stocks used in binding assays, the chromatographic steps were carried out at room temperature. The column was washed with 30 CV of 8% buffer B, and adsorbed protein was eluted with a 20 CV gradient from 8% to 70% buffer B. Fractions were collected and analyzed by SDS–PAGE as described above. Fractions containing purified HsBDH2 were collected and dialyzed against 2 L of buffer C. The dialyzed protein solution was treated with 20 mM acetoacetate for 30 min at room temperature, washed with buffer, and concentrated in the ultrafiltration membrane. This process was repeated once, after which the protein solution was again dialyzed against 2 L of buffer C.
The concentrations of HsBDH2 and NADH within the samples were determined spectrophotometrically in a Shimadzu UV-2600 spectrophotometer. The NADH concentration was determined at 340 nm (ε_340_ = 6220 M^–1^ cm^–1^). The HsBDH2 concentration was determined at 280 nm (ε_280_ = 18 825 M^–1^ cm^–1^; ProteinParam tool of ExPasy) while controlling for NADH absorbance at the same wavelength (ε_280_ = 3600 M^–1^ cm^–1^).^14^HsBDH2 was aliquoted and stored at −80 °C. The molecular mass of HsBDH2 was verified via LC-ESI-MS analysis at the University of St Andrews Proteomics and Mass Spectrometry Facility.
Synthesis of 4S-[4-2H]NADH and 4R-[4-2H]NADH
The biocatalytic synthesis and purification of 4S-[4-^2^H]NADH were performed as previously reported.^6^ Biocatalytic synthesis of 4R-[4-^2^H]NADH was achieved as previously described.^15,16^ Briefly, a solution containing 0.05 M sodium bicarbonate, 0.05 M deuterated formic acid (Merck), 0.015 M NAD^+^, and 1 mg of formate dehydrogenase at pH 8.5 was allowed to react at room temperature. After 4 h, the solution pH was adjusted to 8.5 again. Purification was carried out as previously described for 4S-[4-^2^H]NADH.^6^
HsBDH2 Activity Assay for Steady-State Kinetics
All 500 μL assays were monitored spectrophotometrically at 340 nm for 1 min under initial rate conditions in 1 cm optical path length quartz cuvettes (Hellma) using a Shimadzu UV-2600 spectrophotometer outfitted with a CPS unit for temperature control. In the forward direction, activity was monitored via the decrease in absorbance corresponding to NADH oxidation (ε_340_ = 6220 M^–1^ cm^–1^). In the reverse direction, activity was monitored via the increase in absorbance, indicating NAD^+^ reduction. Unless otherwise stated, experiments were carried out at 25 °C and pH 7.0. Reactions were carried out in assay buffer containing 100 mM HEPES (pH 7.0), 12.5 mM NaCl, and 1 mM DTT. In the forward direction, 6–20 nM HsBDH2 was used, as well as varying concentrations of one substrate at a fixed, saturating concentration of the other (either 0–1024 μM 4-oxo-l-proline and 24 μM NADH or 3–24 μM NADH and 1024 μM 4-oxo-l-proline). For the reverse reaction, 20–40 nM HsBDH2 was used, as well as varying concentrations of one substrate at a fixed, saturating concentration of the other (0–64 mM cis-4-hydroxy-l-proline and 3200 μM NAD^+^ or 0–3200 μM NAD^+^ and 64 mM cis-4-hydroxy-l-proline). The pH of the cis-4-hydroxy-l-proline stock solution was adjusted to 7.0. An additional experiment was carried out under previously published assay conditions.^7^ The reaction was performed at 37 °C in 80 mM sodium phosphate (pH 6.5), 1 mM DTT, and 0.1 mg mL^–1^ bovine serum albumin, with 4.4 nM HsBDH2, 40 μM NADH, and 0–2048 μM 4-oxo-l-proline. Two independent rate measurements were carried out. Controls lacked the enzyme.
LC-ESI-MS Analysis of the HsBDH2-Catalyzed
Reaction
A mixture of 300 μM NADH or its isotopologues, 300 μM 4-oxo-l-proline, and 10 μM HsBDH2 in assay buffer was incubated at room temperature for 1 h, after which the enzyme was removed by centrifugation in 10 000 MWCO Vivaspin microfuge tubes. LC-ESI-MS analyses of the HsBDH2-catalyzed reaction and reagent standards NADH, 4S-[4-^2^H]NADH and 4R-[4-^2^H]NADH were carried out on a Waters Atlantis Premier BEH C_18_ AX 1.7 μm, 2.1 mm × 100 mm column in an Acquity H-Class UPLC system coupled to a Waters Xevo G2-XS Q-TOF mass spectrometer. The flow rate was set to 300 μL min^–1^ with initial conditions of 90% 10 mM ammonium acetate (pH 6.0) and 10% acetonitrile for 0.5 min followed by a step change to 50% 10 mM ammonium acetate (pH 6.0), 40% 10 mM ammonium acetate (pH 10.0), and 10% acetonitrile for 2.0 min, and re-equilibration in 90% 10 mM ammonium acetate (pH 6.0) and 10% acetonitrile for 4.5 min. LC-ESI-MS analyses of the HsBDH2-catalyzed reaction and reagent standards 4-oxo-l-proline and cis-4-hydroxy-l-proline were carried out on an ACE Excel 2 AQ, 2.1 mm × 100 mm column. The flow rate was set to 300 μL min^–1^ with initial conditions of 99% water/formic acid (0.1%) and 1% acetonitrile/formic acid (0.1%) for 1 min, followed by a linear gradient to 1% water/formic acid (0.1%) and 99% acetonitrile/formic acid (0.1%) for 1 min, and held until 3 min, followed by re-equilibration to 99% water/formic acid (0.1%) and 1% acetonitrile/formic acid (0.1%) for 5 min. The column oven temperature was maintained at 40 °C, and the injection volume was 5 μL. The ESI interface was operated in negative mode with a capillary voltage of 2.5 kV, a source temperature of 100 °C, a desolvation temperature of 250 °C, and a desolvation gas flow of 600 L h^–1^. Mass spectra were acquired in TOF mode in the range of m/z 90–800 at a rate of one scan per second.
HsBDH2 pH–Rate Profiles
The pH dependence of kcat and kcat/KM was determined by measuring initial rates in a composite buffer (100 mM MES, 100 mM HEPES, 100 mM CHES, 12.5 mM NaCl, and 1 mM DTT) in the pH range of 6.0–9.0, with 20 nM HsBDH2 and 24 μM NADH when varying the concentration of 4-oxo-l-proline (from 0 to a maximum of 7100 μM, depending on the pH), and 6 nM HsBDH2 and a saturating concentration of 4-oxo-l-proline when varying the concentration of NADH (6–24 μM). To ensure that HsBDH2 remained stable at the pH extremes, enzyme stocks were diluted in buffer at pH 6.0 and 9.0 prior to measuring activity at pH 7.0, without any noticeable change in activity. Two independent rate measurements were carried out.
HsBDH2 Kinetics in the Presence of Glycerol
The effect of glycerol on kcat and kcat/KM was determined by measuring initial rates in the presence of 0–18% (v/v) glycerol. Initial rates were also measured in the presence of 5% (w/v) PEG-8000 as a control. Reaction mixtures contained 20 nM HsBDH2 and 24 μM NADH when varying the concentration of 4-oxo-l-proline (0–2024 μM), and 6 nM HsBDH2 and 2024 μM 4-oxo-l-proline when varying the concentration of NADH (6–24 μM). Two independent measurements were performed.
Rapid Kinetics
All rapid kinetics experiments were performed in an Applied Photophysics SX-20 stopped-flow spectrophotometer outfitted with a 5 μL mixing cell (0.5 cm path length, 0.9 ms dead time) and a circulating water bath for temperature control. Reactions were triggered by rapid mixing of 55 μL of each syringe. For HsBDH2 kinetics under single- and multiple-turnover conditions, reactions measured depletion of NADH at 25 °C via an absorbance decrease at 340 nm. Each syringe contained assay buffer. For each reaction, a minimum of four traces were collected and averaged. For single-turnover reactions, one syringe contained 20 μM HsBDH2 and 20 μM NADH and the other contained either 2048 or 4096 μM 4-oxo-l-proline. Traces contained 9000 data points over 0.6 s in a logarithmic time scale. For the multiple-turnover experiments, one syringe contained 320 μM NADH and 16 μM HsBDH2 and the other contained 4096 μM 4-oxo-l-proline. Traces contained 2400 data points over 0.3 s on a logarithmic time scale.
The NADH dissociation rate was measured via the decrease in fluorescence upon the departure of NADH with an excitation wavelength of 340 nm and an emission cutoff filter of 400 nm. Each syringe contained assay buffer. One syringe contained 20 μM HsBDH2 and 16.6 μM NADH, and the other contained 1.6–12.8 mM NAD^+^. At 25 °C, fluorescence decay was monitored with 5000 data points collected over 1 s on a logarithmic time scale. At 5 °C, 5000–9000 data points were collected over 10 s in a logarithmic time scale. For each reaction, a minimum of five traces were collected and averaged.
Thermostability of HsBDH2
DSF-based thermal denaturation measurements were performed in 96-well plates on an Applied Biosystems QuantStudio 1 Real-Time PCR instrument. Reaction mixtures (20 μL) contained assay buffer and 5× SYPRO Orange (Invitrogen) with addition of either 0–160 μM NADH to 8 μM HsBDH2 or 0–1200 μM NAD^+^ to 7.7 μM HsBDH2 apoenzyme. Thermal denaturation was followed via concomitant fluorescence emission from SYPRO Orange (λ_ex_ = 520 ± 10 nm, and λ_em_ = 558 ± 11 nm) across a temperature range of 25–95 °C in increments of 0.05 °C s^–1^. Controls were performed in the absence of the enzyme and subtracted from measurements containing the enzyme. For each concentration of NADH or NAD^+^, at least two independent measurements were carried out. The thermostability of HsBDH2 activity was determined in an Applied Photophysics SX-20 stopped-flow spectrophotometer. One syringe contained 600 nM HsBDH2, and the other 48 μM NADH and 4096 μM 4-oxo-l-proline. The enzyme was continuously incubated within the syringe at 25 °C for 3.5 h, and rate data were collected every 0.5 h. Traces had 2000 data points collected over 10 s on a linear time scale.
Isothermal titration calorimetry (ITC)
ITC measurements were carried out in a MicroCal PEAQ-ITC calorimeter (Malvern Instruments). Experiments were performed at 25 °C. NADH and NAD^+^ were solubilized in HsBDH2 assay buffer at concentrations of 200 μM and 3 mM, respectively. After an initial injection of 0.4 μL, 19 successive 2 μL injections of the respective ligand were performed in a solution of 30 μM HsBDH2 apoenzyme. Injections were carried out in 120 s intervals with a reference power of 10 μcal s^–1^. The heat of dilution was measured using a negative control, where the ligand was titrated into assay buffer, and these data were subtracted from the binding curve. Two independent experiments were performed for each ligand. Data were fitted to a single-site binding model (1:1 stoichiometry with no cooperativity) in the PEAQ-ITC analysis software (Malvern instruments). For NAD^+^ binding analysis, the number of sites was fixed at one.
Kinetics and DSF Data Analysis
DSF and kinetics data were analyzed by the nonlinear regression function of SigmaPlot 13.0 (SPSS). Substrate saturation curves at a fixed concentration of the co-substrate were fitted to eq 1. The pH–rate profiles were fitted to eq 2. Protein denaturation data were fitted to eqs 3 and 4. Data for the dissociation rate constant by competition were fitted to eqs 5 and 6. The apparent Keq was calculated with eq 7. Solvent viscosity effects were obtained from eq 8. Pre-steady-state kinetics under multiple- and single-turnover conditions were analyzed with eqs 9 and 10, respectively. In eqs 1–10, v is the initial rate, kcat is the apparent steady-state catalytic rate constant, KM is the apparent Michaelis constant, ET is the total enzyme concentration, S is the concentration of the varied substrate when that of the co-substrate is held constant, C is the pH-independent value of kcat, H is the proton concentration, Ka1 and Ka2 are apparent acid dissociation constants, FU is the fraction unfolded, T is the temperature in degrees Celsius, Tm is the melting temperature, c is the slope of the transition region, LL and UL are the folded and unfolded baselines, respectively, ΔTm^max^ is the maximum thermal stabilization, L is the ligand concentration, KTm is the apparent dissociation constant for L, F(t) and F∞ are fluorescence at times t and ∞, respectively, A0 is the signal amplitude, kobs is the observed rate constant, Keq^app^ is the apparent equilibrium constant, kcat^0^ and kcat^η^ represent the kcat in the absence and presence of glycerol, respectively, η_rel_ is the relative viscosity of the solution, m is the slope, NADH(t) and NADH_∞_ are NADH concentrations at times t and ∞, respectively, kburst is the burst-phase rate constant, and kSTO is the single-turnover rate constant.
Results
Purification and Steady-State Kinetics of HsBDH2
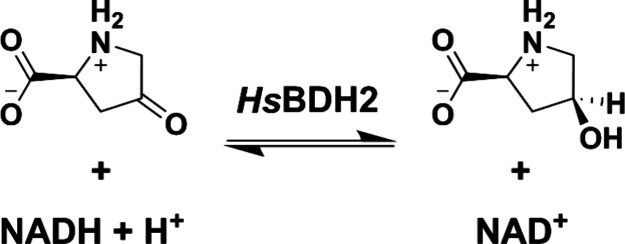
HsBDH2 was purified to homogeneity as judged by Coomassie Blue-stained SDS–PAGE (Figure S1). LC-ESI-MS analysis indicated that the mass of the purified protein matches the predicted mass of N-terminally His-tagged HsBDH2 (Figure S2). A 4-oxo-l-proline saturation curve under experimental conditions reported previously (pH 6.5 and 37 °C)^7^ yielded apparent kinetic parameters (Figure S3) in excellent agreement with published values.^7^ The UV–VIS spectrum of purified HsBDH2 revealed, in addition to the expected peak at 280 nm, a peak at 340 nm (Figure 1A), suggesting the purified enzyme was bound to NADH. Quantification of NADH and HsBDH2 by their respective extinction coefficients estimated that ∼83% of the purified enzyme was bound to NADH, which was reproduced across several independent batches of HsBDH2.
Biochemical characterization of HsBDH2. (A) UV–VIS spectrum of purified HsBDH2. (B) Michaelis–Menten plots for HsBDH2-catalyzed reduction of 4-oxo-l-proline. (C) Michaelis–Menten plots for HsBDH2-catalyzed oxidation of cis-4-hydroxy-l-proline. All Michaelis–Menten plots were determined at 25 °C and pH 7.0. All data points are shown for two independent measurements. Lines are the best fits of the data to eq 1.
At 25 °C and pH 7.0, 4-oxo-l-proline and NADH saturation curves (Figure 1B) were fitted to eq 1 to yield an apparent kcat of 7.4 ± 0.2 s^–1^ (mean ± propagated fitting error), an apparent kcat/KM^4OLP^ of (4.2 ± 0.3) × 10^4^ M^–1^ s^–1^ (value ± propagated fitting error), and an apparent KM^4OLP^ of 176 ± 12 μM (value ± fitting error). The KM^NADH^ was too low (KM^NADH^ < 3 μM) to be reliably estimated by fitting of the data to eq 1. However, fitting the data to eq 1 places a lower limit on the apparent kcat/KM^NADH^ of ∼2.5 × 10^6^ M^–1^ s^–1^. Saturation curves for cis-4-hydroxy-l-proline and NAD^+^ (Figure 1C) were fitted to eq 1 to generate an apparent kcat of 1.50 ± 0.05 s^–1^ (mean ± propagated fitting error), an apparent KM^C4HLP^ of 8 ± 1 mM (value ± fitting error), an apparent kcat/KM^C4HLP^ of 188 ± 24 M^–1^ s^–1^ (value ± propagated fitting error), an apparent KM^NAD^+^^ of 394 ± 65 μM (value ± fitting error), and an apparent kcat/KM^NAD^+^^ of (3.8 ± 0.6) × 10^3^ M^–1^ s^–1^ (value ± fitting error).
Acid–Base Chemistry in the HsBDH2-Catalyzed
Reaction
To probe the role of acid–base chemistry in the NADH-dependent reduction of 4-oxo-l-proline, apparent steady-state parameters were determined at various pH values (Figure 2A), and pH–rate profiles were obtained for kcat and kcat/KM^4OLP^ (Figure 2B). Because of the very low KM^NADH^, no profile could be accurately obtained for kcat/KM^NADH^. The kcat/KM^4OLP^ profile was bell-shaped; the best fit of the data to eq 2 indicated one group with an apparent pKa of 7.3 ± 0.2 (value ± fitting error) must be deprotonated for the optimum binding of 4-oxo-l-proline to the HsBDH2:NADH complex and/or for catalysis, while another group with an apparent pKa of 8.7 ± 0.2 (value ± fitting error) must be protonated. The latter value must be considered with caution because there are not enough data points to define precisely the slope on the basic limb, which eq 2 assumes to be −1. The kcat profile was less informative, and although the data were fitted to eq 2, neither acidic nor basic limb is well-defined in the pH range employed. This suggests that the relevant pKa values are displaced outwardly in comparison with the kcat/KM^4OLP^ profile.
HsBDH2 pH–rate profiles. (A) Michaelis–Menten plots were obtained for HsBDH2 at different pH values. All Michaelis–Menten plots were determined at 25 °C. All data points are shown for two independent measurements. Lines are best fits of the data to eq 1. (B) HsBDH2 pH–kcat/KM4OLP and pH–kcat profiles. Data points are means ± propagated fitting errors and values ± propagated fitting errors for the kcat and kcat/KM4OLP profiles, respectively. Lines are best fits of the data to eq 2.
Coenzyme Binding Confers Thermostability to HsBDH2
To test whether coenzyme binding may induce thermostability to HsBDH2, DSF-based thermal melting profiles were evaluated in the presence of increasing concentrations of either NADH (including 6.8 μM prebound to the protein) or NAD^+^ (Figure 3). Each thermal denaturation trace was fitted to eq 3 (Figure 3A,B) to produce a melting temperature (Tm). The change in Tm as compared to the Tm without adding the coenzyme was plotted as a function of the concentration of either NADH (Figure 3B) or NAD^+^ (Figure 3D). At 166.8 μM NADH, for HsBDH2 (∼83% of which are already bound to NADH at the beginning of the experiment) the Tm of 44.5 ± 0.1 °C increases to 55.5 ± 0.1 °C, giving a ΔTm of 11 °C. The best fit of the data to eq 4 predicted a maximum ΔTm of ∼20 °C (Figure 3B), probably an overestimation. The HsBDH2 apoenzyme has a low Tm of 33.3 ± 0.1 °C (Figure 3C), and addition of NAD^+^ increases the Tm by a predicted maximum of ∼15 °C from the best fit of the data to eq 4 (Figure 3D).
DSF-based thermal denaturation of HsBDH2. (A) Denaturation of HsBDH2 in the presence of NADH. (B) Dependence of ΔTm on the NADH concentration. (C) Denaturation of the HsBDH2 apoenzyme in the presence and absence of NAD+. (D) Dependence of ΔTm on the NAD+ concentration. In panels A and C, each trace is the average of three measurements, and black lines are best fits of the data to eq 3. In panels B and D, data points are the values ± fitting errors, and lines are the best fits of the data to eq 4. All data were collected at pH 7.0.
Dissociation Rate Constant of the HsBDH2:NADH
Complex
The co-purification of HsBDH2 and NADH suggests the HsBDH2:NADH binary complex dissociates slowly. To estimate the apparent dissociation rate constant (koff) for NADH, the rapid kinetics competition binding of NAD^+^ to HsBDH2 was evaluated by following the fluorescence (λ_ex_ = 340 nm; λ_em_ > 400 nm) change observed upon the release of NADH from the enzyme (Figure 4). Considering the sequential reactions depicted in Figure 4A, koff^NADH^ will be rate-limiting for the formation of the HsBDH2:NAD^+^ complex provided kon^NAD^+^^[NAD^+^] ≫ koff^NADH^ and kon^NAD^+^^[NAD^+^] ≫ kon^NADH^[NADH], a condition that can be met by increasing the NAD^+^ concentration until the observed rate constant for fluorescence decay becomes independent of the concentration of the competitor.^17^ Rapid mixing of NAD^+^ with the HsBDH2:NADH complex at 5 °C led to exponential fluorescence decay (Figure 4B). The best fit of the data to eq 5 yielded the observed rate constants whose hyperbolic dependence on NAD^+^ concentration (Figure 4C) could be fitted to eq 6(17) to generate a koff^NADH^ of 0.13 ± 0.06 s^–1^. This low off rate likely underpins the purification of HsBDH2 mostly bound to NADH, because the protocol is carried out at 4 °C. At 25 °C (Figure 4D,E), the koff^NADH^ increases ∼55-fold to 7.2 ± 0.7 s^–1^.
NADH dissociation rate by competition binding kinetics. (A) Reactions required to form the HsBDH2:NAD+ complex from the HsBDH2:NADH complex. (B) Time course of fluorescence decay upon rapid mixing of NAD+ and the HsBDH2:NADH complex at 5 °C. (C) Dependence of the observed fluorescence decay rate constant at 5 °C on NAD+ concentration. (D) Time course of fluorescence decay upon rapid mixing of NAD+ and the HsBDH2:NADH complex at 25 °C. (E) Dependence of the observed fluorescence decay rate constant at 25 °C on NAD+ concentration. In panels B and D, each trace is the average of 10 reactions, and thin black lines are best fits of the data to eq 5. In panels C and E, data points are values ± fitting errors, and the lines are best fits to eq 6. All data were collected at pH 7.0.
HsBDH2 Apoenzyme
To purify HsBDH2 without bound NADH, three observations were important. The enzyme can catalyze the reduction of acetoacetate to generate (R)-3-hydroxybutyrate and NAD^+^, albeit with a very low kcat/KM.^1,7^ The koff^NADH^ is significantly increased at 25 °C in comparison with the value at 5 °C (Figure 4). Finally, the HsBDH2 catalytic activity is stable with respect to incubation of the enzyme at 25 °C for ≥3.5 h (Figure S4). Using a protocol that included the chromatographic step carried out at room temperature (∼21 °C) and two rounds of reaction of the enzyme with excess acetoacetate at 25 °C followed by ultrafiltration at 4 °C, HsBDH2 was isolated (Figure S5) and the expected mass was confirmed by LC-ESI-MS (Figure S6). UV–VIS spectroscopy indicated significant, but not complete, loss of NADH (Figure S7). Quantification of HsBDH2 and NADH by their respective extinction coefficients estimated that ∼22% of the purified enzyme was bound to NADH, which was reproducible across subsequent preparations. This enzyme, mostly free of NADH, is termed the HsBDH2 apoenzyme. The apparent steady-state kinetic parameters of the HsBDH2 apoenzyme are in accordance with those of NADH-bound HsBDH2 (Figure S8).
Thermodynamics of the Coenzyme Binding to HsBDH2
The equilibrium binding of the HsBDH2 apoenzyme to either NADH or NAD^+^ was investigated by ITC, using the concentration of NADH-free HsBDH2 as the concentration of the enzyme available for binding. Both NADH and NAD^+^ binding isotherms were best fitted to a single-site model with a 1:1 (protein:ligand) stoichiometry (Figure 5). The equilibrium dissociation constant for NADH (KD^NADH^) is 0.48 ± 0.1 μM, whereas the KD^NAD^+^^ is 29 ± 2 μM. Gibbs free energies (ΔG) of −8.6 and −6.2 kcal/mol were obtained for NADH and NAD^+^ binding, respectively. The formation of each binary complex is exothermic and enthalpically driven, with a ΔH of −29 ± 1 kcal/mol and a TΔS of −20.1 kcal/mol for NADH binding and a ΔH of −10.2 ± 0.3 kcal/mol and a TΔS of −4.0 kcal/mol for NAD^+^ binding.
Coenzyme binding thermodynamics by ITC. (A) Two independent experiments of NADH titrated into an HsBDH2 apoenzyme solution. (B) Two independent experiments of NAD+ titrated into an HsBDH2 apoenzyme solution. All data were collected at 25 °C and pH 7.0 and best fitted to a single-site binding model with a 1:1 (protein:ligand) stoichiometry. The reported thermodynamic parameters are the mean of both experiments with each coenzyme.
Haldane Relationship and Reaction Equilibrium Constant
Assuming a sequential bi-bi kinetic mechanism for HsBDH2, as is the case for several related (R)-3-hydroxybutyrate dehydrogenases,^6,18^ the apparent equilibrium constant (Keq) for the reversible reduction can be calculated from the KD and apparent kcat/KM values using the kinetic Haldane given by eq 7.^19^ An apparent Keq of 13 497 ± 3800 at pH 7.0 and 25 °C was calculated, producing a true Keq of ∼(1.4 ± 0.4) × 10^11^ M^–1^, because the true Keq for this type of reaction is given by the apparent Keq/[H^+^].^20,21^ This points to the formation of cis-4-hydroxy-l-proline as being highly favorable at equilibrium with a ΔG of −15.2 kcal/mol.
Transfer of the Pro-S Hydrogen from NADH
To determine whether HsBDH2 catalyzes the transfer of the pro-S or pro-R hydrogen as a hydride from NADH to 4-oxo-l-proline, stereospecific deuteration of NADH and high-resolution LC-ESI-MS analysis were employed. Both 4S-[4-^2^H]NADH and 4R-[4-^2^H]NADH were enzymatically synthesized, and their masses were confirmed by high-resolution LC-ESI-MS, along with the masses of commercial NADH, 4-oxo-l-proline, and cis-4-hydroxy-l-proline (Figure S9A,B). No cis-4-hydroxy-l-proline was detected when NADH and 4-oxo-l-proline were allowed to react in the absence of HsBDH2 (Figure S9C).
As expected, when NADH and 4-oxo-l-proline react in the presence of HsBDH2, an m/z value of 130.0507 corresponding to cis-4-hydroxy-l-proline is detected, along with NADH and 4-oxo-l-proline (Figure 6A). Upon reaction of 4S-[4-^2^H]NADH and 4-oxo-l-proline in the presence of HsBDH2, an m/z value of 131.0568 is detected in place of an m/z value of 130.0507, which would be predicted if a deuteride were transferred, instead of a hydride, to 4-oxo-l-proline (Figure 6B). On the contrary, when 4R-[4-^2^H]NADH and 4-oxo-l-proline react in the presence of HsBDH2, an m/z value of 130.0507 is again detected, in accordance with a hydride, not a deuteride, being transferred in the reaction. These observations are compatible with HsBDH2 catalyzing the stereospecific transfer of the pro-S hydrogen from NADH to 4-oxo-l-proline.
High-resolution ESI-MS spectra in negative mode of the HsBDH2-catalyzed reaction. (A) MS spectra of the reaction of NADH and 4-oxo-l-proline (4OLP) to form cis-4-hydroxy-l-proline (C4HLP). (B) MS spectra of the reaction of 4S-[4-2H]NADH and 4-oxo-l-proline (4OLP) to form cis-4-hydroxy-l-proline (C4HLP). (C) MS spectra of the reaction of 4R-[4-2H]NADH and 4-oxo-l-proline to form cis-4-hydroxy-l-proline (C4HLP). In all cases, the analyzed ion was [M–H]−.
Rate-Limiting Steps in the HsBDH2-Catalyzed
Reaction
To start to uncover the contributions of different steps to kcat, solvent viscosity effects were evaluated by increasing the fraction of microviscogen glycerol in the reaction mixture (Figure 7A). Each kcat was obtained from 4-oxo-l-proline saturation curves at different glycerol levels (Figure 7A, inset), and a plot of kcat ratios against relative viscosity^22^ (Figure 7A) produced a slope of 0.21 ± 0.02 upon the best fit of the data to eq 8. This points to a modest contribution to the overall rate constant of diffusion of the product from the enzyme.^22^ The macroviscogen polyethylene glycol 8000 (PEG-8000) had no effect on kcat (Figure S10A), suggesting glycerol effects are indeed a result of increased solvent microviscosity.^22^ A plot of kcat/KM^4OLP^ ratios against relative viscosity had a negligible slope of 0.02 ± 0.01 (Figure S10B), which would indicate no diffusional steps contributing to kcat/KM^4OLP^.^22^ However, kcat/KM^4OLP^ was moderately affected by PEG-8000 (Figure S10A), pointing to possible effects beyond microviscosity perturbing the second-order rate constant.
Rate-limiting steps in HsBDH2 catalysis. (A) Solvent viscosity effects on HsBDH2 kcat. Data points are kcat ± fitting error from eq 1. The line is the best fit of the data to eq 8. The inset shows Michaelis–Menten plots in the presence and absence of glycerol, with all data points shown for two independent measurements. Lines are best fits according to eq 1. (B) Approach to steady-state consumption of NADH by HsBDH2. The cyan line shows the data, and the black line is the best fit to eq 9. (C) Single-turnover kinetics of HsBDH2. Blue and pink lines show the data, and black lines are best fits to eq 10.
To shed light on the contribution of the chemical step to HsBDH2 kcat, the approach to the steady-state consumption of NADH was evaluated by rapid kinetics under multiple-turnover conditions. The data indicated a pre-steady-state burst of substrate depletion preceding the steady-state phase (Figure 7B). The best fit of the data to eq 9 produced a burst-phase amplitude of 3 μM, a first-order macroscopic rate constant (kburst) of 43 ± 1 s^–1^ (the sum of all rate constants from the Michaelis complex onward) governing the burst phase, and a first-order macroscopic steady-state rate constant (kSS) of 6.8 ± 0.1 s^–1^. The measured kSS similar to kcat and the observation of the preceding burst indicate steps after chemistry make a larger contribution toward limiting the reaction rate.^23^ The reaction was also monitored under single-turnover conditions with 10 μM HsBDH2, 8.3 μM NADH, and two nearly saturating concentrations of 4-oxo-l-proline (Figure 7C). The best fit of the data to eq 10 yielded single-turnover rate constants (kSTO) of 14.0 ± 0.1 and 15.2 ± 0.1 s^–1^ with 1024 and 2048 μM 4-oxo-l-proline, respectively, suggesting the kSTO reflects a unimolecular rate constant. These kSTO values indicate that the interconversion between HsBDH2:NADH:4OLP and HsBDH2:NAD^+^:C4HLP ternary complexes is at least twice as fast as kcat, also pointing to a step after chemistry contributing the most to the overall reaction rate.
Discussion
The work redefining the activity of HsBDH2 as a 4-oxo-l-proline reductase that generates cis-4-hydroxy-l-proline^7^ has opened the door to the exploration of the biochemistry of this enzyme and its catalyzed reaction in more detail, motivated not only by the elusive biochemical fate of cis-4-hydroxy-l-proline^7^ but also by the anticancer activity of cis-4-hydroxy-l-proline.^9,10^ The characterization of the kinetics and thermodynamics of the reaction presented here provides the first in-depth analysis of the HsBDH2-catalyzed reduction of 4-oxo-l-proline, a crucial step toward elucidating the catalytic mechanism of HsBDH2 and helping inform the future development of specific chemical tools to explore the function of this enzyme in healthy and cancer cells. For instance, the tight binding of NADH poses challenges for compounds aiming to compete with NADH for the enzyme but instead provides an avenue for uncompetitive inhibitors with regard to NADH, which would bind to the HsBDH2:NADH binary complex.
Scheme 2 summarizes the proposed kinetic sequence for HsBDH2 based on findings reported in this work, along with the rate constants measured here and the reaction steps they encompass under conditions under which accumulation of the free product is negligible. While the kinetic mechanism could in theory still be random, the ordered mechanism with NADH as the first substrate to bind and NAD^+^ as the last product to dissociate is likely operational in practice. This is supported by the following observations: tight binding between the enzyme and NADH that leads to purification of the HsBDH2:NADH complex, the ability of NAD^+^ to bind to the apoenzyme, and the very high KM for cis-4-hydroxy-l-proline in the reverse reaction direction.
Proposed Kinetic Sequence for the HsBDH2 Reaction and Associated Rate Constants
The group with an apparent pKa of 7.3 that must be deprotonated for the optimum binding of 4-oxo-l-proline to HsBDH2 and/or catalysis may be either an enzyme residue or the substrate itself, for instance, the α-amino group of 4-oxo-l-proline. The putative pKa of 8.7 for a group that must be protonated for maximum binding and/or catalysis falls in the range of the catalytic triad Tyr residue in SDRs,^24^ which often act as general acids to donate a proton to the substrate during the reduction reaction.^6,24^ Future site-directed mutagenesis studies on HsBDH2 may further inform the role of acid–base catalysis in the reaction.
The establishment of the stereochemistry of hydride donation as the pro-S hydrogen being transferred from NADH matches that of related (R)-3-hydroxybutyrate dehydrogenases^6^ and β-ketoacyl-ACP reductases,^24,25^ SDR enzymes that also catalyze NAD(P)H-dependent reductions of carbonyl groups. This is also compatible with the crystal structure of NAD^+^-bound HsBDH2, as the orientation of the nicotinamide moiety would position it opposite the docked substrate (R)-3-hydroxybutyrate in an arrangement conducive to transfer of the pro-S hydrogen between the two molecules.^1^
HsBDH2 binds tightly to NADH at 25 °C (KD = 0.48 μM), reminiscent of other NAD(P)H-dependent reductases, the most studied of which is dihydrofolate reductase (DHFR), with a KD of 0.33 μM reported for E. coli DHFR.^26^ At 5 °C, the koff of 0.13 s^–1^ leads to co-purification of NADH with HsBDH2, while at 25 °C, it increases to 7.2 s^–1^, in range of the koff for NADPH found for E. coli DHFR (3.5 s^–1^)^26^ and for Mycobacterium tuberculosis DHFR (1.7 s^–1^), although in the latter example NADPH dissociates from the ternary complex with one of the products.^27^ It should be pointed out that the competition experiments carried out here yield an overall koff for NADH and do not inform the number of steps in the dissociation mechanism.^17^
Intriguingly, the HsBDH2 Tm of ∼44 °C in the absence of added NADH is close to the physiological temperature of 37 °C, and some denaturation could be expected at this temperature. This problem is likely solved by the thermostability conferred upon binding to NADH. The Tm of ∼33 °C of the HsBDH2 apoenzyme falls below the physiological temperature, but it is stabilized to ∼47 °C in the presence of 1.2 mM NAD^+^. The combined concentration of NADH and NAD^+^ in a mammalian cell is estimated to vary between 0.3 and 1.0 mM,^28^ and NADH/NAD^+^ ratios between 1/10 and 1/700,^29,30^ as reported by Walsh et al.^31^ In the cytoplasm, where HsBDH2 is localized in the cell,^1,2,7^ the estimated ratio is between 1/700 and 1/800, as most of the NADH is found in mitochondria.^32^ Assuming that this extends to human cells, the lowest expected NADH levels would yield ∼0.38 μM NADH (just below the HsBDH2 KD at 25 °C) and ∼300 μM NAD^+^ (∼10-fold greater than the HsBDH2 KD at 25 °C), and the highest expected levels would lead to 1.45 μM NADH (∼3-fold greater than the HsBDH2 KD at 25 °C) and ∼1 mM NAD^+^ (∼34-fold greater than the HsBDH2 KD at 25 °C). Therefore, HsBDH2 may have evolved to be always bound to either NAD^+^ or, to a lesser extent, NADH in the cell, which might explain the significant increase in thermostability resulting from coenzyme binding. High thermostability upon NADH binding is also a feature of a cold-adapted (R)-3-hydroxybutyrate dehydrogenase.^33^ In E. coli, the estimated NADH concentration is ∼83 μM,^34^ enough to saturate recombinant HsBDH2.
Pre-steady-state kinetic analysis under multiple- and single-turnover conditions indicates that a slow step after hydride transfer contributes to the HsBDH2 kcat. This step may be associated with product release, and a modest contribution to the reaction rate from diffusion of one of the products from the enzyme is inferred from solvent viscosity effects. This scenario was also found with cold- and warm-adapted orthologues of (R)-3-hydroxybutyrate dehydrogenase catalyzing the reduction of their physiological substrate acetoacetate.^33^ It should be pointed out that even the kSTO measured for HsBDH2 reflects the rate of interconversion between ternary complexes with substrates and products and might not reflect the rate of chemistry itself. For instance, with (R)-3-hydroxybutyrate dehydrogenases, even kSTO may have contributions from physical steps (e.g., conformational changes), as revealed by pre-steady-state kinetic isotope effects.^35^ Future isotope effect studies will be useful in establishing the mechanism of hydride transfer by HsBDH2 and its contribution to the overall reaction rate.
Conclusions
In summary, HsBDH2 binds tightly to NADH, which imparts temperature stability to the enzyme, and transfers the C4 pro-S hydrogen from the coenzyme to 4-oxo-l-proline to generate cis-4-hydroxy-l-proline, a compound with known anticancer properties. The interconversion of the ternary complexes of the enzyme and substrates and the enzyme and products is faster than at least one subsequent step, which has a modest contribution from product diffusion. To unveil details of the chemical step and its contribution to the limiting kcat, kinetic deuterium isotope effect studies may prove to be valuable.
The reference list from the paper itself. Each links out to its DOI / PubMed record.
- 1Guo K.; Lukacik P.; Papagrigoriou E.; Meier M.; Lee W. H.; Adamski J.; Oppermann U. Characterization of Human DHRS 6, an Orphan Short Chain Dehydrogenase/Reductase Enzyme: A Novel, Cytosolic Type 2 R-B-Hydroxybutyrate Dehydrogenase. J. Biol. Chem. 2006, 281, 10291–10297. 10.1074/jbc.M 511346200.16380372 · doi ↗ · pubmed ↗
- 2Devireddy L. R.; Hart D. O.; Goetz D. H.; Green M. R. A Mammalian Siderophore Synthesized by an Enzyme with a Bacterial Homolog Involved in Enterobactin Production. Cell 2010, 141, 1006–1017. 10.1016/j.cell.2010.04.040.20550936 PMC 2910436 · doi ↗ · pubmed ↗
- 3Akagashi M.; Watanabe S.; Kwiatkowski S.; Drozak J.; Terawaki S. I.; Watanabe Y. Crystal Structure of L-2-Keto-3-Deoxyfuconate 4-Dehydrogenase Reveals a Unique Binding Mode as a α-Furanosyl Hemiketal of Substrates. Sci. Rep. 2024, 14, 1460210.1038/s 41598-024-65627-8.38918500 PMC 11199699 · doi ↗ · pubmed ↗
- 4Kavanagh K. L.; Jornvall H.; Persson B.; Oppermann U. Medium- and Short-Chain Dehydrogenase/Reductase Gene and Protein Families: the SDR Superfamily: Functional and Structural Diversity Within a Family Of Metabolic and Regulatory Enzymes. Cell. Mol. Life Sci. 2008, 65, 3895–3906. 10.1007/s 00018-008-8588-y.19011750 PMC 2792337 · doi ↗ · pubmed ↗
- 5Filling C.; Berndt K. D.; Benach J.; Knapp S.; Prozorovski T.; Nordling E.; Ladenstein R.; Jörnvall H.; Oppermann U. Critical Residues for Structure and Catalysis in Short-Chain Dehydrogenases/Reductases. J. Biol. Chem. 2002, 277, 25677–25684. 10.1074/jbc.M 202160200.11976334 · doi ↗ · pubmed ↗
- 6Machado T. F. G.; Purg M.; Mc Mahon S. A.; Read B. J.; Oehler V.; Åqvist J.; Gloster T. M.; da Silva R. G. Dissecting The Mechanism Of (R)-3-Hydroxybutyrate Dehydrogenase by Kinetic Isotope Effects, Protein Crystallography, and Computational Chemistry. ACS Catal. 2020, 10, 15019–15032. 10.1021/acscatal.0c 04736.33391858 PMC 7773212 · doi ↗ · pubmed ↗
- 7Kwiatkowski S.; Bozko M.; Zarod M.; Witecka A.; Kocdemir K.; Jagielski A. K.; Drozak J. Recharacterization of the Mammalian Cytosolic Type 2 (R)-β-Hydroxybutyrate Dehydrogenase as 4-Oxo-L-Proline Reductase (EC 1.1.1.104). J. Biol. Chem. 2022, 298, 10170810.1016/j.jbc.2022.101708.35150746 PMC 8914325 · doi ↗ · pubmed ↗
- 8Adams E.; Frank L. Metabolism of Proline and the Hydroxyprolines. Annu. Rev. Biochem. 1980, 49, 1005–1061. 10.1146/annurev.bi.49.070180.005041.6250440 · doi ↗ · pubmed ↗