Using the socioecological model to explore factors associated with obesity among reproductive age women
Amanda Gilbert, Alicia Persaud, Sarah Farabi, Cindy Schwarz, Debra Haire-Joshu, Rachel G. Tabak

TL;DR
This study explores factors linked to obesity in women of reproductive age, finding that physical activity and food insecurity are significant individual-level factors.
Contribution
The study applies the socioecological model to identify individual-level factors associated with obesity in reproductive-age women.
Findings
High/moderate physical activity was associated with lower odds of obesity compared to being overweight.
Food insecurity was significantly linked to increased odds of obesity.
Interpersonal and environmental factors showed no significant associations with obesity in this sample.
Abstract
Women of reproductive age (18–44 years) are at an increased risk of developing obesity due to pregnancy, life-transitions, and marginalization. Obesity in women negatively affects women’s health and pregnancy outcomes and can increase risk their children will develop obesity. Less is known about obesity risk at the interpersonal and environmental levels for women of reproductive age. This study uses the socioecological model to explore women’s obesity risk across ecological levels. A secondary cross-sectional analysis was conducted using baseline data (March 2019–June 2022) from the cluster-randomized Healthy Eating and Active Living Taught at Home (HEALTH) Dissemination and Implementation study. Descriptive statistics and multivariate logistic regression models were used to determine associations between individual, interpersonal, and environmental level factors with weight status…
Genes, proteins, chemicals, diseases, species, mutations and cell lines named across the full text — each resolved to its canonical identifier and authoritative record.
Click any figure to enlarge with its caption.
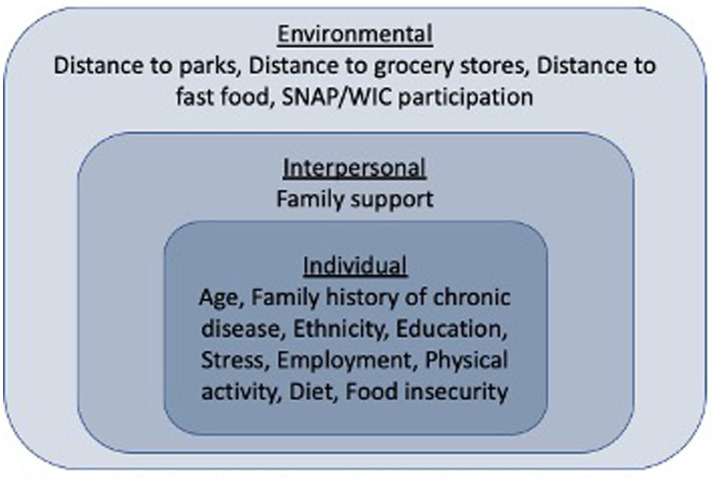 Figure 1
| Sample | BMI overweight | BMI obese | ||
|---|---|---|---|---|
| Sample | 82 (37.10) | 139 (62.90) | ||
| Individual level | ||||
| Age, m (SD) | 30.70 (5.72) | 29.82 (5.41) | 31.22 (5.86) | 0.08 |
| Family history of chronic disease, n (%) | 0.03 | |||
| No/not sure | 43 (19.46) | 22 (26.83) | 21 (15.11) | |
| Yes | 178 (80.54) | 60 (73.17) | 118 (84.89) | |
| Ethnicity, n (%) | 0.03 | |||
| Not Hispanic/Latino | 126 (57.01) | 39 (47.56) | 87 (62.59) | |
| Hispanic/Latino | 95 (42.99) | 43 (52.44) | 52 (37.41) | |
| Education, n (%) | 0.26 | |||
| High school graduate or less | 113 (51.13) | 46 (56.10) | 67 (48.20) | |
| Some college or more | 108 (48.87) | 36 (43.90) | 72 (51.80) | |
| Stress, n (%) | 0.81 | |||
| Low stress | 127 (57.47) | 48 (58.54) | 79 (56.83) | |
| High stress | 94 (42.53) | 34 (41.46) | 60 (43.17) | |
| Employment, n (%) | 0.23 | |||
| Employed | 95 (42.99) | 31 (37.80) | 64 (46.04) | |
| Not employed | 126 (57.01) | 51 (62.20) | 75 (53.96) | |
| Physical Activity, n (%) | 0.01 | |||
| Low | 110 (49.77) | 32 (39.02) | 78 (56.12) | |
| Moderate/High | 111 (50.23) | 50 (60.98) | 61 (43.88) | |
| Predicted intake of whole grains (ounce equivalents) per day, m (SD) | 0.58 (0.31) | 0.58 (0.32) | 0.57 (0.30) | 0.89 |
| Predicted intake of total added sugars (tsp equivalents) per day, m (SD) | 18.4 (9.73) | 17.73 (7.83) | 18.78 (10.71) | 0.44 |
| Predicted intake of fruits and vegetables including legumes and French fries (cups) per day, m (SD) | 2.42 (0.65) | 2.53 (0.67) | 2.36 (0.64) | 0.07 |
| Food insecurity, n (%) | 0.03 | |||
| Food secure | 136 (61.54) | 58 (70.73) | 78 (56.12) | |
| Food insecure | 85 (38.46) | 24 (29.27) | 61 (43.88) | |
| Interpersonal level | ||||
| Family support, m (SD) | 1.72 (0.51) | 1.68 (0.53) | 1.74 (0.51) | 0.37 |
| Environmental level | ||||
| Walking distance to nearest Fast food, n (%) | 0.52 | |||
| 20 min or less | 114 (51.58) | 40 (48.78) | 74 (53.24) | |
| More than 20 min | 107 (48.42) | 42 (51.22) | 65 (46.76) | |
| Walking distance to nearest grocery store, n (%) | 0.89 | |||
| 20 min or less | 93 (42.08) | 35 (42.68) | 58 (41.73) | |
| More than 20 min | 128 (57.92) | 47 (57.32) | 81 (58.27) | |
| Walking distance to nearest park, n (%) | 0.67 | |||
| 20 min or less | 147 (66.52) | 56 (68.29) | 91 (65.47) | |
| More than 20 min | 74 (33.48) | 26 (31.71) | 48 (34.53) | |
| SNAP/WIC participation, n (%) | 0.20 | |||
| No/not sure | 49 (22.17) | 22 (26.83) | 27 (19.42) | |
| Yes | 172 (77.83) | 60 (73.17) | 112 (80.58) | |
| OR | 95% CI | |
|---|---|---|
| Family history of chronic disease | ||
| No/Not sure (reference) | ||
| Yes | 2.01 | [0.95,4.25] |
| Hispanic/Latino | ||
| Not Hispanic/Latino (reference) | ||
| Hispanic/Latino | 0.57 | [0.31,1.03] |
| Physical Activity | ||
| Low physical activity (reference) | ||
| Moderate/High physical activity | 0.47* | [0.26,0.84] |
| Food insecurity | ||
| Food secure (reference) | ||
| Food insecure | 2.51** | [1.33,4.71] |
| Observations | 221 | |
| Pseudo | 0.07 | |
Peer Reviews
No public reviews on file for this paper yet. If you reviewed it on a platform where reviews are public (OpenReview, ICLR, NeurIPS, ICML), you can paste yours below so the community can read it here.
Videos
No videos yet. Explain this paper in a talk, walkthrough, or lecture? Add one.
Taxonomy
TopicsObesity, Physical Activity, Diet · Obesity and Health Practices · Food Security and Health in Diverse Populations
Introduction
1
Women of reproductive age (18–44) are at a greater risk for weight gain and obesity and experience disparities in obesity leading to health inequities (1–4). Women in this age group face unique obesity risks due to stresses such as pregnancy, parenthood, life transitions (e.g., leaving home, jobs, marriage), and social disadvantage (5–9). As of 2022, 33% of women aged 18–44 years old had obesity, with the age-adjusted prevalence of severe obesity (BMI > 30 kg/m^2) among adult women at 13%, double the rate for men (2, 10). Further, Black and Hispanic women age 20 and older experience higher rates of obesity at 57 and 44% respectively, compared to white women (40%) (1). These disparities are a result of systemic and historical racism that impact social determinants of health (SDOH) leading to higher social needs including chronic stress, unequal access to nutrient-dense foods and safe places to engage in physical activity, and fewer economic and social resources (3, 5, 11–16). High rates of obesity and disparities across race and ethnicity have health equity implications since obesity is associated with adverse health outcomes such as Type 2 diabetes mellitus, hypertension, dyslipidemia, coronary heart disease, chronic obstructive pulmonary disease, and poor pregnancy outcomes (17–20).
Healthy Eating and Active Living Taught at Home (HEALTH) is an effective, evidence-based intervention for obesity prevention among women of reproductive age (21). HEALTH embeds healthy eating and active living content adapted from the Diabetes Prevention Program into the Parents as Teachers (PAT) national home visiting organization, which has significant reach among women from pregnancy until the child is in kindergarten (22). Dissemination and implementation of HEALTH through The Healthy Eating and Active Living Taught at Home Dissemination and Implementation study (HEALTH D&I) holds promise for impacting the secular trends described above through the prevention of weight gain and promotion of weight loss (23). Examining data collected at baseline of the HEALTH D&I study provides a unique opportunity to explore factors associated with weight gain among women of reproductive age. In particular, the geographic, ethnic, and socioeconomic diversity of participants in the trial offers a unique opportunity to fill a gap in exploring these relationships in a group underrepresented in research.
To explore obesity risk factors within baseline data from HEALTH D&I, this analysis will utilize the socioecological model which represents the ecological theory of a particular health behavior or outcome (24). It demonstrates how several factors that interact at both macro- and micro-levels affect a person’s health and well-being (25). Socioecological theory is conceived in obesity research as being influenced by factors on the individual (e.g., genetics, health behaviors), interpersonal (e.g., parent–child relationship, family support), and neighborhood/community or environmental level (e.g., food availability, safe places to engage in physical activity) (26). The socioecological model aids in considering health equity when exploring obesity risk factors within this population. It underscores multiple levels of influence on obesity risk and the importance of looking at drivers of obesity risk beyond the individual level. Therefore, this secondary analysis of baseline data aims to explore factors across ecological levels (individual, interpersonal, environmental) associated with obesity among this population of women underrepresented in research.
Materials and methods
2
Study design
2.1
This study is a secondary cross-sectional analysis of baseline data from the HEALTH D&I study. A detailed description of HEALTH D&I methods can be accessed through the protocol paper (23). This study uses baseline data collected by research staff from a survey administered by telephone (during COVID) and on an iPad and in person (before COVID). Baseline data was collected from March 2019 to June 2022. Data collected in the survey ranged from demographic information, cardiometabolic health, health behaviors, food, and home environment, to social needs. The study was approved by the Washington University in St. Louis institutional review board.
Measures
2.2
Dependent variable
2.2.1
The main outcome measure in this study was a binary measure of overweight (reference) compared to obese. Obesity was measured using self-reported height, and weight measured on an electric scale to calculate body mass index (BMI). Weight was measured in person before COVID and over video call or phone with photos of the scale during COVID. BMI measures excess weight by calculating the weight in kilograms over height in meters squared (27). Based on BMI cut points, participants with BMI ranging from 25 kg/m^2 to 29.9 kg/m^2 were considered to be in the overweight BMI category and participants with BMI 30 kg/m^2 or more were considered to be in the obesity BMI category (27). Inclusion criteria for HEALTH D&I was BMI between 25 and 45.
Independent variables
2.2.2
The independent variables in this study were chosen based on empirical research (e.g., systematic reviews) (3, 6, 17) around correlates of obesity and guided by the levels of the Socioecological model (individual, interpersonal, environmental). (Figure 1).
Socioecological model of predictors of obesity in women of reproductive age.
Individual level measures included age as a continuous variable (18–45), family history of chronic disease (Yes, No/Not sure), ethnicity (Hispanic/Latino, Not Hispanic or Latino), education (High school graduate or less, Some college more), stress (High, Low), employment (Employed, Not employed), physical activity (High/Moderate, Low), dietary habits as continuous variables (Ounces of whole grains a day, Teaspoons of added sugar a day, Cups of fruits and vegetables a day), and food insecurity (Food insecure, Food secure). Family history of chronic disease was based on whether participants reported a family history of diabetes, heart disease, or high blood pressure. Stress was measured using the perceived stress scale-4 (PSS-4) (28). The PSS-4 is the shortest version of the perceived stress scale, supporting use in surveys for minimizing respondent burden. This measure is widely used and though not as sensitive as the longer versions, has adequate reliability and strong criterion and construct validity (29–34). Cronbach’s alpha was 0.71. No cut points are indicated for high and low stress so the mean was used to dichotomize stress into a binary variable. Physical activity was measured using the International Physical Activity Questionnaire (IPAQ) (35). The IPAQ has been shown to have moderately high reliability and validity across diverse settings and populations (35–37). Additionally, the IPAQ has similar validity to other self-report measures (35). High physical activity represents an hour or more of activity a day that is at least of moderate intensity. Moderate physical activity is around half an hour of moderate physical activity most days. Low physical activity means the participant did not meet criteria for moderate or high physical activity (35). For analysis, physical activity was dichotomized into high/moderate and low. Dietary habits were measured using the National Health and Nutrition Examination Survey Dietary Screener Questionnaire (DSQ) which assess frequency of food (e.g., fruits, vegetables, whole grains, added sugar) and drink (e.g., sugar sweetened beverages) intake in the previous month (38). The DSQ has been widely tested and shows good validity when compared to other food recall measures (39–44). Food insecurity was measured using a two-item food insecurity measure developed by the United States Department of Agriculture Economic Research Service (45). The items have been tested for validity and reliability and are shown to accurately identify food insecurity (45–48). Survey items ask participants to indicate if in the last 12 months it was often true, sometimes true, or never true that “We worried whether food would run out before we got money to buy more” and “The food we bought just did not last, and we did not have money to get more.” (49) If participants answered “often” or “sometimes true” to both questions, they were considered food insecure.
The interpersonal level measure was family support as measured by the family support scale in the Home Environment Questionnaire (α = 0.63) (50). The family support measure was initially developed by Sallis et al. and has been used in the Home Environment Questionnaire with good validity and reliability for measuring social support specific to health behaviors (51–54). An example of family support questions include, in the last month how often did people living in your household do the following; encourage you to avoid unhealthy foods, discuss your eating habits with you, remind you to eat fruit and vegetables, and bring home foods you are trying to avoid. Participants responded with never/rarely, occasionally, often, or very often. The mean of all questions combined was used to create a continuous score, with higher scores indicating higher family support.
Environment level measures included walking distance (20 min or less, More than 20 min) to the nearest fast food, grocery store, and park, and participation in the Supplemental Nutrition Assistance Program (SNAP) and/or the Special Supplemental Nutrition Program for Women, Infants, and Children (WIC) (Yes, No/not sure).
Analysis
2.3
For the analysis, descriptive statistics were calculated for the outcome variable of BMI, and all independent variables for the total sample and for both BMI categories (overweight and obese). T-tests and Chi-squared tests were used to determine whether relationships between each independent variable and the outcome of BMI were significant. Variables that were significantly correlated with BMI, were included in a multivariate logistic regression model to determine the association of these variables with BMI. All quantitative analyses use Stata Version 17.
Results
3
In the analytic sample (n = 221), 37% of participants were overweight and 63% had obesity. (Table 1) The mean age was 31 (SD = 5.72) years old. Almost half of the sample (43%) identified as Hispanic or Latino and most (81%) reported a family history of chronic disease. Fifty-one percent of participants had a high school degree or less and 57% were not employed. Half of participants (50%) had low levels of physical activity, 43% had high stress, and 38% reported food insecurity. The mean predicted daily intake of added sugars was 18.4 (SD = 9.73) teaspoons, while the mean intake of whole grains was 0.58 (SD = 0.31) ounces, and mean intake of fruit and vegetables was 2.42 (SD = 0.65) cups. At the interpersonal level, mean score of family support was 1.72 (SD = 0.51). In terms of the environmental level variables, 52% of participants were within 20 min walking distance to the nearest fast-food outlet, while 58% had to walk more than 20 min to get to the nearest grocery store. The nearest park was more than a 20-min walk for 33% of participants. In total, 78% of participants participated in WIC and/or SNAP.
Table 1 indicates results from bivariate analyses of each independent variable with the outcome of BMI category (likelihood of overweight or obesity). At the individual level, family history of chronic disease (x^2^(1) = 4.52, p = 0.03), ethnicity (x^2^(1) = 4.75, p = 0.03), physical activity (x^2^(1) = 6.03, p = 0.01), and food insecurity (x^2^(1) = 4.66, p = 0.03) were significantly associated with BMI category (27). None of the variables at the interpersonal or environmental levels were significantly associated with BMI.
The multivariate logistic regression model consisted of all four variables with significant associations in the bivariate analysis (family history of chronic disease, ethnicity, physical activity, and food insecurity); these were all four at the individual level (Table 2). This final model accounted for 7% (adjusted R(2) = 0.07) of variability in the odds of being in one BMI category or another. Family history of chronic disease and ethnicity were no longer statistically significantly associated with BMI category. Participants with high/moderate physical activity were 53% less likely to have obesity (OR = 0.47, 95% CI: 0.26,0.84, p = 0.01) than be overweight compared to participants who had low levels of physical activity. Participants who had food insecurity were 151% more likely to have obesity (OR = 2.51, 95% CI: 1.33,4.71, p = 0.00) than to be overweight compared to those who were food secure.
Discussion
4
In the present study, we applied the socioecological model to investigate individual, interpersonal, and environmental factors that are thought to be related to BMI status in a population of women of reproductive age underrepresented in research. We found that among this sample of women who are overweight or have obesity, individual level factors, but not interpersonal or environmental factors, were related to the risk of obesity (relative to overweight). Specifically, spending more time engaging in moderate or high intensity physical activity was associated with a lower risk of having obesity, while food insecurity was associated with a higher risk of having obesity. Our findings on physical activity and food insecurity are in line with previous research showing a relationship between physical activity and food insecurity with obesity (55, 56).
In our sample, 38% reported food insecurity and 78% received assistance from WIC and/or SNAP. This is important as we found that food insecurity was one of the strongest predictors of increased risk of obesity compared to overweight. This finding is similar to results from previous studies (56), and supports research which has explored mechanisms through which food insecurity can increase risk of obesity (57–59). Our results highlight the continued importance of assessing and addressing SDOH as a method of decreasing obesity risk, especially among those who identify as Hispanic/Latino and who are in low-socioeconomic positions. In our sample, 43% identified as Hispanic/Latino and 51% had an education level of high school graduate or less. It should be noted that the question in our study assessed food insecurity at the individual level (e.g., ability to afford food). However, our finding may reflect SDOH or environmental level determinants such as economic stability and neighborhood food and physical environment (14), beyond what was measured in the current study with walking distance to the nearest park, fast food, and grocery store. For example, the ability to afford enough healthy food can be driven by SDOH such as economic stability (e.g., employment, education, debt) as well as access, acceptability, and availability of healthy affordable food (e.g., neighborhood food environment) (60).
Time spent engaging in high/moderate physical activity was associated with a lower risk of having obesity. The association between physical activity with a reduced risk of obesity is evident in previous research (55). Our findings add support that in an ethnically and socioeconomically underrepresented population of women of reproductive age, engaging in physical activity, is related to reduced weight. This finding is important for obesity prevention efforts among women of reproductive age. While 50% of participants in our study reported moderate/high physical activity, previous research indicates physical activity may decrease with parenthood (61).
Our results that the interpersonal and environmental level factors were not related to the risk of obesity (relative to overweight) are different from previous research which finds interpersonal factors (e.g., social support) and environmental level factors (e.g., physical activity and healthy food opportunities in the neighborhood) are associated with obesity (6, 14, 60, 62). These different results may be due to how interpersonal and environmental level factors were measured. Specifically, the physical activity and food environment was measured through a single metric of distance to the nearest park, grocery store, and fast-food outlet. Other interpersonal and environmental factors such as walkability, safety, social norms around eating and activity, neighborhood aesthetics, and public transit were not included. Previous research underscores the complexity of measuring environmental level determinants of obesity and health behaviors (63–65). In particular, it is challenging to tease apart the cumulative and interacting elements of the neighborhood environment and ways these elements influence behavior.
Limitations
5
Our study is not without limitations. We used BMI which is an indirect measure of obesity and therefore may not accurately determine overweight or obesity at the individual level (66). BMI is also modeled on white adults and may not necessarily translate to other races and ethnicities, introducing bias into the measure (27). This is especially salient for this study in which 43% of the participants identify as Hispanic and Latino. This was a cross-sectional analysis so it does not allow for causal determinations, but our findings do provide support for future longitudinal and/or experimental studies to investigate how modifiable factors such as food insecurity and physical activity could reduce obesity risk. We had limited measures at the environmental level (e.g., walking distance to nearest park, grocery store, and fast-food outlet), and broader factors like racism and discrimination, which could influence the results, were also not measured. We used the perceived stress scale to measure stress among participants in the study. While this scale has been validated for use in diverse populations, it may not adequately assess the stress experienced by populations who have experienced marginalization (67). Our small sample size and secondary analysis may have reduced our ability to detect significant associations. Lastly, due to an ICC of less than 0.01 for the outcome of BMI, we were unable to run a multilevel model.
Conclusion
6
In conclusion, our findings support that food insecurity and physical activity may be important factors associated with obesity relative to overweight in women of reproductive age. Interventions and policies for addressing obesity in this population may be effective by targeting health behaviors like physical activity and drivers of food insecurity. Our study contributes knowledge about obesity risk across ecological levels for women who identify as Hispanic/Latino and those of low-socioeconomic status of reproductive age, a population that is less represented in research.
The reference list from the paper itself. Each links out to its DOI / PubMed record.
- 1Hales CM Carroll MD Fryar CD Ogden CL. Prevalence of obesity and severe obesity among adults: United States, 2017–2018. Hyattsville, MD: National Center for Health Statistics (2020).
- 2America’s Health Rankings. Health of women and children report. (2024). Available at: https://www.americashealthrankings.org/learn/reports/2024-health-of-women-and-children-report (Accessed November 15, 2024).
- 3Min J Goodale H Xue H Brey R Wang Y. Racial-ethnic disparities in obesity and biological, behavioral, and sociocultural influences in the United States: a systematic review. Adv Nutr. (2021) 12:1137–48. doi: 10.1093/advances/nmaa 162, PMID: 33427291 PMC 8433490 · doi ↗ · pubmed ↗
- 4Lofton H Ard JD Hunt RR Knight MG. Obesity among African American people in the United States: a review. Obesity. (2023) 31:306–15. doi: 10.1002/oby.23640, PMID: 36695059 PMC 10107750 · doi ↗ · pubmed ↗
- 5Novak M Ahlgren C Hammarström A. A life-course approach in explaining social inequity in obesity among young adult men and women. Int J Obes. (2006) 30:191–200. doi: 10.1038/sj.ijo.0803104, PMID: 16172616 · doi ↗ · pubmed ↗
- 6Bower KM Thorpe RJ Yenokyan G Mc Ginty EEE Dubay L Gaskin DJ. Racial residential segregation and disparities in obesity among women. J Urban Heal New York Acad Med. (2015) 92:843–52. doi: 10.1007/s 11524-015-9974-z, PMID: 26268731 PMC 4608933 · doi ↗ · pubmed ↗
- 7Kumanyika SK Obarzanek E Stettler N Bell R Field AE Fortmann SP. Population-based prevention of obesity: the need for comprehensive promotion of healthful eating, physical activity, and energy balance: a scientific statement from American Heart Association Council on epidemiology and prevention. Interdiscip Commi Circul. (2008) 118:428–64. doi: 10.1161/CIRCULATIONAHA.108.189702, PMID: 18591433 · doi ↗ · pubmed ↗
- 8Zheng Y Manson JE Yuan C. Associations of weight gain from early to middle adulthood with major health outcomes later in life. JAMA. (2017) 318:255–69. doi: 10.1001/jama.2017.7092, PMID: 28719691 PMC 5817436 · doi ↗ · pubmed ↗