Association between Helicobacter pylori infection, serum thyroid-stimulating hormone, and thyroxine in the National Health and Nutrition Examination Survey 1999–2000
Ting Lu, Shunshun Lu, Jieqiong Lin, Xiaona Shao, Dahua Chen, Jianwei Shen

TL;DR
This study found that Helicobacter pylori infection is linked to lower thyroid-stimulating hormone and higher thyroxine levels, especially in men and older adults.
Contribution
The study identifies a novel association between H. pylori infection and thyroid hormone levels in a US population sample.
Findings
H. pylori seropositivity correlates with lower TSH and higher T4 levels.
The association is stronger in men and individuals over 68 years old.
A non-linear relationship exists between TSH levels and H. pylori infection.
Abstract
Helicobacter pylori has been increasingly implicated in extra-gastric diseases. Current evidence regarding the association between serum thyroid-stimulating hormone (TSH), thyroxine (T4), and H. pylori infection remains inconclusive. Consequently, this study aimed to explore the correlation between TSH and T4 levels and H. pylori infection in a US-based population sample. Data from the US National Health and Nutrition Examination Survey (NHANES), comprising 971 participants aged 30–85 years from 1999 to 2000, were analyzed. Binary logistic regression was employed to analyze the correlation between H. pylori and TSH and T4 levels. The impact of TSH and T4 on H. pylori infection was further assessed using restricted cubic spline (RCS) analysis. In addition, subgroup analyses stratified by sex and age were conducted. Subjects with H. pylori seropositivity demonstrated lower serum TSH…
Genes, proteins, chemicals, diseases, species, mutations and cell lines named across the full text — each resolved to its canonical identifier and authoritative record.
Click any figure to enlarge with its caption.
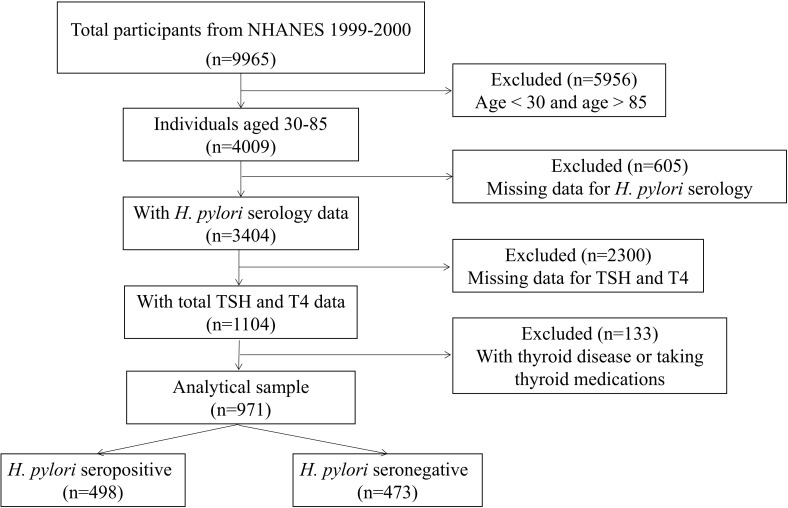 Figure 1
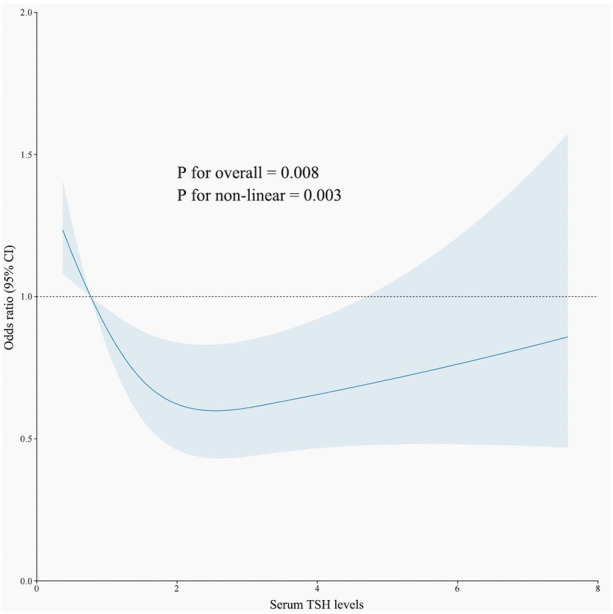 Figure 2
|
|
|
| |
|---|---|---|---|
| Age (years) | 56.0 (42.0–68.0) | 52.0 (39.0–67.5) |
|
| Sex | 0.168 | ||
| Male | 260 (52.2%) | 226 (47.8%) | |
| Female | 238 (47.8%) | 247 (52.2%) | |
| Race |
| ||
| Mexican American | 197 (39.5%) | 55 (11.6%) | |
| Other Hispanic | 39 (7.8%) | 9 (1.9%) | |
| Non-Hispanic white | 132 (26.5%) | 335 (70.8%) | |
| Non-Hispanic black | 111 (22.2%) | 65 (13.7%) | |
| Other races | 19 (3.8%) | 9 (1.9%) | |
| Educational level |
| ||
| Less than high school | 277 (55.6%) | 108 (22.8%) | |
| High school | 92 (18.4%) | 120 (25.3%) | |
| More than high school | 128 (5.7%) | 244 (51.5%) | |
| Others | 1 (0.2%) | 1 (0.2%) | |
| BMI | 27.78 (24.58–31.59) | 27.27 (24.06–31.96) | 0.317 |
| Homocysteine (μmol/L) | 8.14 (6.45–10.20) | 7.69 (6.29–9.88) | 0.055 |
| Serum TSH (IU/mL) | 1.48 (1.02–2.15) | 1.64 (1.13–2.43) |
|
| Serum T4 (nmol/L) | 97.80 (84.90–113.30) | 92.70 (83.70–108.10) |
|
| Smoking behavior | 0.21 | ||
| Never | 203 (40.8%) | 194 (41.0%) | |
| Some days | 113 (22.7%) | 116 (24.5%) | |
| Every day | 182 (36.5%) | 163 (34.5%) | |
| Alcohol behavior | 0.749 | ||
| Yes | 332 (66.7%) | 322 (68.1%) | |
| No | 166 (33.3%) | 151 (31.9%) |
| TSH | Model 1 | Model 2 | Model 3 | |||
|---|---|---|---|---|---|---|
| OR (95% CI) |
| OR (95% CI) |
| OR (95% CI) |
| |
| Q1 | Ref | Ref | Ref | |||
| Q2 | 0.731 (0.511–1.046) | 0.087 | 0.715 (0.499–1.026) | 0.068 | 0.701 (0.477–1.032) | 0.072 |
| Q3 | 0.780 (0.545–1.117) | 0.175 | 0.758 (0.528–1.087) | 0.132 | 0.775 (0.525–1.140) | 0.195 |
| Q4 | 0.579 (0.403–0.831) | 0.003 | 0.544 (0.377–0.786) | 0.001 | 0.580 (0.389–0.866) | 0.008 |
| T4 | Model 1 | Model 2 | Model 3 | |||
|---|---|---|---|---|---|---|
| OR (95% CI) |
| OR (95% CI) |
| OR (95% CI) |
| |
| Q1 | Ref | Ref | Ref | |||
| Q2 | 0.865 (0.601–1.245) | 0.434 | 0.885 (0.614–1.278) | 0.515 | 0.886 (0.597–1.316) | 0.549 |
| Q3 | 1.161 (0.810–1.666) | 0.416 | 1.211 (0.840–1.747) | 0.305 | 1.252 (0.842–1.862) | 0.267 |
| Q4 | 1.483 (1.033–2.129) | 0.033 | 1.552 (1.076–2.238) | 0.019 | 1.004 (0.981–1.026) | 0.048 |
| Subgroup | TSH | Model 1 | Model 2 | Model 3 | |||
|---|---|---|---|---|---|---|---|
| OR (95% CI) |
| OR (95% CI) |
| OR (95% CI) |
| ||
| Male | Q1 | Ref | Ref | Ref | |||
| Q2 | 0.621 (0.373–1.035) | 0.068 | 0.614 (0.368–1.024) | 0.062 | 0.611 (0.339–1.013) | 0.102 | |
| Q3 | 0.595 (0.355–0.997) | 0.049 | 0.584 (0.348–0.980) | 0.042 | 0.675 (0.370–1.233) | 0.202 | |
| Q4 | 0.494 (0.294–0.831) | 0.008 | 0.465 (0.273–0.792) | 0.005 | 0.636 (0.340–1.188) | 0.156 | |
| Female | Q1 | Ref | Ref | Ref | |||
| Q2 | 0.845 (0.508–1.406) | 0.518 | 0.830 (0.498–1.385) | 0.830 | 0.830 (0.449–1.436) | 0.459 | |
| Q3 | 1.012 (0.613–1.671) | 0.963 | 0.974 (0.587–1.614) | 0.918 | 1.248 (0.691–2.256) | 0.463 | |
| Q4 | 0.672 (0.405–1.116) | 0.125 | 0.633 (0.379–1.058) | 0.081 | 0.799 (0.440–1.452) | 0.461 | |
| Subgroup | T4 | Model 1 | Model 2 | Model 3 | |||
|---|---|---|---|---|---|---|---|
| OR (95% CI) |
| OR (95% CI) |
| OR (95% CI) |
| ||
| Male | Q1 | Ref | Ref | Ref | |||
| Q2 | 0.917 (0.570–1477) | 0.722 | 0.937 (0.580–1.514) | 0.791 | 1.169 (0.671–2.037) | 0.582 | |
| Q3 | 1.258 (0.773–2.047) | 0.356 | 1.303 (0.795–2.135) | 0.294 | 1.617 (0.913–2.864) | 0.100 | |
| Q4 | 2.184 (1.278–3.734) | 0.004 | 2.253 (1.311–3.873) | 0.003 | 2.061 (1.093–3.887) | 0.025 | |
| Female | Q1 | Ref | Ref | Ref | |||
| Q2 | 0.819 (0.459–1.461) | 0.499 | 0.812 (0.454–1.454) | 0.812 | 0.576 (0.298–1.112) | 0.100 | |
| Q3 | 1.097 (0.626–1.924) | 0.746 | 1.142 (0.648–2.012) | 0.645 | 0.938 (0.493–1.783) | 0.844 | |
| Q4 | 1.211 (0.702–2.088) | 0.491 | 1.278 (0.737–2.216) | 0.382 | 0.848 (0.447–1.610) | 0.614 | |
| Subgroup | TSH | Model 1 | Model 2 | Model 3 | |||
|---|---|---|---|---|---|---|---|
| OR (95% CI) |
| OR (95% CI) |
| OR (95% CI) |
| ||
| <41 | Q1 | Ref | Ref | Ref | |||
| Q2 | 0.729 (0.367–1.448) | 0.366 | 0.730 (0.367–1.452) | 0.730 | 0.409 (0.176–0.950) | 0.038 | |
| Q3 | 0.759 (0.397–1.591) | 0.517 | 0.796 (0.397–1.593) | 0.796 | 0.799 (0.339–1.880) | 0.606 | |
| Q4 | 0.622 (0.284–1.363) | 0.235 | 0.621 (0.283–1.362) | 0.235 | 0.658 (0.248–1.746) | 0.401 | |
| 41–54 | Q1 | Ref | Ref | Ref | |||
| Q2 | 0.806 (0.403–1.612) | 0.541 | 0.804 (0.397–1.628) | 0.544 | 1.551 (0.652–3.691) | 0.321 | |
| Q3 | 0.731 (0.358–1.493) | 0.731 | 0.738 (0.357–1.527) | 0.413 | 1.304 (0.529–3.212) | 0.564 | |
| Q4 | 0.505 (0.243–1.046) | 0.066 | 0.570 (0.282–0.800) | 0.139 | 1.198 (0.472–3.042) | 0.704 | |
| 54–68 | Q1 | Ref | Ref | Ref | |||
| Q2 | 1.031 (0.497–2.317) | 0.953 | 1.041 (0.501–2.161) | 0.914 | 0.911 (0.381–2.178) | 0.835 | |
| Q3 | 0.737 (0.356–1.526) | 0.411 | 0.740 (0.357–1.533) | 0.418 | 0.518 (0.210–1.279) | 0.154 | |
| Q4 | 0.650 (0.312–1.351) | 0.248 | 0.811 (0.488–1.349) | 0.420 | 0.712 (0.281–1.803) | 0.474 | |
| >68 | Q1 | Ref | Ref | Ref | |||
| Q2 | 0.383 (0.171–0.861) | 0.020 | 0.391 (0.174–0.880) | 0.023 | 0.428 (0.178–1.030) | 0.058 | |
| Q3 | 0.722 (0.333–1.568) | 0.411 | 0.719 (0.331–1.564) | 0.406 | 1.153 (0.490–2.718) | 0.744 | |
| Q4 | 0.422 (0.202–0.884) | 0.022 | 0.434 (0.206–0.911) | 0.027 | 0.645 (0.283–1.470) | 0.297 | |
| Subgroup | T4 | Model 1 | Model 2 | Model 3 | |||
|---|---|---|---|---|---|---|---|
| OR (95% CI) |
| OR (95% CI) |
| OR (95% CI) |
| ||
| <41 | Q1 | Ref | Ref | Ref | |||
| Q2 | 0.436 (0.190–0.997) | 0.049 | 0.434 (0.190–0.995) | 0.049 | 0.288 (0.106–0.784) | 0.015 | |
| Q3 | 1.714 (0.792–3.712) | 0.172 | 1.730 (0.797–3.758) | 0.166 | 1.395 (0.539–3.612) | 0.493 | |
| Q4 | 1.062 (0.503–2.239) | 0.875 | 0.921 (0.530–1.602) | 0.835 | 0.749 (0.290–1.933) | 0.550 | |
| 41–54 | Q1 | Ref | Ref | Ref | |||
| Q2 | 2.500 (1.068–5.849) | 0.035 | 2.974 (1.235–7.162) | 0.015 | 2.711 (0.968–7.596) | 0.058 | |
| Q3 | 2.049 (0.911–4.610) | 0.083 | 2.317 (1.006–5.336) | 0.048 | 2.171 (0.782–6.030) | 0.137 | |
| Q4 | 4.083 (1.759–9.477) | 0.001 | 4.965 (2.071–11.903) | <0.001 | 3.986 (1.346–11.798) | 0.013 | |
| 54–68 | Q1 | Ref | Ref | Ref | |||
| Q2 | 0.605 (0.292–1.256) | 0.178 | 0.633 (0.302–1.324) | 0.224 | 0.618 (0.252–1.513) | 0.292 | |
| Q3 | 0.646 (0.315–1.324) | 0.233 | 0.683 (0.329–1.419) | 0.307 | 0.853 (0.353–2.061) | 0.724 | |
| Q4 | 1.059 (0.515–2.178) | 0.876 | 1.157 (0.546–2.454) | 0.703 | 0.924 (0.360–2.373) | 0.870 | |
| >68 | Q1 | Ref | Ref | Ref | |||
| Q2 | 1.026 (0.537–1.961) | 0.937 | 0.975 (0.506–1.877) | 0.939 | 1.134 (0.558–2.307) | 0.728 | |
| Q3 | 1.205 (0.590–2.459) | 0.609 | 1.120 (0.542–2.316) | 0.759 | 1.269 (0.584–2.759) | 0.547 | |
| Q4 | 1.564 (0.770–3.178) | 0.216 | 1.446 (0.702–2.979) | 0.318 | 1.306 (0.590–2.890) | 0.510 | |
- —Science and Technology Innovation 2025 Major Project of Ningbo 10.13039/501100017549
Peer Reviews
No public reviews on file for this paper yet. If you reviewed it on a platform where reviews are public (OpenReview, ICLR, NeurIPS, ICML), you can paste yours below so the community can read it here.
Videos
No videos yet. Explain this paper in a talk, walkthrough, or lecture? Add one.
Taxonomy
TopicsHelicobacter pylori-related gastroenterology studies · Celiac Disease Research and Management · Eosinophilic Esophagitis
Introduction
1
Helicobacter pylori is a bacterium that preferentially colonizes in the gastric epithelium, often causing a spectrum of digestive disease, including peptic ulcer, chronic gastritis, and even gastric cancer. It has been reported that approximately half of the global population is infected with H. pylori (1), with a prevalence rate of approximately 35.6% in the US (2). Furthermore, numerous extra-gastric diseases have been proven to be associated with H. pylori infection, such as dermatosis, thyroid diseases, and metabolic, cardiovascular, and neurological diseases (3–5).
Thyroxine (T4) is a thyroid hormone (TH) synthesized and secreted by the thyroid gland (6). The regulation of THs is governed by the complex hypothalamic–pituitary–thyroid (HPT) axis. Thyroid-stimulating hormone (TSH), produced by the anterior pituitary gland, promotes the synthesis and release of THs, primarily through negative feedback mechanisms within the HPT axis (7). Evidence indicates that H. pylori infection plays a pivotal role in thyroid disease (8), particularly autoimmune thyroid diseases (ATDs), owing to its ability to mimic the antigenic profile present on thyroid cell membranes (9). Vincenzo Bassi et al. discovered a heightened prevalence of H. pylori exclusively among patients with hyperthyroid Graves’ disease (GD), in contrast to those with Hashimoto thyroiditis (HT) (10). Additionally, De Luis et al. reported markedly elevated levels of anti-H. pylori immunoglobulin G antibodies in patients with subclinical hyperthyroidism, compared to the control cohort (11). Furthermore, a recent prospective study highlighted a substantial association between H. pylori infection and the likelihood of subclinical hyperthyroidism in Chinese women, independent of dietary factors (12). Both TSH and T4 are considered sensitive biomarkers for evaluating thyroid function, reflecting conditions of either hypothyroidism or hyperthyroidism (13). At present, the relationship between H. pylori infection and plasma levels of TSH and T4 in the general population remains insufficiently investigated and contentious (14–16).
Since the T4 data were incorporated in October 2023, it is now particularly intriguing to explore the relationship between TSH, T4 levels, and H. pylori infection based on data from the 1999–2000 National Health and Nutrition Examination Survey (NHANES).
Materials and methods
2
Study design and sample
2.1
NHANES is a publicly accessible database managed by the Centers for Disease Control and Prevention (CDC), providing extensive data regarding the health and nutritional status of the non-institutionalized U.S population. The survey encompasses information derived from questionnaires, demographic profiles, laboratory tests, and physical examinations (17, 18). The data analyzed in this study were form the 1999–2000 NHANES cycles, encompassing participants who had both H. pylori infection and measurements of plasma TSH and T4 levels, with T4 data being added to the database in October 2023.
The exclusion criteria were as follows: (1) individuals aged <30 or >85 years; (2) missing data for H. pylori serology, TSH, or T4 levels; and (3) individuals with thyroid disease or taking thyroid medications. Participants possessing relevant laboratory data and demographic variables of interest were incorporated into this investigation, culminating in a total sample size of 971 individuals aged between 30 and 85 years old. The schematic representation of the participant selection process is illustrated in Figure 1.
The flowchart of sample selection.
Helicobacter pylori status
2.2
In accordance with the NHANES protocol (19), H. pylori-specific immunoglobulin G (IgG) levels were quantified utilizing the H. pylori IgG enzyme-linked immunosorbent assay (ELISA) developed by Wampole Laboratories (Granbury, N) (20). Standard ELISA cutoff values were applied to classify participants as seropositive [optical density (OD) value ≥1.1] or seronegative (OD value < 0.9) for H. pylori. Indeterminate results (OD values between 0.9 and 1.1) were excluded to avoid potential biases in the statistical analysis of this investigation (21).
Thyroid-stimulating hormone and thyroxine
2.3
The dependent variable analyzed in this study was H. pylori seropositivity, while the primary independent variables of interest were plasma levels of TSH and T4. Both serum TSH and T4 were sourced from the NHANES laboratory dataset, designated as LAB18T4, which was updated in October 2023. Thyroid medications have been identified in the prescription drug medication document.
Covariates
2.4
The covariates examined in this research encompass age, gender, race, education level, body mass index (BMI), smoking behavior, alcohol behavior, and homocysteine levels. These variables were selected based on existing evidence linking them to both H. pylori serostatus and thyroid function (18, 21, 22). Among the covariates, age, TSH, T4, and homocysteine were categorized as continuous variables, while sex, race, education level, BMI, smoking behavior, and alcohol behavior were classified as categorical variables.
Statistical analyses
2.5
For continuous variables, independent t-test or Mann–Whitney test was employed to analyze the differences between groups. Depending on the normality of distribution, continuous variables were presented as mean ± SD; otherwise, they were presented as Median. Categorical variables were assessed using the chi-square test and reported as counts and percentages. Levels of TSH and T4 were categorized into quartiles (Q1 to Q4). Multiple regression analysis was conducted to identify the factors influencing TSH and T4 levels. Furthermore, the relationship between TSH, T4, and H. pylori was examined through restricted cubic spline (RCS) analysis, with knots positioned at the 5th, 35th, 65th, and 95th percentiles. Statistical analyses were carried out using SPSS (version 26.0) and R software (version 4.1.3), with a significance threshold set at p < 0.05, where both the p for overall and the p for non linear relationship in RCS were less than 0.05.
Results
3
Characteristics of included subjects
3.1
A total of 971 participants were included in this study, with 498 classified as H. pylori IgG seropositive and 473 as H. pylori IgG seronegative. Notable differences were detected between the two groups (p < 0.05) in terms of age, race, educational level, and serum TSH and T4 levels. The baseline characteristics of the study subjects are detailed in Table 1.
Association between H. pylori seropositivity and TSH and T4
3.2
Multiple regression model
3.2.1
The outcomes of different multivariate linear regression models are summarized in Tables 2, 3: Model 1 is unadjusted, model 2 is adjusted for age and sex, and model 3 is further adjusted for race and educational level.
In the unadjusted model, a negative association was identified between H. pylori seropositivity and TSH levels across increasing quartiles of hormonal levels (Q4 vs. Q1: OR = 0.579; 95% CI, 0.403–0.831, p = 0.003). This negative relationship persisted after adjustments for confounding factors in model 2 (Q4 vs. Q1: OR = 0.544, 95% CI, 0.377–0.786; p = 0.001) and model 3 (Q4 vs. Q1: OR = 0.580, 95% CI, 0.389–0.866; p = 0.008). Conversely, a significant positive association was observed between H. pylori and T4 levels across increasing quartiles of hormonal levels (Q4 vs. Q1: OR = 1.483; 95% CI, 1.033–2.129, p = 0.033). This positive connection remained significant after adjustments for confounding factors in model 2 (Q4 vs. Q1: OR = 1.552; 95% CI, 1.076–2.238, p = 0.019) and was marginally significant in model 3 (Q4 vs. Q1: OR = 1.004; 95% CI, 0.981–1.026, p = 0.048), as presented in Table 3.
Subgroup analyses
3.2.2
In the sex-stratified subgroup analyses, a positive correlation was discovered between the H. pylori seropositivity and T4 levels in men (Q4 vs. Q1 OR = 2.253; 95% CI, 1.311–3.873; p = 0.003). However, no significant relationship was observed between TSH levels and H. pylori seropositivity in men, as the positive correlation disappeared after adjusting for confounding variables in the multivariate regression model (Q4 vs. Q1 OR = 0.636; 95% CI, 0.340–1.188; p = 0.156). Among women, neither TSH nor T4 levels exhibited any association with H. pylori seropositivity. Detailed findings are provided in Tables 4, 5.
In the age-stratified subgroup analyses, a negative correlation was identified between H. pylori seropositivity and TSH levels among participants aged over 68 years (Q4 vs. Q1: OR = 0.434; 95% CI, 0.206–0.911; p = 0.027). Furthermore, no significant association was observed between TSH levels and H. pylori seropositivity in other age groups, as detailed in Table 6. Additionally, there was a positive association between H. pylori seropositivity and T4 levels among participants aged 41–54 years (Q4 vs. Q1: OR = 4.965; 95% CI, 2.071–11.903; p < 0.001). However, T4 levels showed no significant relationship with H. pylori seropositivity in other age groups, as outlined Table 7.
Non-linear relationship between TSH, T4, and H. pylori infection
3.2.3
An RCS model was employed to assess the association between TSH levels and H. pylori infection. As illustrated in Figure 2, when TSH levels fall below 0.98 IU/mL, the risk of H. pylori infection rises significantly (p < 0.05). Conversely, there was no linear relationship between T4 levels and H. pylori infections.
The restricted cubic spline curve for the relationship between serum TSH levels and H. pylori infection. The blue lines represent odds ratios, and blue areas represent 95% confidence intervals.
Discussion
4
This study utilized newly updated NHANES data to explore the relationship between TSH and T4 levels and H. pylori infection. In summary, H. pylori seropositivity demonstrated a positive correlation with T4 levels and a negative correlation with TSH levels. In stratified analyses, the adjusted association between serum T4 levels and H. pylori seropositivity was statistically significant in men but not in women, with significant correlations observed for serum TSH in participants over 68 years of age and for T4 in those aged 41–45 years.
As is widely acknowledged, thyroid function is composed of TSH and T4, with these serum markers often exhibiting a negative correlation. Our research identified variations in TSH and T4 levels between populations positive and negative for H. pylori. The non-linear connection revealed an enormous rise in the likelihood of H. pylori infection when TSH levels < 0.98 IU/mL. This suggests that individuals exhibiting hyperthyroid tendencies are more susceptible to H. pylori infection, corroborating findings from prior studies (10).
H. pylori testing should be considered for individuals undergoing treatment with medications known to be affected by this infection, such as T4, as outlined in the Houston Consensus (23). Therefore, this suggests an implied relationship between H. pylori infection and thyroid function. Nonetheless, the impact of thyroid function disorders, including hyperthyroidism or hypothyroidism, on H. pylori infection remains a contentious issue. Larizza et al. demonstrated that H. pylori could provoke an immune response against thyroid cells (24). A notable association has also been observed between Cag-A-positive H. pylori strains and GD, regardless of the patients’ hormonal status (25). The association may be attributed to cross-reactivity between antibodies against the H. pylori Cag-A protein and the follicular cells of the thyroid gland (26). Additionally, conflicting findings from other research have indicated a positive correlation between H. pylori infection and autoimmune atrophic thyroiditis (27, 28).
The mechanisms by which elevated T4 levels and suppressed TSH levels heighten the susceptibility to H. pylori infection remain incompletely understood; however, several lines of evidence may shed light on this relationship. Firstly, the discovery of a homologous 11-residue peptide shared by both gastric parietal cell antigens and thyroid peroxidase suggests a common epitope (29), implying that antibodies generated during H. pylori infection may cross-react with thyroid antigens, potentially contributing to hyperthyroidism (30). Secondly, studies have shown a strong correlation between IgG anti-H. pylori antibodies and thyroid autoantibodies, along with a reduction in thyroid autoantibody levels following the successful eradication of H. pylori infection (31). Thirdly, previous investigations have demonstrated that H. pylori strains can express fucosylated Lewis determinants, which are commonly found in various host tissues and may trigger an autoimmune response that could impair thyroid function (32). Typically, thyroid diseases, particularly ATDs, are influenced by a variety of autoimmune mechanisms. It has been reported that H. pylori infection plays a role in the pathogenesis of HT, the leading cause of hypothyroidism (28). In addition, in GD, humoral autoimmunity characterized by a TH2 profile is prevalent. Once infected with H. pylori, cytokines such as interleukin (IL)-4, IL-5, and IL-6 are activated, initiating a cascade of humoral immune responses that may modify the expression of adhesion molecules on the gastric mucosa, thereby contributing to the hyperthyroidism observed in GD (10, 33). The mechanism is believed to be associated with molecular mimicry between H. pylori antigens and thyroid constituents. Collectively, these findings offer compelling explanations for the observed correlation between H. pylori infection and hyperthyroidism.
A notable correlation was found between persistent H. pylori infection and ATDs in female patients, regardless of thyroid gland functional status. Specifically, this association was observed in relation to both HT and GD across multiple studies (10, 12), whereas no such connection was noted for non-autoimmune thyroid disorders. Although this association was primarily observed in women, a trend suggesting a similar relationship was noted in men (34). Because of the limitations of the NHANES database, the present study was unable to include thyroid autoantibodies such as thyroglobulin antibody (TGAb) and thyroid peroxidase antibodies (TPOAbs), which may have resulted in a weakened association between H. pylori seropositivity and TSH levels as well as T4 levels within gender cohorts.
Previous studies have suggested that the successful colonization of H. pylori in the gastric environment is influenced by age-related physiological factors and host characteristics, with the incidence of H. pylori-related diseases increasing with age (35, 36), a finding consistent with our results. Furthermore, additional factors such as socioeconomic status, geographical location, and ethnicity may also contribute to the rates of H. pylori infection (37). Breckan et al. reported that the prevalence of H. pylori is age-dependent, rising from adolescence and reaching its peak between the ages of 60 and 70 years (38).
It has to be recognized that there are several limitations in this study. First, H. pylori infection was defined based on serological testing, which cannot distinguish between past and present infections. Second, the NHANES 1999–2000 dataset lacked certain relevant information, such as TGAb and TPOAb, which weakens the association between H. pylori and thyroid autoimmunity, thus hindering a more thorough exploration of the underlying mechanisms. Should future NHANES updates include these data, more detailed classification comparisons could be conducted again in the future. Third, as a cross-sectional study, it does not allow for the establishment of causative relationships between TSH and T4 levels and H. pylori seropositivity, nor does it provide temporal data to differentiate between past and present H. pylori infections. Further longitudinal studies are needed to make interpretations of observed associations in the future. Lastly, while we accounted for the influence of certain medications, other factors, such as long-term contraceptive use in women, may affect thyroid function (39), as well as dietary factors like “high-salt” intake (40) or a high dietary inflammatory index (41), which are likely to influence the prevalence of H. pylori infection.
Conclusion
5
Overall, serum TSH and T4 levels were found to be associated with the risk of H. pylori infection, particularly among men, individuals with hyperthyroidism, and elderly adults. These people should pay close attention to H. pylori screening, as H. pylori infection is closely related to gastric cancer.
The reference list from the paper itself. Each links out to its DOI / PubMed record.
- 1Zamani M Ebrahimtabar F Miller V Miller W.H Alizadeh-Navael R Shokri-Shirvanl J. Systematic review with meta analysis: the worldwide prevalence of Helicobacter pylori infection. Aliment Pharmacol Ther. (2018) 47:868–76. doi: 10.1111/apt.2018.47.issue-7 29430669 · doi ↗ · pubmed ↗
- 2Burucoa C Axon A. Epidemiology of Helicobacter pylori infection. Helicobacter. (2017) 22:1–5. doi: 10.1111/hel.2017.22.issue-S 1 28891138 · doi ↗ · pubmed ↗
- 3Astl J Sterzl I. Activation of helicobacter pylori causes either autoimmune thyroid diseases or carcinogenesis in the digestive tract. Physiol Res. (2015) 64:S 291–301. doi: 10.33549/physiolres 26680492 · doi ↗ · pubmed ↗
- 4Kucukazman M Yeniova O Dal K Yavuz B. Helicobacter pylori and cardiovascular disease. Eur Rev Med Pharmacol Sci. (2015) 19:3731–41.26502864 · pubmed ↗
- 5Wang L Cao Z-M Zhang L-L Dai X-C Liu Z-J Zeng Y-X. Helicobacter pylori and autoimmune diseases: Involing multiple systems. Front Immunol. (2022) 13:833424. doi: 10.3389/fimmu.2022.833424 35222423 PMC 8866759 · doi ↗ · pubmed ↗
- 6Mullur R Liu YY Brent GA. Thyroid hormone regulation of metabolism. Physiol Rev. (2014) 94:355–82. doi: 10.1152/physrev.00030.2013 PMC 404430224692351 · doi ↗ · pubmed ↗
- 7Chiamolera MI Wondisford FE. Minireview: thyrotropin-releasing hormone and the thyroid hormone feedback mechanism. Endocrinology. (2009) 150:1091–6. doi: 10.1210/en.2008-1795 19179434 · doi ↗ · pubmed ↗
- 8Wang Y Zhu S Xu Y Wang X Zhu Y. Interaction between gene a-positive helicobacter pylori and human leukocyte antigen II alleles increase the risk of graves disease in Chinese han population: An association study. Gene. (2013) 531:84–9. doi: 10.1016/j.gene.2013.07.069 23954255 · doi ↗ · pubmed ↗