Minimal important change of the Western Ontario Osteoarthritis of the Shoulder (WOOS) index in patients with glenohumeral osteoarthritis and rotator cuff tear arthropathy
Josefine Beck Larsen, Theis Muncholm Thillemann, Antti P. Launonen, Helle Kvistgaard Østergaard, Thomas Falstie-Jensen, Bakir Sumrein, Srdjan Zivanovic, Steen Lund Jensen, Inger Mechlenburg, Ville Ponkilainen

TL;DR
This study calculates the smallest meaningful improvement in shoulder function for patients undergoing shoulder replacement surgery using two outcome measures.
Contribution
The study provides the first MIC estimates for WOOS and DASH in patients with shoulder conditions treated with total shoulder arthroplasty.
Findings
The estimated MIC for WOOS was 13.3 with a wide confidence interval.
The estimated MIC for DASH was 7.2 with a wide confidence interval.
The wide confidence intervals may reflect low sample size or patient heterogeneity.
Abstract
The Minimal Important Change (MIC) for patient-reported outcome measures is the value that describes the smallest improvement considered worthwhile by patients. To the best of our knowledge, no MIC of the Western Ontario Osteoarthritis of the Shoulder Index (WOOS) score or the Disabilities of the Arm Shoulder and Hand (DASH) has been reported using the anchor-based predictive modeling approach based on patients with glenohumeral osteoarthritis or rotator cuff tear arthropathy. The aim of this study was to determine the MIC for WOOS and DASH in a cohort of patients with glenohumeral osteoarthritis or rotator cuff tear arthropathy treated with a total shoulder arthroplasty. Data on 231 patients were collected at four hospitals in Denmark and Finland. Data were collected at baseline and 12 weeks after surgery. At 12 weeks, the patients were asked about their perceived overall improvement…
Genes, proteins, chemicals, diseases, species, mutations and cell lines named across the full text — each resolved to its canonical identifier and authoritative record.
Click any figure to enlarge with its caption.
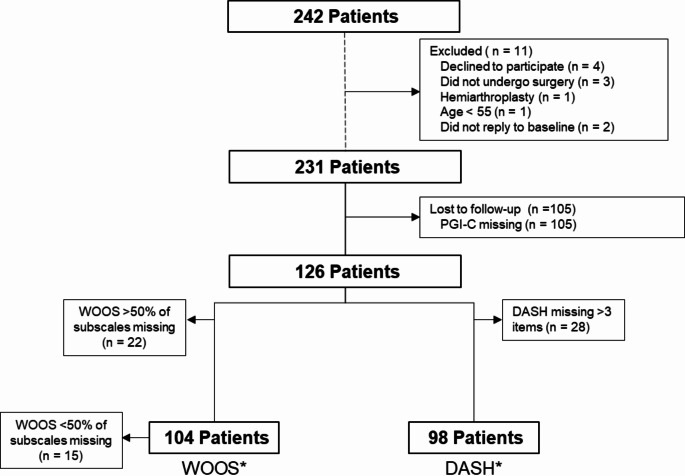 Figure 1
- —Aarhus University Hospital
Peer Reviews
No public reviews on file for this paper yet. If you reviewed it on a platform where reviews are public (OpenReview, ICLR, NeurIPS, ICML), you can paste yours below so the community can read it here.
Videos
No videos yet. Explain this paper in a talk, walkthrough, or lecture? Add one.
Taxonomy
TopicsShoulder Injury and Treatment · Shoulder and Clavicle Injuries · Nerve Injury and Rehabilitation
Introduction
Patient reported outcome measures are widely used in clinical trials and as a quality-of-care measure in various registries and National Arthroplasty Registries [1–3]. Multiple patient-reported outcome measures (PROMs) have been developed to measure the symptoms and disability among patients. Commonly used PROMs for shoulder patients include the Western Ontario Osteoarthritis of the Shoulder Index (WOOS) and the Disabilities of the Arm Shoulder and Hand (DASH) [1, 4, 5]. The WOOS score is a PROM used in the Nordic shoulder arthroplasty registries [1]. The WOOS score was developed to evaluate the symptoms of patients suffering from glenohumeral osteoarthritis [6]. DASH is an upper-extremity-specific PROM measuring symptoms and physical function developed for patients with upper extremity musculoskeletal conditions [7].
Using PROMs in research requires a meaningful interpretation from the patient’s perspective of treatment effects. The minimal important change (MIC) value offers such an interpretation and is defined as the minimal change score that is considered important by the average patient [2, 8].
The reported MIC values for WOOS (0-100, 100 best) following total shoulder arthroplasty ranges from 8.2 to 12.3 points measured preoperatively to one year after surgery [9, 10]. No previous studies have estimated MIC for DASH for patients undergoing total shoulder arthroplasty. In various other shoulder conditions, the MIC value for DASH has been estimated from 4.4 to 13 points with different follow-up times using an anchor-based approach [11–16]. With different methodological approaches to determine the MIC values [2], there is a need for further studies investigating the MIC values with different anchor-based methods.
The primary aim of this study was to determine the MIC for the WOOS score for patients with glenohumeral osteoarthritis or rotator cuff tear arthropathy, treated with total shoulder arthroplasty. The secondary aim was to determine the MIC for the DASH score in the same patient population.
Materials and methods
Design
This study is a prospective observational cohort study of patients with glenohumeral osteoarthritis or rotator cuff tear arthropathy, treated with a total shoulder arthroplasty.
Study setting
Patients were recruited from Orthopedic Departments at Aarhus University Hospital, Aalborg University Hospital and Viborg Regional Hospital in Denmark and at Tampere University Hospital in Finland. Physiotherapists and orthopedic surgeons at the participating departments assessed eligibility of all patients and eligible patients were asked to complete the questionnaires (paper or electronical) preoperatively and 3 months postoperatively.
Participants
Patients scheduled to primary total shoulder arthroplasty with glenohumeral osteoarthritis or rotator cuff tear arthropathy were invited to participate from March 2020 to January 2023. Patients were allowed to participate with the first shoulder undergoing surgery.
Eligibility criteria
Inclusion criteria:
- Patient ≥ 55 years.
- Primary glenohumeral osteoarthritis eligible for anatomical total shoulder arthroplasty or rotator cuff tear arthropathy eligible for reverse shoulder arthroplasty.
Exclusion criteria:
- Previous shoulder fracture.
- Planned other upper extremity surgery within six months.
- Rheumatoid arthritis and other types of inflammatory arthritis.
- Cancer diagnosis and receiving chemo-, immuno- or radiotherapy.
- Neurological diseases (e.g. previous stroke, multiple sclerosis, Parkinson’s, Alzheimer’s).
- Other reasons for exclusion (i.e. mentally unable to participate ect.)
- Inability to understand the written local language (Danish or Finnish).
Outcome measures
Demographic data was collected at baseline including sex, age, hand dominance and index shoulder, furthermore surgical type (RSA or TSA) and hospital site was registered. In addition, patients completed WOOS and DASH at baseline. At 3 months follow-up patients completed WOOS, DASH and the Patient Global Impression of Change (PGI-C).
Western ontario osteoarthritis of the shoulder index (WOOS)
The WOOS score is a disease-specific PROM for shoulder-related Quality-of-Life developed for patients with glenohumeral osteoarthritis [6]. The WOOS index consists of 19 items divided into four domains: physical symptoms (6 items), sport and work (5 items), lifestyle (5 items) and emotions (3 items). The items are answered on a visual analogue scale ranging from 0 to 100. The total raw score ranges from 0 to 1900, with 1900 indicating the worst score. The raw scores are often converted into a percentage score where 100% represents a completely healthy shoulder [6]. The WOOS has been translated and cross-culturally validated in Danish, but not in Finnish [17]. In the original WOOS questionnaire, the scoring manual did not facilitate the calculation of a composite score in the presence of missing items. With WOOS being utilized across registries and clinical trials, it is problematic that a few missing data are not allowed. Therefore, we defined that to be included > 50% of items must be answered for each subscale: physical symptoms (3 items), sport and work (3 items), lifestyle (3 items) and emotions (2 items). Allowing for a calculation of the total percentage score following the formula:
\documentclass[12pt]{minimal} \usepackage{amsmath} \usepackage{wasysym} \usepackage{amsfonts} \usepackage{amssymb} \usepackage{amsbsy} \usepackage{mathrsfs} \usepackage{upgreek} \setlength{\oddsidemargin}{-69pt} \begin{document}$$percentage\,score = {\matrix{\left({{\rm{number}}\,{\rm{of}}\,{\rm{answered}}\,{\rm{items*}}100} \right) \hfill \cr - {\rm{total}}\,{\rm{aggregate}}\,{\rm{score}} \hfill \cr} \over {{\rm{number}}\,{\rm{of}}\,{\rm{answered}}\,{\rm{items}}}}$$\end{document}.
Disabilities of the arm shoulder and hand (DASH)
The DASH score is an upper-extremity specific PROM measuring symptoms and physical function for patients with musculoskeletal conditions of the upper-extremities [7]. The DASH consists of 30-items assessing the degree of difficulty performing different physical activities due to arm, shoulder, and hand problems (21 items), symptoms from the arm, shoulder, and hand problems (5 items), difficulties experienced in social life, work, sleep, and self-perception (4 items). The responses are presented as 5-point Likert scales. The items are summarized into a total score from 0 to 100, with 100 indicating severe disability, allowing for three missing items. The questionnaire has been translated and cross-culturally validated in Finnish [18] and Danish [11, 19].
Patient global impression of change (PGI-C)
The PGI-C is a rating scale where patients are asked a single question at follow-up to evaluate the change of symptoms reported by the patients [20, 21]. The question is: “Since the start of the study, my overall status is:” answered on a 7-point scale ranging from very much improved to very much worse (Table 1). The questionnaire has been translated and cross-culturally validated in Finnish and Danish [22].
Table 1. Patient global impression of change (PGI-C) response options and classification into importantly improved or not importantly improved Importantly improved 1. Very much improved 2. Much improved Not importantly improved 3. Minimally improved 4. No Change 5. Minimally worse 6. Much Worse 7. Very much worse
Statistical analysis
Patient demographics and clinical data are presented as mean and standard deviations (SD) for normally distributed and median and interquartile range (IQR) for non-normally distributed continuous variables, and categorical variables are presented as numbers (proportion). The association between the WOOS and DASH change score and responses on the anchor question was investigated with Pearson correlation. A minimal correlation of 0.3 is considered appropriate in using the anchor question for the MIC determination [2].
MIC values were calculated using the anchor-based predictive modeling as described by Terluin et al. [23]. The WOOS and DASH change scores were anchored to the PGI-C response at 3-month follow-up. Due to its methodological advantages, the predictive modelling method (MIC_pred_) was used [8]. The predictive method utilizes logistic regression and is described by Terluin et al. [8]. The logistic regression is based on the dichotomized anchor response (importantly improved or not importantly improved) as the dependent variable and the PROM change score as the independent variable. The original MIC_pred_ was recently updated with an adjusted formula MIC_predadjust_ to increase the precision of the formula. The MIC_pred_ was most precise if the proportion of improved patients was 0.5. With the adjusted formula, the precision remained high when the proportion of improved patients were between 0.3 and 0.7. Furthermore, the updated formula considers the reliability of transition ratings [24]. Since DASH allows for three missing items, the calculation described by Terluin et al. was not possible, and therefore, missing items were replaced with mean values of the total score, allowing for estimation of the reliability of transition ratings [24].
Other commonly used anchor-based methods to determine MIC are the mean change method (MIC_mean_) and receiver operating characteristics (ROC) method (MIC_ROC_). To ease comparison between the predictive and traditional methods the three traditional methods were included as well. With the mean change method, the MIC_mean_ is estimated by calculating the mean score change of the patient subgroup that answered “Minimally improved” to the anchor question [2]. With the ROC method, we determined the MIC_ROC_ value according to the Youden criterion, discriminating patients from being importantly improved or not defined by the change in PROM score with the least degree of misclassification. 95% CI for MIC_ROC_ was determined using bootstrap replications (n = 1,000) [25].
A sensitivity analysis was conducted to investigate whether missing data would affect the scores of WOOS and the corresponding MIC values.
Results
Between March 2020 and January 2023, 231 patients underwent total shoulder arthroplasty, 105 patients had missing PGI-C, 22 patients had missing items in more than 50% of the subscales for WOOS and 28 had more than three items missing in DASH. This left 104 patients for the WOOS MIC analysis and 98 patients for the DASH MIC analysis (Fig. 1). No missing items in WOOS were present in 89 out of the 104 patients and were included in the sensitivity analysis. The patients had a mean age of 71 years, 56 had TSA and 48 had RSA (Table 2).
Fig. 1. Flowchart of included patients. *Includes all patients that fulfilled the patient reported outcome measures preoperatively and at 3 months. WOOS: the Western Ontario Osteoarthritis of the Shoulder Index. DASH: disabilities of the arm, shoulder and hand questionnaire
Table 2. Patient preoperative demographicsPatients included in WOOS MIC analysis (n = 104)Patients with missing PGI-C missing (n = 105)Age, mean (SD)71.0 (8.7)69.1 (9.4)Female, n (%)58 (56)60 (57.1)Country DK, n (%)59 (56.7)19 (18.1)Surgical type TSA, n (%)56 (53.8)38 (36.2)Surgery in dominant arm, n (%)66 (63.5)63 (60.0)
Descriptive data
The mean improvement in WOOS was 36.9 and 20.3 in DASH (Table 3). The overall proportion of patients reporting important improvements was 71%, while 27% reported either no change or minimal worsening, and 2% reported important worsening (Table 4). The mean improvement in WOOS in the importantly improved group was 45.6 and 15.5 in the not importantly improved group. For DASH, the mean improvement in the importantly improved group was 27.0 and 3.5 in the not importantly improved group (Table 5). The mean improvement for the surgical indication glenohumeral osteoarthritis for WOOS was 40.4 and 20.3 for DASH and for rotator cuff tear arthropathy the mean improvement for WOOS was 32.6 and 20.3 for DASH (Table 6).
Table 3. Preoperative, postoperative and change score for the patient reported outcome scores WOOS and DASH n MeanSDRange WOOS 104Preoperative32165–85Postoperative692214–100Difference377 DASH 98Preoperative521681 − 17Postoperative321979 − 1Difference-203WOOS: the Western Ontario Osteoarthritis of the Shoulder Index. DASH: disabilities of the arm, shoulder and hand questionnaire
Table 4. Anchor based response classified into importantly improved or not importantly improvedn (%) Importantly improved
74 (71) 1. Very much improved32 (31) 2. Much improved42 (40) Not importantly improved
30 (29) 3. Minimally improved21 (20) 4. No Change1 (1) 5. Minimally worse6 (6) 6. Much Worse2 (2) 7. Very much worse0 (0)
Table 5WOOS and DASH outcomes classified according to anchor-based groupsWOOSMeanSDRangeImportantly improved (n = 74)Preoperative32176–85Postoperative781723–100Difference460.4Not importantly improved (n = 30)Preoperative30125–51Postoperative451414–76Difference163 DASH Importantly improved (n = 70)Preoperative531781–17Postoperative261773–1Difference-27-0.1Not importantly improved (n = 28)Preoperative501578–21Postoperative471779–6Difference-42WOOS: the Western Ontario Osteoarthritis of the Shoulder Index. DASH: disabilities of the arm, shoulder and hand questionnaire
Table 6WOOS and DASH outcomes classified according to surgical indicationGlenohumeral osteoarthritis (n = 56*)Rotator cuff tear arthropathy (n = 46*) WOOS mean (SD) Preoperative30.9 (14.3)32.4 (17.6)Postoperative71.3 (22.4)65.1 (22.7)Change40.4 (8.1)32.6 (4.1) DASH mean (SD)
Preoperative 49.7 (16.1)55.2 (16.1)Postoperative29.3 (19.4)34.9 (18.4)Change-20.3 (3.3)-20.3 (2.3)WOOS: the Western Ontario Osteoarthritis of the Shoulder Index. DASH: disabilities of the arm, shoulder and hand questionnaire. *Data was missing on indication and surgical type for 2 patients
MIC values
The correlation between the change score of the WOOS and the anchor question was 0.6 and for the DASH 0.5. The correlations for WOOS and DASH were high enough to perform the MIC analysis. The reliability of transition ratings was 0.4 for WOOS and 0.6 for DASH. The MIC_predadjust_ values adjusted for the proportion of improved patients were 13.3 (-6.2; 23.3) for WOOS and 7.2 (12.8; 1.7) for DASH. The unadjusted MIC values determined with the predictive modelling approach MIC_pred,_ mean change method, and the ROC method varied across the used method with the adjusted MIC_predadjust_ value being lowest for WOOS and the MIC_mean_ being lowest for DASH (Table 7).
Table 7. Minimal important change (MIC) values determined with the predictive modeling approach unadjusted and adjusted, the mean change method and the ROC method. All estimates are presented as the estimated MIC values with a 95% confidence interval (CI)MIC_predadjust_ (CI)^a^MIC_pred_ (CI)MIC_mean_ (CI)MIC_ROC_ (CI)WOOS13.3 (-6.2; 23.3)30.2 (25.7; 34.3)18.6 (11.8; 25.4)26.7 (21.4; 43.0)DASH7.2 (12.8; 1.7)15.3 (18.9; 11.6)5.3 (12.5; -1.9)14.2 (20.1; 4.0)^a^Adjusted for the proportion of importantly improved and reliability of transition ratings. WOOS: the Western Ontario Osteoarthritis of the Shoulder Index. DASH: disabilities of the arm, shoulder and hand questionnaire
Sensitivity analysis
The mean score did not change significantly when allowing for missing data in < 50% of each subscale. The MIC_predadjust_ did not differ either (Table 8).
Table 8. Complete case analysis on the WOOS scoreComplete WOOS (n = 89)Total (n = 104) WOOS mean (SD) Preoperative31.9 (15.0)31.6 (15.6)Postoperative69.7 (22.0)68.5 (22.2)Change37.8 (7.0)36.9 (6.6) MIC predadjust (95% CI) 16.1 (-5.8; 24.1)13.3 (-6.2; 23.3)WOOS: the Western Ontario Osteoarthritis of the Shoulder Index
Discussion
To the best of our knowledge, this is the first study to use the predictive modeling approach to determine the MIC for the WOOS and DASH score in patients with treated with a total shoulder arthroplasty. We found a MIC_predadjust_ of 13.3 (95% CI -6.2; 23.3) for WOOS and 7.2 (95% CI 12.8; 1.7) for DASH, reflecting the smallest improvement needed to be considered important for the average patient three months after TSA or RSA. Allowing a few missing items in the WOOS score did not change the results of our analysis. The MIC estimates varied depending on the method used, the MIC for WOOS varied from 13.3 to 30.2 and DASH varied from 5.3 to 15.3.
Our adjusted MIC corresponds well to the previous studies that have determined MIC values for the WOOS. One study found a MIC for WOOS to be 12.3 using an anchor-based mean change method in patients with glenohumeral osteoarthritis treated with TSA at 1 year [10]. Two studies used the distribution-based methods and found a MIC between 8.2 and 14.2 with a follow-up varying from 1 to 10 years [9, 10]. The large variation in estimates can be due to methodological differences, and in particular, the distribution-based methods are not recommended to estimate the MIC as they do not account for the patient’s perspective [2].
One study used the predictive modeling approach to estimate MIC for DASH on patients with closed humeral shaft fracture treated both surgically and non-surgically and found a MIC of 9.4 (95% CI 10.5; 8.3) [13]. The results are on different upper extremity conditions but comparable to that found in our study (7.2 (95% CI 12.8; 1.7)). Other studies on different shoulder conditions have estimated a MIC for DASH to be between 4.4 and 12 [11–15]. Our results are within this range. With MIC estimates being highly dependent on the patient population, the intervention, and the time points, it is important to be transparent in the context and method used to estimate MIC.
MIC values can differ with both methodology and context [26]. The largest MIC value in this study was found using the predictive modelling approach and the smallest with the adjusted predictive modelling approach for WOOS and mean change method for DASH. The ROC values were higher than the mean change method and the adjusted predictive modelling approach. The ROC method is less precise and susceptible to errors, especially as the ROC method does not allow for adjustment, when the proportion of improved is not 50% [2, 8]. The adjusted predictive formula allows us to correct for the bias which can be introduced when proportion of improvement different from 50%. Furthermore, the formula was updated in 2022, allowing us to consider the reliability of transition ratings [2, 24]. The adjusted predictive and ROC methods should always be used over the mean change method when allowed, as the mean change method does not reflect a minimal threshold but rather a mean in a subgroup of patients [2].
It is important to remember that the MIC values reported in this study are considered to be context-specific and should be applied with care to other patient populations, time-points or interventions. The presented MIC values are considered applicable to other cohorts of patients with glenohumeral osteoarthritis and rotator cuff tear arthropathy undergoing TSA and RSA and comparable to demographics. MIC is the smallest improvement deemed relevant by patients and does not necessarily represent the best possible outcome or the full potential. Other determinants of the outcome after treatment may be relevant to evaluate in the comparison of different interventions. Further research is needed on the psychometric properties in relation to the utility and interpretability of WOOS and DASH in clinical trials.
Limitations
There could be a risk of selection bias as 45% were lost to follow-up, did not have a PGI-C, or had too many missing items in WOOS and/or DASH. The reason for the high loss of follow-up was an error with the follow-up questionnaires at one of the sites, where patients did not receive the PGI-C, and thus were unable to answer it. The non-responders were similar to the responders in their baseline characteristics, and the differences were considered small with regards to age, preoperative and follow-up score on WOOS and DASH. Consequently, we do not expect that our MIC value would differ had we had a higher response rate. The mean age reported by the Danish Shoulder Arthroplasty Registry for patients with glenohumeral osteoarthritis and rotator cuff tear arthropathy is 70 and 75 years since 2004, which supports the representativeness of our sample [27]. There is a risk of recall bias when using an anchor question, as it may be difficult for the patient to recall previous severity levels. We chose a short follow-up period of three months, making it easier for patients to recall how their shoulder was prior to surgery. On the other hand, three months may not be a sufficiently long time period for all patients to recover fully after surgery, but our MIC was comparable to others with longer follow-up, suggesting the additional remission is small. With only 2% reporting to be much worse, the number of deteriorated patients was too low to establish a MIC value for the deterioration. Furthermore, our sample size did not allow separate MIC calculations for the TSA and RSA groups. The wide confidence intervals could be due to the sample size and the large heterogeneity within the patient group.
Conclusion
The MIC_adjusted_ for improvement was 13.3 (95% CI -6.2; 23.3) for WOOS and 7.2 (95% CI 12.8; 1.7) for DASH at 3 months after total shoulder arthroplasty. The MIC values can be used to interpret longitudinal within-group score changes and determine the number of responders in studies or clinical trials.
The reference list from the paper itself. Each links out to its DOI / PubMed record.
- 1Terwee CB, Peipert JD, Chapman R, Lai JS, Terluin B, Cella D et al (2021) Minimal important change (MIC): a conceptual clarification and systematic review of MIC estimates of PROMIS measures. Qual Life Res 30:2729–2754. 10.1007/s 11136-021-02925-y 10.1007/s 11136-021-02925-y PMC 848120634247326 · doi ↗ · pubmed ↗
- 2Makhni EC (2021) Meaningful clinical applications of patient-reported outcome measures in Orthopaedics. JBJS 103:84–91. 10.2106/jbjs.20.0062410.2106/JBJS.20.0062433079895 · doi ↗ · pubmed ↗
- 3van Kampen DA, Willems WJ, van Beers LW, Castelein RM, Scholtes VA, Terwee CB (2013) Determination and comparison of the smallest detectable change (SDC) and the minimal important change (MIC) of four-shoulder patient-reported outcome measures (PRO Ms). J Orthop Surg Res 8:40. 10.1186/1749-799x-8-4010.1186/1749-799X-8-40PMC 384266524225254 · doi ↗ · pubmed ↗
- 4Lo IKY, Griffin S, Kirkley A (2001) The development of a disease-specific quality of life measurement tool for osteoarthritis of the shoulder: the Western Ontario Osteoarthritis of the shoulder (WOOS) index osteoarthritis cartilage. 9:771–778. 10.1053/joca.2001.047410.1053/joca.2001.047411795997 · doi ↗ · pubmed ↗
- 5Hudak PL, Amadio PC, Bombardier C (1996) Development of an upper extremity outcome measure: the DASH (disabilities of the arm, shoulder and hand) [corrected]. Up Extremity Collaborative Group (UECG) Am J Ind Med 29:602–608. 10.1002/(sici)1097-0274(199606)29:6602::Aid-ajim 43.0.Co;2-l 10.1002/(SICI)1097-0274(199606)29:6<602::AID-AJIM 4>3.0.CO;2-L 8773720 · doi ↗ · pubmed ↗
- 6Terluin B, Eekhout I, Terwee CB, de Vet HC (2015) Minimal important change (MIC) based on a predictive modeling approach was more precise than MIC based on ROC analysis J Clin Epidemiol 68: 1388-96. 10.1016/j.jclinepi.2015.03.01510.1016/j.jclinepi.2015.03.01525913670 · doi ↗ · pubmed ↗
- 7Hallberg K, Salomonsson B (2022) Validity, reliability, and responsiveness of the Swedish version of Western Ontario Osteoarthritis of the Shoulder index BMC Musculoskelet Disord 23: 351. 10.1186/s 12891-022-05300-110.1186/s 12891-022-05300-1PMC 899648435410269 · doi ↗ · pubmed ↗
- 8Nyring MRK, Olsen BS, Amundsen A, Rasmussen JV (2021) Minimal Clinically Important Differences (MCID) for the Western Ontario Osteoarthritis of the Shoulder Index (WOOS) and the Oxford Shoulder Score (OSS) Patient Relat Outcome Meas 12: 299–306. 10.2147/prom.S 31692010.2147/PROM.S 316920 PMC 847301334588833 · doi ↗ · pubmed ↗