The genome sequence of the common sole, Solea solea (Linnaeus, 1758)
Enora Geslain, Filip A.M. Volckaert, Ann M. Mc Cartney, Giulio Formenti, Alice Mouton, Shigehiro Kuraku, Huria Marnis

TL;DR
This paper presents the genome sequence of the common sole, a fish species, including detailed gene annotations and mitochondrial genome data.
Contribution
The study provides a high-quality genome assembly and gene annotation for Solea solea, a flatfish species.
Findings
The genome assembly spans 643.80 megabases with 97.81% scaffolded into 21 chromosomal pseudomolecules.
The mitochondrial genome is 17.03 kilobases in length.
Gene annotation identified 21,646 protein-coding genes.
Abstract
We present a genome assembly from an individual female Solea solea (Linnaeus, 1758) (the common sole; Chordata; Actinopteri; Pleuronectiformes; Soleidae). The genome sequence spans 643.80 megabases. Most of the assembly (97.81%) is scaffolded into 21 chromosomal pseudomolecules. The mitochondrial genome has also been assembled and is 17.03 kilobases in length. Gene annotation of this assembly on Ensembl identified 21,646 protein-coding genes.
Genes, proteins, chemicals, diseases, species, mutations and cell lines named across the full text — each resolved to its canonical identifier and authoritative record.
Click any figure to enlarge with its caption.
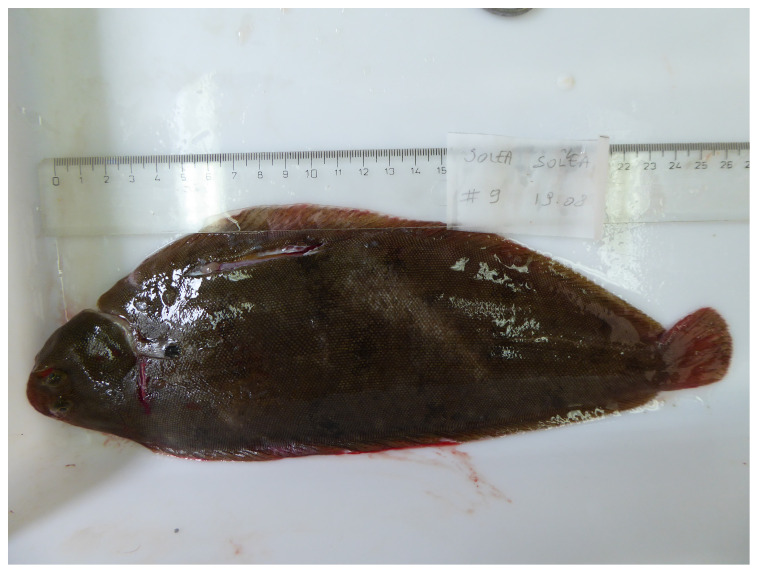 Figure 1
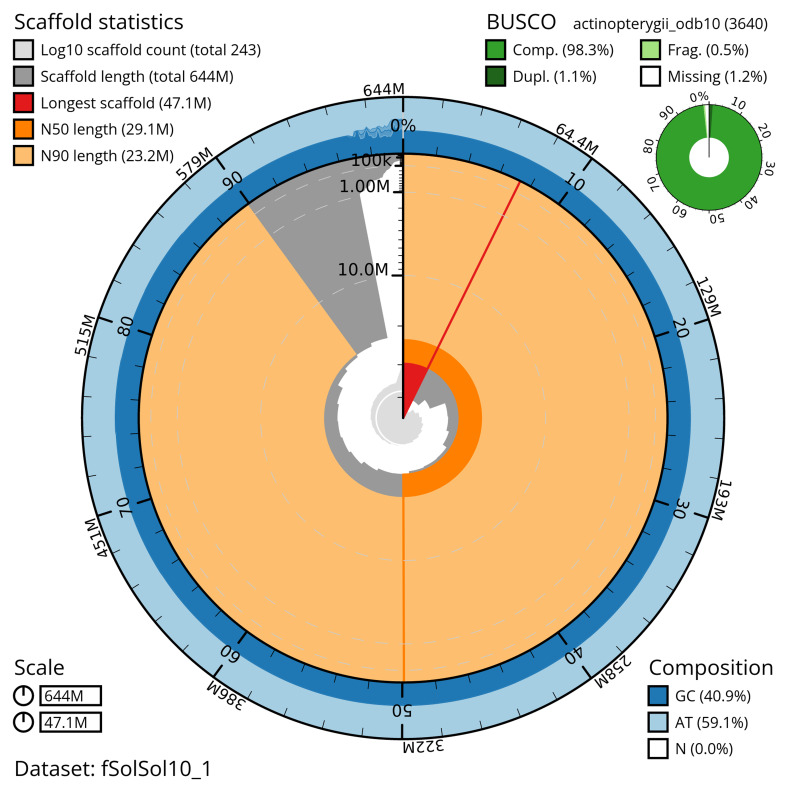 Figure 2
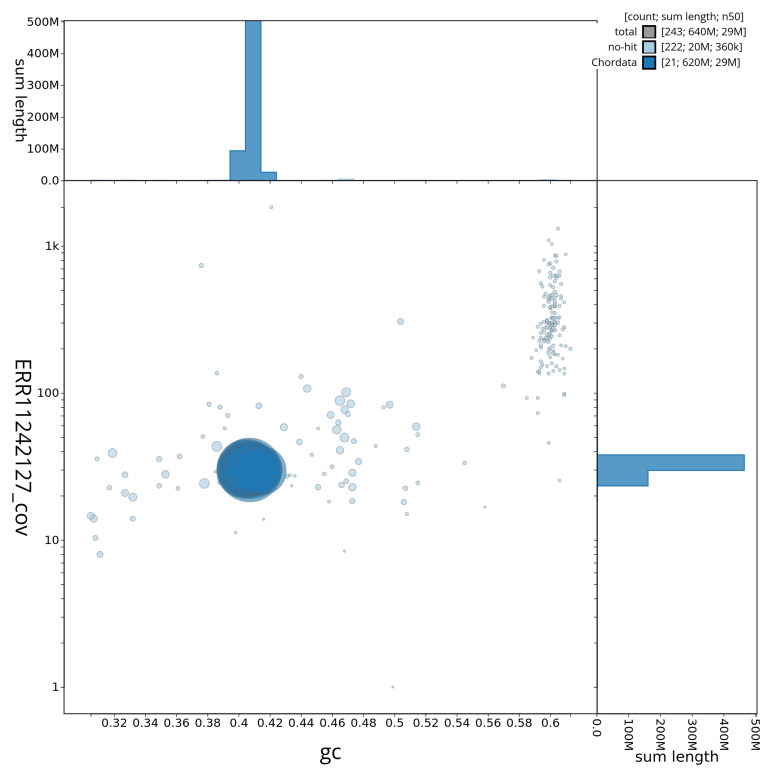 Figure 3
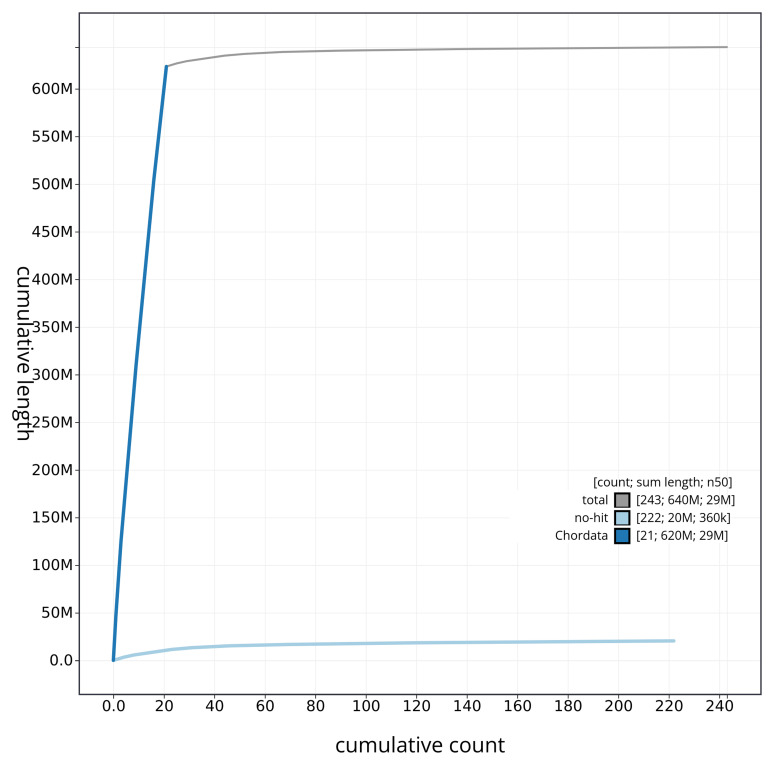 Figure 4
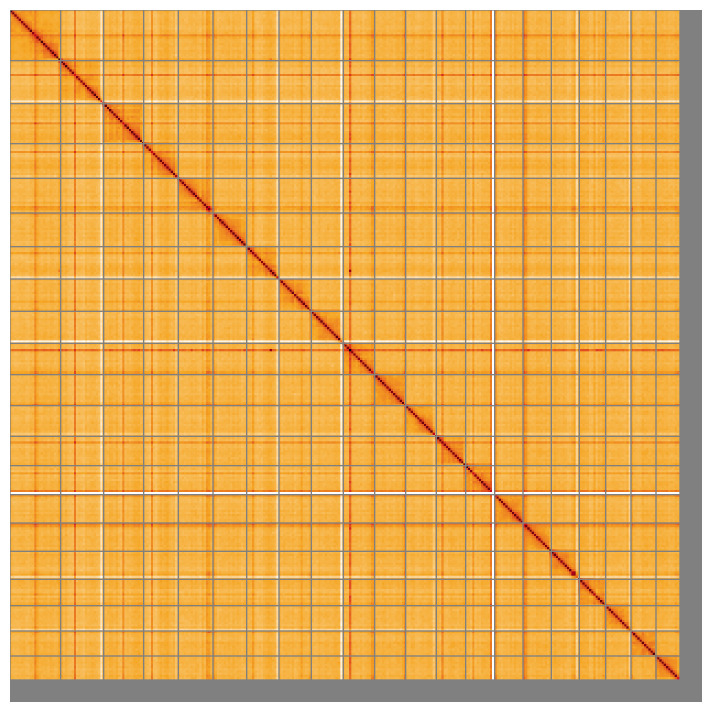 Figure 5
| Project information | |||
|---|---|---|---|
|
| Solea solea (common sole) | ||
|
| PRJEB61337 | ||
|
|
| ||
|
| SAMEA10984647 | ||
|
| 90069 | ||
| Specimen information | |||
|
|
|
|
|
|
| fSolSol10 | SAMEA10984681 | gonad |
|
| fSolSol10 | SAMEA10984680 | gill animal |
|
| fSolSol7 | SAMEA10984669 | gonad |
| Sequencing information | |||
|
|
|
|
|
|
| ERR11242545 | 8.64e+08 | 130.51 |
|
| ERR11242127 | 2.27e+06 | 20.96 |
|
| ERR12245556 | 7.92e+07 | 11.96 |
|
| ERR11242544 | 7.51e+07 | 11.34 |
| Genome assembly | ||
|---|---|---|
| Assembly name | fSolSol10.1 | |
| Assembly accession | GCA_958295425.1 | |
|
|
| |
| Span (Mb) | 643.80 | |
| Number of contigs | 616 | |
| Number of scaffolds | 242 | |
| Longest scaffold (Mb) | 47.06 | |
| Assembly metrics
|
| |
| Contig N50 length (Mb) | 2.6 |
|
| Scaffold N50 length (Mb) | 29.1 |
|
| Consensus quality (QV) | 60.9 |
|
|
| 99.36% (combined
|
|
| BUSCO v 5.3.2 lineage:
| C:98.3%[S:97.2%,D:1.1%],
|
|
| Percentage of assembly mapped
| 97.81% |
|
| Sex chromosomes | Not identified |
|
| Organelles | Mitochondrial genome:
|
|
| Genome annotation of assembly GCA_958295425.1 at Ensembl | ||
| Number of protein-coding
| 21,646 | |
| Number of non-coding genes | 1,553 | |
| Number of gene transcripts | 51,064 | |
| INSDC accession | Name | Length (Mb) | GC% |
|---|---|---|---|
| 1 | 47.06 | 40.5 | |
| 2 | 40.01 | 40.5 | |
| 3 | 37.3 | 41.0 | |
| 4 | 26.89 | 41.0 | |
| 5 | 32.35 | 40.5 | |
| 6 | 32.19 | 40.5 | |
| 7 | 31.38 | 40.5 | |
| 8 | 30.09 | 40.5 | |
| 9 | 29.98 | 40.5 | |
| 10 | 29.76 | 40.5 | |
| 11 | 29.07 | 40.5 | |
| 12 | 29.01 | 40.5 | |
| 13 | 28.33 | 40.5 | |
| 14 | 27.38 | 40.5 | |
| 15 | 26.54 | 40.5 | |
| 16 | 26.39 | 41.5 | |
| 17 | 25.92 | 41.0 | |
| 18 | 24.5 | 41.5 | |
| 19 | 23.71 | 40.5 | |
| 20 | 23.16 | 41.0 | |
| 21 | 22.35 | 41.0 | |
| MT | 0.02 | 44.0 |
| Software tool | Version | Source |
|---|---|---|
| BlobToolKit | 4.2.1 |
|
| BUSCO | 5.3.2 |
|
| bwa-mem2 | 2.2.1 |
|
| Cooler | 0.8.11 |
|
| Gfastats | 1.3.6 |
|
| Hifiasm | 0.16.1-r375 |
|
| HiGlass | 1.11.6 |
|
| Merqury.FK | d00d98157618f4e8d1a91
|
|
| MitoHiFi | 3 |
|
| PretextView | 0.2 |
|
| purge_dups | 1.2.5 |
|
| sanger-tol/genomenote | v1.0 |
|
| sanger-tol/readmapping | 1.1.0 |
|
| Singularity | 3.9.0 |
|
| YaHS | 1.2a.2 |
|
- —Wellcome Trust
Peer Reviews
No public reviews on file for this paper yet. If you reviewed it on a platform where reviews are public (OpenReview, ICLR, NeurIPS, ICML), you can paste yours below so the community can read it here.
Videos
No videos yet. Explain this paper in a talk, walkthrough, or lecture? Add one.
Taxonomy
TopicsGenomics and Phylogenetic Studies · Identification and Quantification in Food · Molecular Biology Techniques and Applications
Species taxonomy
Eukaryota; Opisthokonta; Metazoa; Eumetazoa; Bilateria; Deuterostomia; Chordata; Craniata; Vertebrata; Gnathostomata; Teleostomi; Euteleostomi; Actinopterygii; Actinopteri; Neopterygii; Teleostei; Osteoglossocephalai; Clupeocephala; Euteleosteomorpha; Neoteleostei; Eurypterygia; Ctenosquamata; Acanthomorphata; Euacanthomorphacea; Percomorphaceae; Carangaria; Pleuronectiformes; Pleuronectoidei; Soleidae; Solea; Solea solea, (Linnaeus, 1758) (NCBI:txid90069).
Background
The demersal flatfish Solea solea (Linnaeus, 1758), known commonly as common sole, typically burrows in sandy and muddy bottoms at depths of less than 150 m. This species is widespread in warm and cold temperate seas, including East Atlantic continental shelf waters from Trondheim Fjord (65° N; Norway) southward, the Mediterranean, including the Sea of Marmara, Bosporus and southwestern Black Sea, and the northwestern African coastal waters southward to Senegal, including Cape Verde (5° N) ( Froese & Pauly, 2024). Common sole reach sizes of max. 70 cm, but more commonly 15 to 45 cm and may reach 40 years of age ( ICES, 2006). Planktonic larvae feed on copepod nauplii; juveniles and adults feed nocturnally on benthic invertebrates such as polychaetes, siphons of bivalves and small crustaceans (amphipods) and young stages of echinoderms ( ICES, 2006). Common sole spawn along the coast in proximity of estuaries; postlarvae settle on inshore nursery grounds where they grow to subadults during two to three years. Recruitment is highly variable.
Common sole is a high value consumption flatfish with a well-known biology and limited genomic resources ( Gibson et al., 2014). It is targeted by commercial fisheries using beam trawling, formerly electrotrawling, and to a lesser extent gill netting ( ICES, 2006; Rijnsdorp et al., 2024). Major fished stocks are managed regionally by ICES without evidence for a mismatch with genetic structure ( Diopere et al., 2018). Total landings of 87,120 metric tonnes were estimated in 1992 down to 31,030 metric tonnes in 2019 ( Pauly et al., 2020). The International Union for the Conservation of Nature has listed common sole as “Data Deficient” because of the poor availability of data over sections of the species range ( Tous et al., 2015).
Here we present, to our knowledge, the first complete chromosomal-level genome sequence reported for Solea solea, based on a female specimen from the Kwintebank (51.283 N; 2.65 E), North Sea, Belgium, kept at the Belgian Institute of Natural Sciences, Brussels, Belgium (voucher numbers KBIN/IRSNB/RBINS 27235 and KBIN/IRSNB/RBINS AB42614133).
Genome sequence report
The genome of an adult female Solea solea ( Figure 1) was sequenced using Pacific Biosciences single-molecule HiFi long reads, generating a total of 20.96 Gb (gigabases) from 2.27 million reads, providing approximately 32-fold coverage. Primary assembly contigs were scaffolded with chromosome conformation Hi-C data, which produced 130.51 Gb from 864.29 million reads, yielding an approximate coverage of 203-fold. Specimen and sequencing information is summarised in Table 1.
Photograph of the adult female Solea solea (fSolSol10) specimen used for genome sequencing.
Table 1.: Specimen and sequencing data for Solea solea.
Assembly errors were corrected during manual curation: including 22 missing joins or mis-joins and three haplotypic duplications. This reduced the scaffold number by 2.8% and increased the scaffold N50 by 0.21%. The final assembly has a total length of 643.80 Mb in 242 sequence scaffolds with a scaffold N50 of 29.1 Mb ( Table 2). The total count of gaps in the scaffolds is 373.
Table 2.: Genome assembly data for Solea solea, fSolSol10.1.
The snail plot in Figure 2 provides a summary of the assembly statistics, indicating the distribution of scaffold lengths and other assembly metrics. Figure 3 shows the distribution of scaffolds by GC proportion and coverage. Figure 4 presents a cumulative assembly plot, with separate curves representing different scaffold subsets assigned to various phyla, illustrating the completeness of the assembly.
Genome assembly of Solea solea, fSolSol10.1: metrics.The BlobToolKit snail plot shows N50 metrics and BUSCO gene completeness. The main plot is divided into 1,000 bins around the circumference with each bin representing 0.1% of the 643,774,986 bp assembly. The distribution of scaffold lengths is shown in dark grey with the plot radius scaled to the longest scaffold present in the assembly (47,064,963 bp, shown in red). Orange and pale-orange arcs show the N50 and N90 scaffold lengths (29,068,826 and 23,155,029 bp), respectively. The pale grey spiral shows the cumulative scaffold count on a log scale with white scale lines showing successive orders of magnitude. The blue and pale-blue area around the outside of the plot shows the distribution of GC, AT and N percentages in the same bins as the inner plot. A summary of complete, fragmented, duplicated and missing BUSCO genes in the actinopterygii_odb10 set is shown in the top right. An interactive version of this figure is available at https://blobtoolkit.genomehubs.org/view/fSolSol10_1/dataset/fSolSol10_1/snail.
Genome assembly of Solea solea, fSolSol10.1: Blob plot of base coverage in ERR11242127 against GC proportion for sequences in assembly fSolSol10.1.Sequences are coloured by phylum. Circles are sized in proportion to sequence length. Histograms show the distribution of sequence length sum along each axis. An interactive version of this figure is available at https://blobtoolkit.genomehubs.org/view/fSolSol10_1/dataset/fSolSol10_1/blob.
Genome assembly of Solea solea fSolSol10.1: BlobToolKit cumulative sequence plot.The grey line shows cumulative length for all sequences. Coloured lines show cumulative lengths of sequences assigned to each phylum using the buscogenes taxrule. An interactive version of this figure is available at https://blobtoolkit.genomehubs.org/view/fSolSol10_1/dataset/fSolSol10_1/cumulative.
Most of the assembly sequence (97.81%) was assigned to 21 chromosomal-level scaffolds. Chromosome-scale scaffolds confirmed by the Hi-C data are named in order of size ( Figure 5; Table 3). While not fully phased, the assembly deposited is of one haplotype. Contigs corresponding to the second haplotype have also been deposited. The mitochondrial genome was also assembled and can be found as a contig within the multifasta file of the genome submission.
Genome assembly of Solea solea fSolSol10.1: Hi-C contact map of the fSolSol10.1 assembly, visualised using HiGlass.Chromosomes are shown in order of size from left to right and top to bottom. An interactive version of this figure may be viewed at https://genome-note-higlass.tol.sanger.ac.uk/l/?d=FSUlLwVQRfiQQBsuU_Y3AQ.
Table 3.: Chromosomal pseudomolecules in the genome assembly of Solea solea, fSolSol10.
The estimated Quality Value (QV) of the final assembly is 60.9 with k-mer completeness of 99.36% (combined assemblies), and the assembly has a BUSCO v5.3.2 completeness of 98.3% (single = 97.2%, duplicated = 1.1%), using the actinopterygii_odb10 reference set ( n = 3,640). The assembly achieves the Earth BioGenome Project reference standard of 6.C.Q61, thus exceeding the minimum reference standard of 6.C.Q40. Other quality metrics are given in Table 2.
Genome annotation report
The Solea solea genome assembly (GCA_958295425.1) was annotated at the European Bioinformatics Institute (EBI) on Ensembl Rapid Release. The resulting annotation includes 51,064 transcribed mRNAs from 21,646 protein-coding and 1,553 non-coding genes ( Table 2; https://rapid.ensembl.org/Solea_solea_GCA_958295425.1/Info/Index). The average transcript length is 21,373.58. There are 2.20 coding transcripts per gene and 13.64 exons per transcript.
Methods
Sample acquisition
An adult Solea solea (specimen ID ERGA_FV_BE_019, ToLID fSolSol10) was collected from Kwintebank (North Sea; latitude 51.28, longitude 2.65) on 2021-08-19. The specimen was collected, identified and preserved by Filip A.M. Volckaert (KU Leuven). This specimen was used for genome sequencing and Hi-C data for scaffolding.
The specimen used for RNA sequencing (ToLID fSolSol7) was a juvenile specimen collected from Wenduinebank (W03) (North Sea; latitude 51.28, longitude 2.95) on 2021-07-21. The specimen was collected, identified and preserved by Filip A.M. Volckaert (KU Leuven).
Nucleic acid extraction
The workflow for high molecular weight (HMW) DNA extraction at the Wellcome Sanger Institute (WSI) Tree of Life Core Laboratory includes a sequence of core procedures: sample preparation and homogenisation, DNA extraction, fragmentation and purification. Detailed protocols are available on protocols.io ( Denton et al., 2023). The fSolSol10 sample was weighed and dissected on dry ice ( Jay et al., 2023) and gonad tissue was cryogenically disrupted using the Covaris cryoPREP ^®^ Automated Dry Pulverizer ( Narváez-Gómez et al., 2023).
HMW DNA was extracted using the Automated MagAttract v1 protocol ( Sheerin et al., 2023). DNA was sheared into an average fragment size of 12–20 kb in a Megaruptor 3 system ( Todorovic et al., 2023). Sheared DNA was purified by solid-phase reversible immobilisation, using AMPure PB beads to eliminate shorter fragments and concentrate the DNA ( Strickland et al., 2023). The concentration of the sheared and purified DNA was assessed using a Nanodrop spectrophotometer and Qubit Fluorometer using the Qubit dsDNA High Sensitivity Assay kit. Fragment size distribution was evaluated by running the sample on the FemtoPulse system.
RNA was extracted from gonad tissue of fSolSol7 in the Tree of Life Laboratory at the WSI using the RNA Extraction: Automated MagMax™ mirVana protocol ( do Amaral et al., 2023). The RNA concentration was assessed using a Nanodrop spectrophotometer and a Qubit Fluorometer using the Qubit RNA Broad-Range Assay kit. Analysis of the integrity of the RNA was done using the Agilent RNA 6000 Pico Kit and Eukaryotic Total RNA assay.
Hi-C preparation
Tissue from the gill of the fSolSol10 sample was processed at the WSI Scientific Operations core, using the Arima-HiC v2 kit. Tissue (stored at –80 °C) was fixed, and the DNA crosslinked using a TC buffer with 22% formaldehyde. After crosslinking, the tissue was homogenised using the Diagnocine Power Masher-II and BioMasher-II tubes and pestles. Following the kit manufacturer's instructions, crosslinked DNA was digested using a restriction enzyme master mix. The 5’-overhangs were then filled in and labelled with biotinylated nucleotides and proximally ligated. An overnight incubation was carried out for enzymes to digest remaining proteins and for crosslinks to reverse. A clean up was performed with SPRIselect beads prior to library preparation.
Library preparation and sequencing
Pacific Biosciences SMRTbell libraries were constructed using the Revio HiFi prep kit, according to the manufacturers’ instructions. DNA sequencing was performed by the Scientific Operations core at the WSI on a Pacific Biosciences Revio instrument.
For Hi-C library preparation, DNA was fragmented to a size of 400 to 600 bp using a Covaris E220 sonicator. The DNA was then enriched, barcoded, and amplified using the NEBNext Ultra II DNA Library Prep Kit following manufacturers’ instructions. The Hi-C sequencing was performed using paired-end sequencing with a read length of 150 bp on an Illumina NovaSeq 6000 instrument.
Poly(A) RNA-Seq libraries were constructed using the NEB Ultra II RNA Library Prep kit, following the manufacturer’s instructions. RNA sequencing was performed on the Illumina NovaSeq 6000 instrument.
Genome assembly, curation and evaluation
** Assembly **
The HiFi reads were first assembled using Hifiasm ( Cheng et al., 2021) with the --primary option. Haplotypic duplications were identified and removed using purge_dups ( Guan et al., 2020). The Hi-C reads were mapped to the primary contigs using bwa-mem2 ( Vasimuddin et al., 2019). The contigs were further scaffolded using the provided Hi-C data ( Rao et al., 2014) in YaHS ( Zhou et al., 2023) using the --break option. The scaffolded assemblies were evaluated using Gfastats ( Formenti et al., 2022), BUSCO ( Manni et al., 2021) and MERQURY.FK ( Rhie et al., 2020).
The mitochondrial genome was assembled using MitoHiFi ( Uliano-Silva et al., 2023), which runs MitoFinder ( Allio et al., 2020) and uses these annotations to select the final mitochondrial contig and to ensure the general quality of the sequence.
** Assembly curation **
The assembly was decontaminated using the Assembly Screen for Cobionts and Contaminants (ASCC) pipeline (article in preparation). Manual curation was primarily conducted using PretextView ( Harry, 2022), with additional insights provided by JBrowse2 ( Diesh et al., 2023) and HiGlass ( Kerpedjiev et al., 2018). Scaffolds were visually inspected and corrected as described by Howe et al. (2021). Any identified contamination, missed joins, and mis-joins were corrected, and duplicate sequences were tagged and removed. The curation process is documented at https://gitlab.com/wtsi-grit/rapid-curation (article in preparation).
** Evaluation of the final assembly **
A Hi-C map for the final assembly was produced using bwa-mem2 ( Vasimuddin et al., 2019) in the Cooler file format ( Abdennur & Mirny, 2020). To assess the assembly metrics, the k-mer completeness and QV consensus quality values were calculated in Merqury ( Rhie et al., 2020). This work was done using the “sanger-tol/readmapping” ( Surana et al., 2023a) and “sanger-tol/genomenote” ( Surana et al., 2023b) pipelines. The genome readmapping pipelines were developed using the nf-core tooling ( Ewels et al., 2020), use MultiQC ( Ewels et al., 2016), and make extensive use of the Conda package manager, the Bioconda initiative ( Grüning et al., 2018), the Biocontainers infrastructure ( da Veiga Leprevost et al., 2017), and the Docker ( Merkel, 2014) and Singularity ( Kurtzer et al., 2017) containerisation solutions. The genome was also analysed within the BlobToolKit environment ( Challis et al., 2020) and BUSCO scores ( Manni et al., 2021) were calculated.
Table 4 contains a list of relevant software tool versions and sources.
Genome annotation
The Ensembl Genebuild annotation system ( Aken et al., 2016) was used to generate annotation for the Solea solea assembly (GCA_958295425.1) in Ensembl Rapid Release at the EBI. Annotation was created primarily through alignment of transcriptomic data to the genome, with gap filling via protein-to-genome alignments of a select set of proteins from UniProt ( UniProt Consortium, 2019).
Wellcome Sanger Institute – Legal and Governance
The materials that have contributed to this genome note have been supplied by a Tree of Life collaborator.
The Wellcome Sanger Institute employs a process whereby due diligence is carried out proportionate to the nature of the materials themselves, and the circumstances under which they have been/are to be collected and provided for use. The purpose of this is to address and mitigate any potential legal and/or ethical implications of receipt and use of the materials as part of the research project, and to ensure that in doing so we align with best practice wherever possible.
The overarching areas of consideration are:
• Ethical review of provenance and sourcing of the material
• Legality of collection, transfer and use (national and international)
Each transfer of samples is undertaken according to a Research Collaboration Agreement or Material Transfer Agreement entered into by the Tree of Life collaborator, Genome Research Limited (operating as the Wellcome Sanger Institute) and in some circumstances other Tree of Life collaborators.
The reference list from the paper itself. Each links out to its DOI / PubMed record.
- 1Abdennur N Mirny LA : Cooler: scalable storage for Hi-C data and other genomically labeled arrays. Bioinformatics. 2020;36(1):311–316. 10.1093/bioinformatics/btz 540 31290943 PMC 8205516 · doi ↗ · pubmed ↗
- 2Aken BL Ayling S Barrell D : The ensembl gene annotation system. Database (Oxford). 2016;2016: baw 093. 10.1093/database/baw 093 27337980 PMC 4919035 · doi ↗ · pubmed ↗
- 3Allio R Schomaker-Bastos A Romiguier J : Mito Finder: efficient automated large-scale extraction of mitogenomic data in target enrichment phylogenomics. Mol Ecol Resour. 2020;20(4):892–905. 10.1111/1755-0998.13160 32243090 PMC 7497042 · doi ↗ · pubmed ↗
- 4Challis R Richards E Rajan J : Blob Tool Kit – interactive quality assessment of genome assemblies. G 3 (Bethesda). 2020;10(4):1361–1374. 10.1534/g 3.119.400908 32071071 PMC 7144090 · doi ↗ · pubmed ↗
- 5Cheng H Concepcion GT Feng X : Haplotype-resolved de novo assembly using phased assembly graphs with hifiasm. Nat Methods. 2021;18(2):170–175. 10.1038/s 41592-020-01056-5 33526886 PMC 7961889 · doi ↗ · pubmed ↗
- 6da Veiga Leprevost F Grüning BA Alves Aflitos S : Bio Containers: an open-source and community-driven framework for software standardization. Bioinformatics. 2017;33(16):2580–2582. 10.1093/bioinformatics/btx 192 28379341 PMC 5870671 · doi ↗ · pubmed ↗
- 7Denton A Yatsenko H Jay J : Sanger Tree of Life wet laboratory protocol collection V.1. protocols.io. 2023. 10.17504/protocols.io.8epv 5xxy 6g 1b/v 1 · doi ↗
- 8Diesh C Stevens GJ Xie P : J Browse 2: a modular genome browser with views of synteny and structural variation. Genome Biol. 2023;24(1): 74. 10.1186/s 13059-023-02914-z 37069644 PMC 10108523 · doi ↗ · pubmed ↗