Safety of transarterial chemoembolization on renal function in combined hepatocellular carcinoma and chronic kidney disease patients
Zu‐Yau Lin, Ming‐Lun Yeh, Po‐Cheng Liang, Chung‐Feng Huang, Jee‐Fu Huang, Chia‐Yen Dai, Ming‐Lung Yu, Wan‐Long Chuang

TL;DR
This study found that transarterial chemoembolization (TACE) is safe for kidney function in patients with liver cancer and chronic kidney disease, with most showing improved kidney function.
Contribution
The study demonstrates that TACE has similar effects on kidney function in patients with and without chronic kidney disease.
Findings
Most patients showed improved renal function after TACE, regardless of CKD status.
Low serum albumin, proteinuria, and poor diabetes control worsened kidney function after TACE.
TACE had no significant difference in renal impact between CKD and non-CKD patients.
Abstract
This study was to investigate the safety of transarterial chemoembolization (TACE) which required injection of contrast medium on renal function in combined hepatocellular carcinoma and chronic kidney disease (CKD) patients. A total of 265 patients admitted for the first session of TACE were included for analysis. CKD was defined as Cockcroft‐Gault glomerular filtration rate (CG‐GFR) < 60 mL/min/1.73 m2. The odds ratio (OR) and 95% confident interval (CI) were calculated to show the influence of factors on renal function. Overall, 24.07% patients with CKD and 31.21% patients without CKD showed exacerbated renal function at discharge. However, 73.15% patients with CKD and 63.69% patients without CKD showed significantly improved renal function (all p = 0.00001). No significant difference in influence of TACE on renal function between patients with and without CKD (p = 0.20509). Factors…
Genes, proteins, chemicals, diseases, species, mutations and cell lines named across the full text — each resolved to its canonical identifier and authoritative record.
Click any figure to enlarge with its caption.
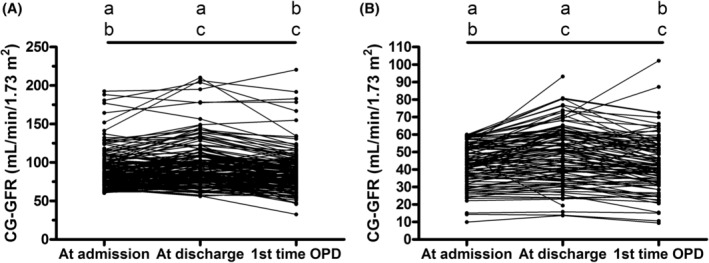 FIGURE 1
| Total | cTACE | TACE using DEMs |
| |
|---|---|---|---|---|
| (A) Characteristics of patients | 265 | 200 | 65 | |
| Age (year) | 40–99, 68 | 40–99, 67.5 | 41–92, 68 | 0.238 |
| Sex (male/female) | 173/92 | 133/67 | 40/25 | 0.46542 |
| Hypertension (−/+) | 111/154 | 83/117 | 28/37 | 0.0501 |
| Diabetes mellitus (−/+) | 157/108 | 117/83 | 40/25 | 0.1876 |
| HbA1c (%) | ||||
| <7 | 224 | 168 | 56 | 0.120947 |
| 7–8 | 24 | 16 | 8 | |
| >8 | 17 | 16 | 1 | |
| LC (−/+) | 106/159 | 76/124 | 30/35 | 0.243715 |
| (a) No LC or LC Child‐Pugh class A | 241 | 181 | 60 | 0.8059 |
| (b) LC Child‐Pugh class B | 24 | 19 | 5 | |
| CG‐GFR (mL/min/1.73 m2) | ||||
| ≥60 | 157 | 120 | 37 | 0.428327 |
| 45–59 | 53 | 42 | 11 | |
| <45 | 55 | 38 | 17 | |
| Proteinuria (negative/≥1+) | 221/44 | 165/35 | 56/9 | 0.491618 |
| Etiologies of hepatocellular carcinoma | NA | |||
| CHB/CHC/alcohol/CHB + CHC/CHB + CHD/CHB + alcohol/CHC + alcohol/MAFLD/unknown | 90/75/16/4/1/19/12/7/41 | 67/59/15/1/0/16/11/4/27 | 23/16/1/3/1/3/1/3/14 | |
| AJCC tumor staging | ||||
| I | 67 | 48 | 19 | 0.103778 |
| II | 81 | 68 | 13 | |
| ≥III | 117 | 84 | 33 | |
| Embolized tumor size | ||||
| <5 cm | 122 | 100 | 22 | 0.002717 |
| 5–10 cm | 88 | 68 | 20 | |
| >10 cm | 55 | 32 | 23 | |
| Embolized epirubicin (mg) | 1.7–180, 20 | 1.7–150, 18.45 | 2.5–180, 88 | <0.00001 |
| Duration of admission (day) | 3–29, 6 | 3–22, 6 | 3–29, 6 | 0.09492 |
| Total IV fluid at day of TACE (mL) | 500–3350, 1150 | 500–3000, 1075 | 500–3350, 1400 | 0.1443 |
| (B) Adverse events of TACE | ||||
| Blood bilirubin increased | ||||
| None | 79 | 63 | 16 | 0.653567 |
| Grade 1 | 116 | 87 | 29 | |
| Grade 2 | 65 | 46 | 19 | |
| Grade 3 | 5 | 4 | 1 | |
| Alanine aminotransferase increased | ||||
| None | 31 | 25 | 6 | 0.792236 |
| Grade 1 | 121 | 90 | 31 | |
| Grade 2 | 55 | 43 | 12 | |
| Grade 3 and 4 | 58 | 42 | 16 | |
| Blood creatinine increased | ||||
| None | 223 | 164 | 59 | 0.092604 |
| Grade 1 and 2 | 42 | 36 | 6 | |
| Anemia | ||||
| None | 59 | 47 | 12 | 0.106364 |
| Grade 1 | 135 | 101 | 34 | |
| Grade 2 | 67 | 51 | 16 | |
| Grade 3 | 4 | 1 | 3 | |
|
Upper gastrointestinal Hemorrhage | ||||
| None | 261 | 198 | 63 | 0.2529 |
| Grade 3 | 4 | 2 | 2 | |
| Esophageal hemorrhage | ||||
| None | 264 | 200 | 64 | 0.2453 |
| Grade 5 | 1 | 0 | 1 | |
| Bacteremia | ||||
| None | 264 | 199 | 65 | 1 |
| Grade 2 | 1 | 1 | 0 | |
| Sepsis | ||||
| None | 264 | 199 | 65 | 1 |
| Grade 3 | 1 | 1 | 0 | |
| Lung infection | ||||
| None | 264 | 199 | 65 | 1 |
| Grade 3 | 1 | 1 | 0 | |
| Pleural effusion | ||||
| None | 264 | 199 | 65 | 1 |
| Grade 2 | 1 | 1 | 0 | |
| Ascites | ||||
| None | 263 | 199 | 64 | 0.4311 |
| Grade 2 | 2 | 1 | 1 | |
| Heart failure | ||||
| None | 264 | 200 | 64 | 0.2453 |
| Grade 5 | 1 | 0 | 1 | |
| Hypokalemia | ||||
| None | 263 | 198 | 65 | 1 |
| Grade 3 | 2 | 2 | 0 | |
| Improvement | Exacerbation | No change | Total |
| |
|---|---|---|---|---|---|
| (A) CG‐GFR (mL/min/1.73 m2) | |||||
| (1) Discharge vs. admission | 179 | 75 | 11 | 265 | <0.00001 |
| (a) CG‐GFR ≥ 60 | 100 | 49 | 8 | 157 | 0.00001 |
| (b) CG‐GFR < 60 | 79 | 26 | 3 | 108 | 0.00001 |
| (2) First time OPD vs. admission | 113 | 129 | 9 | 251 | 0.30371 |
| (a) CG‐GFR ≥ 60 | 63 | 82 | 7 | 152 | 0.1146 |
| (b) CG‐GFR < 60 | 50 | 47 | 2 | 99 | 0.76067 |
| (3) First time OPD vs. discharge | 65 | 180 | 6 | 251 | <0.00001 |
| (a) CG‐GFR ≥ 60 | 42 | 105 | 5 | 152 | <0.00001 |
| (b) CG‐GFR < 60 | 23 | 75 | 1 | 99 | <0.00001 |
| (B) Creatinine level (mg/dL) | |||||
| (1) Third day after TACE vs. admission | 166 | 86 | 9 | 261 | <0.00001 |
| (a) CG‐GFR ≥ 60 | 91 | 57 | 7 | 155 | 0.00414 |
| (b) CG‐GFR < 60 | 75 | 29 | 2 | 106 | 0.00002 |
| (2) Third day after TACE vs. discharge | 61 | 32 | 3 | 96 | 0.00264 |
| (a) CG‐GFR ≥ 60 | 34 | 18 | 2 | 54 | 0.0265 |
| (b) CG‐GFR < 60 | 27 | 14 | 1 | 42 | 0.04233 |
| Serum creatinine (mg/dL) | Odds ratio | 95% CI |
| ||
|---|---|---|---|---|---|
| Increase ( | Decrease or no change ( | ||||
| (A) Factors at admission | |||||
| Hypertension (+/−) | 57/29 | 95/80 | 1.6552 | 0.9675–2.8317 | 0.0659 |
| Diabetes mellitus (+/−) | 39/47 | 67/108 | 1.3376 | 0.7931–2.2558 | 0.2754 |
| HbA1c (%) ≥ 7 (+/−) | 19/67 | 21/154 | 2.0796 | 1.0497–4.1200 | 0.0358 |
| HbA1c (%) ≥ 7.5 (+/−) | 14/72 | 17/158 | 1.8072 | 0.8449–3.8654 | 0.1271 |
| HbA1c (%) ≥ 8 (+/−) | 7/79 | 13/162 | 1.1042 | 0.4239–2.8764 | 0.8392 |
| Liver cirrhosis (+/−) | 53/33 | 103/72 | 1.1227 | 0.6617–1.9049 | 0.6679 |
| Liver cirrhosis Child‐Pugh class B (+/−) | 10/76 | 14/161 | 1.5132 | 0.6428–3.5620 | 0.3430 |
| Serum albumin <3 g/dL (+/−) | 7/79 | 6/169 | 2.4958 | 0.8121–7.6698 | 0.1103 |
| Hemoglobin <10 g/dL (+/−) | 14/72 | 29/146 | 0.9789 | 0.4873–1.9664 | 0.9523 |
| CG‐GFR (mL/min/1.73 m2) < 60 (+/−) | 29/57 | 77/98 | 0.6475 | 0.3783–1.1084 | 0.1131 |
| CG‐GFR (mL/min/1.73 m2) < 45 (+/−) | 11/75 | 43/132 | 0.4502 | 0.2191–0.9253 | 0.0299 |
| Proteinuria ≥1+ (+/−) | 21/65 | 22/153 | 2.2469 | 1.1559–4.3675 | 0.0170 |
| AJCC tumor staging ≥ III (+/−) | 45/41 | 71/104 | 1.6077 | 0.9561–2.7034 | 0.0734 |
| (B) Factors within 3 days after TACE | |||||
| Embolized tumor size ≥5 cm (+/−) | 52/34 | 89/86 | 1.4779 | 0.8750–2.4961 | 0.1441 |
| TACE using DEMs (+/−) | 22/64 | 41/134 | 1.1235 | 0.6181–2.0420 | 0.7025 |
| Total IV fluid at day of TACE <1000 mL (+/−) | 6/80 | 8/167 | 1.5656 | 0.5256–4.6638 | 0.4209 |
| Total IV fluid within 3 days after TACE <1000 mL (+/−) | 3/83 | 7/168 | 0.8675 | 0.2187–3.4407 | 0.8397 |
| CG‐GFR (mL/min/1.73 m2) < 60 patients treated with NAC | 10/21 | 30/45 | 0.7143 | 0.2952–1.7281 | 0.4554 |
| CG‐GFR (mL/min/1.73 m2) | Odds ratio | 95% CI |
| ||
|---|---|---|---|---|---|
| Decrease ( | Increase or no change ( | ||||
| (A) Factors at admission | |||||
| Hypertension (+/−) | 44/31 | 110/80 | 1.0323 | 0.6001–1.7756 | 0.9087 |
| Diabetes mellitus (+/−) | 36/39 | 72/118 | 1.5128 | 0.8820–2.5949 | 0.1326 |
| HbA1c (%) ≥ 7 (+/−) | 16/59 | 25/165 | 1.7898 | 0.8938–3.5841 | 0.1004 |
| HbA1c (%) ≥ 7.5 (+/−) | 13/62 | 18/172 | 2.0036 | 0.9275–4.3282 | 0.0770 |
| HbA1c (%) ≥ 8 (+/−) | 7/68 | 13/177 | 1.4016 | 0.5364–3.6622 | 0.4909 |
| Liver cirrhosis (+/−) | 47/28 | 112/78 | 1.1690 | 0.6745–2.0262 | 0.5779 |
| Liver cirrhosis Child‐Pugh class B (+/−) | 10/65 | 14/176 | 1.9341 | 0.8185–4.5702 | 0.1327 |
| Serum albumin <3 g/dL (+/−) | 8/67 | 5/185 | 4.4179 | 1.3964–13.9776 | 0.0115 |
| Hemoglobin <10 g/dL (+/−) | 15/60 | 28/162 | 1.4464 | 0.7229–2.8941 | 0.2969 |
| CG‐GFR (mL/min/1.73 m2) < 60 (+/−) | 26/49 | 82/108 | 0.6989 | 0.4010–1.2180 | 0.2061 |
| CG‐GFR (mL/min/1.73 m2) < 45 (+/−) | 11/64 | 44/146 | 0.5703 | 0.2767–1.1753 | 0.1280 |
| Proteinuria ≥1+ (+/−) | 17/58 | 27/163 | 1.7695 | 0.8993–3.4816 | 0.0984 |
| AJCC tumor staging ≥ III (+/−) | 38/37 | 79/111 | 1.4430 | 0.8436–2.4684 | 0.1805 |
| (B) Factors during admission | |||||
| Embolized tumor size ≥5 cm (+/−) | 42/33 | 101/89 | 1.1215 | 0.6551–1.9200 | 0.6759 |
| TACE using DEMs (+/−) | 16/59 | 49/141 | 0.7804 | 0.4111–1.4814 | 0.4482 |
| Grade 3 to Grade 5 adverse events of TACE (+/−) | 20/55 | 49/141 | 1.0464 | 0.5707–1.9186 | 0.8835 |
| Admission days ≥7 days (+/−) | 31/44 | 66/124 | 1.3237 | 0.7652–2.2899 | 0.3160 |
| CG‐GFR (mL/min/1.73 m2) | Odds ratio | 95% CI |
| ||
|---|---|---|---|---|---|
| Decrease ( | Increase or no change ( | ||||
| (A) Factors at admission | |||||
| Hypertension (+/−) | 110/70 | 36/35 | 1.5278 | 0.8784–2.6571 | 0.1334 |
| Diabetes mellitus (+/−) | 70/110 | 34/37 | 0.6925 | 0.3981–1.2048 | 0.1934 |
| HbA1c (%) ≥ 7 (+/−) | 25/155 | 15/56 | 0.6022 | 0.2962–1.2240 | 0.1610 |
| HbA1c (%) ≥ 7.5 (+/−) | 19/161 | 12/59 | 0.5802 | 0.2655–1.2681 | 0.1724 |
| HbA1c (%) ≥ 8 (+/−) | 13/167 | 7/64 | 0.7117 | 0.2717–1.8643 | 0.4888 |
| Liver cirrhosis (+/−) | 110/70 | 41/30 | 1.1498 | 0.6580–2.0093 | 0.6240 |
| Liver cirrhosis Child‐Pugh class B (+/−) | 18/162 | 5/66 | 1.4667 | 0.5229–4.1137 | 0.4667 |
| CG‐GFR (mL/min/1.73 m2) < 60 (+/−) | 75/105 | 24/47 | 1.3988 | 0.7878–2.4837 | 0.2519 |
| CG‐GFR (mL/min/1.73 m2) < 45 (+/−) | 38/142 | 14/57 | 1.0895 | 0.5489–2.1625 | 0.8063 |
| Proteinuria ≥1+ (+/−) | 28/152 | 13/58 | 0.8219 | 0.3984–1.6953 | 0.5954 |
| AJCC tumor staging ≥ III (+/−) | 66/114 | 45/26 | 0.3345 | 0.1891–0.5916 | 0.0002 |
| (B) Factors during admission | |||||
| Embolized tumor size ≥5 cm (+/−) | 87/93 | 50/21 | 0.3929 | 0.2183–0.7071 | 0.0018 |
| TACE using DEMs (+/−) | 49/131 | 12/59 | 1.8391 | 0.9113–3.7113 | 0.0890 |
| Adverse events of TACE ≥ Grade 3 (+/−) | 41/139 | 28/43 | 0.4530 | 0.2511–0.8170 | 0.0085 |
| Admission days ≥7 days (+/−) | 59/121 | 34/37 | 0.5306 | 0.3031–0.9290 | 0.0266 |
| (C) Factors at the first time OPD | |||||
| Hemoglobin <10 g/dL (+/−) | 23/139 | 10/55 | 0.9101 | 0.4067–2.0364 | 0.8186 |
| Serum albumin <3 g/dL (+/−) | 8/125 | 1/54 | 3.4560 | 0.4218–28.3142 | 0.2478 |
| Total bilirubin >2 mg/dL (+/−) | 16/151 | 2/68 | 3.6026 | 0.8058–16.1074 | 0.0935 |
Peer Reviews
No public reviews on file for this paper yet. If you reviewed it on a platform where reviews are public (OpenReview, ICLR, NeurIPS, ICML), you can paste yours below so the community can read it here.
Videos
No videos yet. Explain this paper in a talk, walkthrough, or lecture? Add one.
Taxonomy
TopicsLiver Disease Diagnosis and Treatment · Liver Disease and Transplantation · Hepatocellular Carcinoma Treatment and Prognosis
INTRODUCTION
1
Transarterial chemoembolization (TACE) is a well‐established standard treatment for intermediate‐stage hepatocellular carcinoma (HCC).1 This treatment requires injection of contrast medium for angiographic location of target for embolization. Contrast‐induced nephropathy (CIN) is an iatrogenic acute kidney injury characterized by progressive decline in kidney function within a few days of contrast medium administration.2, 3, 4, 5, 6 Low glomerular filtration rates, diabetes mellitus (DM), congestive heart failure, intraarterial intervention, higher volume of contrast, volume depletion, old age, multiple myeloma, hypertension, and hyperuricemia had been described to increase the prevalence of CIN.2, 5, 6 Chronic hepatitis B and C virus infection, alcohol and metabolic associated fatty liver disease (MAFLD)7, 8 are important risk factors for HCC.9 Hepatitis B and C related glomerulonephritis as well as IgA nephropathy are well established extra‐hepatic manifestations in patients with chronic liver disease.10 The diagnostic criteria for MAFLD are based on evidence of hepatic steatosis, in addition to one of the following three criteria, namely overweight/obesity, presence of type 2 DM, or evidence of metabolic dysregulation.8 This indicates that MAFLD has the potential to involve renal damage. The renal function in patients with HCC treated by TACE are thus in risk to induce CIN. Patients with chronic kidney disease (CKD) may hesitate to receive TACE for fear of further exacerbation of renal function even progression to end stage renal disease due to CIN. However, the real‐word safety of TACE on renal function in combined hepatocellular carcinoma and chronic kidney disease patients has not been well clarified. Understanding the impact of TACE on renal function and the influence factors in patients with HCC can provide critical information for the treatment of these patients. The purposes of this study were to elucidate these issues.
PATIENTS AND METHODS
2
From January 2017 to January 2023, a total of 265 consecutive patients admitted to our institution to receive the first session of TACE for the treatment of HCC were enrolled for this retrospective study. Among these patients, 242 patients were newly diagnosed HCC and the remaining 23 patients were previously treated by other methods for HCC. Patients presenting life‐threating acute illness such as cerebral or cardiovascular infarction, infection, gastrointestinal hemorrhage or rupture of HCC and patients under hemodialysis or peritoneal dialysis were excluded. The personal past medical history, admission records and the laboratory data from day of admission till the first time visit in outpatient department (OPD) after discharge were collected for analysis. Since all patients needed fasting for at least 8 h before TACE and usually suffered from abdominal discomfort after TACE leading to decreased appetite, routine intravenous hydration before and after TACE was applied to all patients. No particularly fixed hydration protocol was applied to these patients. The basic rule to determine the amount of intravenous hydration was based on the individual condition of the patient. All patients received complete angiographic examination from celiac trunk, superior mesenteric artery, right hepatic artery and left hepatic artery to locate the target for embolization. Nonionic, water‐soluble Ultravist®‐370 (Iopromide with iodine 370 mg/mL, Bayer Taiwan Company Ltd. 53 & 54F, No. 7, Sec. 5 Xinyi Road Taipei 101, Taiwan, ROC) was applied as contrast medium for angiography. The total amount of injected contrast medium in each session of TACE ranged from 50 to 70 mL. Embolization of HCC was accomplished by either conventional method (cTACE) or using drug‐eluting microspheres (DEMs). The applied DEMs included DC Bead™ (Boston Scientific Corporation, 300 Boston Scientific Way, Marlborough, MA 01752‐1234, USA), HepaSphere™ (Merit Medica, 1600 West Merit Parkway, South Jordan, UT 84095, USA) or TANDEM™ (CeloNova BioSciences, Inc. San Antonio, CE 0086, USA). The embolized chemotherapeutic agent was epirubicin. Part of patients in cTACE group also received mitomycin C. The adverse events of TACE were recorded based on the Common Terminology Criteria for Adverse Events (CTCAE) Version 5.0 published at November 27, 2017. The American Joint Committee on Cancer (AJCC) TNM staging system 8th edition was applied for tumor staging. Evaluation of renal function was based on serum creatinine level to calculate the Cockcroft‐Gault glomerular filtration rate (CG‐GFR). CKD was defined as CG‐GFR < 60 mL/min/1.73 m^2^. This study was approved by the Institutional Review Board.
Statistical analysis
2.1
The Mann–Whitney U test, t‐test, Fisher exact test and chi‐square test were applied for the calculation the significant difference between two groups. The non‐parametric sign test was used to evaluate the results of a repeated‐measures study. The odds ratio (OR) and 95% confident interval (CI) were calculated to show the influence of factors on renal function. The statistical significance was defined as p < 0.05.
RESULTS
3
Characteristics of patients and adverse events of TACE
3.1
Table 1 shows the characteristics of patients and adverse events of TACE. The lowest CG‐GFR in this study was 9.96 mL/min/1.73 m^2^. Total intravenous fluid injection at day of TACE ranged from 500 to 3350 mL with the median of 1150 mL. Among patients using DEMs, DC Bead™ was applied in 23 patients, HepaSphere™ in 20 patients and TANDEM™ in the remaining 22 patients. Patient received DEMs showed significantly larger embolized tumor size (p = 0.002717) and higher dose of embolized epirubicin (p < 0.00001) than cTACE group. However, there was no significant difference in duration of admission and adverse events between cTACE and DEMs groups. Overall, two patients (0.75%) expired during admission. One patient (T3N0M0, stage IIIA, embolized tumor size 12.8 cm) combined with congestive heart failure expired 4 days after TACE due to acute myocardial infarction complicated with cardiogenic shock and lactic acidosis. Another one patient (T4N1M0, stage IVA, embolized tumor size 13.5 cm) expired 23 days after TACE due to rupture of esophageal varices. Although both patients belonged to DEMs group, there was no significant difference in mortality during admission between cTACE group and DEMs group (p = 0.0595). Patients with embolized tumor size ≥5 cm showed significantly longer admission days (7.8 ± 4.5 days vs. 5.1 ± 2.39 days, p < 0.00001) and higher incidence of ≥grade 3 adverse events (p = 0.002498) than patients with embolized tumor size <5 cm. None of the patients suffered from ≥grade 3 adverse event of increase in serum creatinine level during admission.
Serial changes in renal function
3.2
Table 2 and Figure 1 show serial changes in renal function from admission to the first time OPD. Overall, 73.15% patients with CKD (p = 0.00001) and 63.69% patients without CKD (p = 0.00001) showed significantly improved renal function at discharge compared to the data collected at admission. However, the data collected at the first time OPD in patients either with or without CKD showed significantly exacerbated renal function compared to discharge (75.76%, p < 0.00001; 69.08%, p < 0.00001, respectively) but no significant difference with data at admission. The serum creatinine levels detected at the third day after TACE in patients either with or without CKD showed significant improvement compared to the data collected at admission (70.75%, p = 0.00002; 58.71%, p = 0.00414, respectively). Patients either with or without CKD also showed further significant improvement in serum creatinine levels at discharge compared to the data collected at the third day after TACE (64.29%, p = 0.04233; 62.96%, p = 0.0265, respectively). Overall, 27.36% patients with CKD and 36.77% patients without CKD showed increased serum creatinine levels at the third day after TACE. Admission for more than 3 days after TACE decreased the serum creatinine levels in part of the patients and finally 24.07% patients with CKD and 31.21% patients without CKD showed exacerbated renal function at discharge.
Changes of CG‐GFR from admission to the first time OPD. (A) patients with CG‐GFR ≥ 60 mL/min/1.73 m2, a: p = 0.00001, b: p = 0.1146, c: p < 0.0001. (B) patients with CG‐GFR < 60 mL/min/1.73 m2, a: p = 0.00001, b: p = 0.76067, c: p < 0.0001. Only 251 patients had the first time OPD data for comparison. Sign test was applied for the statistical analysis. CG‐GFR, Cockcroft‐Gault glomerular filtration rate; OPD, Outpatient department.
Factors to influence the renal function
3.3
Table 3 shows the odds ratio of factors to increase the serum creatinine level at the third day after TACE. Patients with proteinuria ≥1+ showed the OR of 2.2469 (95% CI = 1.1559 to 4.3675, p = 0.0170) and DM patients with glycated hemoglobin (HbA1c) ≥ 7% showed the OR of 2.0796 (95% CI = 1.0497 to 4.1200, p = 0.0358) to increase the creatinine levels at the third day after TACE. On the contrary, the OR of 0.4502 (95% CI = 0.2191 to 0.9253, p = 0.0299) to increase serum creatinine level at the third day after TACE were detected in patients with CG‐GFR < 45 mL/min/1.73 m^2^. Exclusion the patients with proteinuria ≥1+, DM patients with HbA1c ≥ 7% showed the OR of 2.9375 (95% CI = 1.2598 to 6.8495, p = 0.0126) and DM patients with HbA1c ≥ 7.5% showed the OR of 2.6296 (95% CI = 1.0771 to 6.4199, p = 0.0337) to increase the serum creatinine levels at the third day after TACE. On the contrary, patients with CG‐GFR < 60 mL/min/1.73 m^2^ showed the OR of 0.3875 (95% CI = 0.1946 to 0.7718, p = 0.0070) and patients with CG‐GFR < 45 mL/min/1.73 m^2^ showed the OR of 0.0668 (95% CI = 0.0089 to 0.5017, p = 0.0085) to increase serum creatinine level at the third day after TACE (Table S1). Table 4 shows the OR of factors to exacerbate renal function at discharge compared to the data at admission. Only serum albumin level <3 g/dL at admission was the factor to exacerbate renal function at discharge (OR 4.4179, 95% CI = 1.3964 to 13.9776, p = 0.0115). Table 5 shows the OR of factors to exacerbate renal function at the 1st time OPD after discharge compared to the data at discharge. AJCC tumor staging ≥III (OR 0.3345, CI = 0.1891 to 0.5916, p = 0.0002), embolized tumor size ≥5 cm (OR 0.3929, CI = 0.2183 to 0.7071, p = 0.0018), adverse events of TACE ≥Grade 3 (OR 0.4530, CI = 0.2511 to 0.8170, p = 0.0085) and admission days ≥7 days (OR 0.5306, CI = 0.3031 to 0.9290, p = 0.0266) showed as benefit factors to continue improvement in renal function detected at the first time OPD compared to discharge.
DISCUSSION
4
TACE can be carried out by either cTACE or using DEMs. Although the embolized tumor size and the dose of embolized epirubicin in DEMs group were significantly larger than cTACE group, there was no significant difference in the occurrence of adverse events between cTACE and DEMs groups. This suggests that there was no significant difference in the effect of kidney function between the two groups. Therefore, the data from both groups could be combined for further analysis.
Acute renal damage in HCC patients receiving TACE can be caused by tumor lysis syndrome, nephrotoxic effects of chemotherapeutic agent or CIN. Tumor lysis syndrome results from massive tumor cell lysis with sudden and rapid release of nuclear and cytoplasmic degradation products of malignant cells leading to severe alterations in the metabolic profile.11, 12, 13, 14, 15 Acute kidney injury due to tumor lysis is potentiated by the precipitation of uric acid and calcium phosphate as well as renal vasoconstriction.12 Hepatocellular carcinoma is the most frequently reported solid tumor complicated this syndrome after treatment11, 13, 15 especially after TACE.13 Only two patients in DEMs group suffered from grade 2 adverse event of increase in serum creatinine level. Therefore, tumor lysis syndrome could not be the explanation for the exacerbation of renal function caused by TACE in the present study. Mitomycin C is a well‐known dose‐dependent nephrotoxic drug occurring at cumulative dose levels of 30 mg/m^2^ or more.16 The applied mitomycin C doses in 72 cTACE group patients were far low away from this level and none of patients in cTACE group showed larger than grade 1 adverse event of increase in serum creatinine level during admission. Therefore, CIN was the most possible explanation for the exacerbation of renal function caused by TACE in the study. The possible mechanisms of CIN include direct nephrotoxic effect of contrast media on tubular epithelial cells, release of vasoactive molecules, intrarenal vasoconstriction, excessive production of reactive oxygen species and epigenetic regulation in contrast‐induced nephropathy.3, 4, 5, 6 Adequate personal hydration can reduce the occurrence of CIN.3, 4 The incidence of exacerbation of renal function caused by TACE detected at discharge in the present study was around 24%–32%. On the contrary, patients either with or without CKD showed significantly improved renal function at discharge. Moreover, prolonged admission for more than 3 days after TACE could further significantly improve the renal function in part of the patients either with or without CKD. These results indicate that adequate intravenous hydration from day of TACE combined with proper individual medical care during admission was an efficient way to prevent exacerbation or to improve the renal function in patients receiving TACE including those with CKD. Improvement of renal function at the third days after TACE simply by intravenous hydration especially in patients with low CG‐GFR suggests that the impaired renal function at admission in these patients could be partially explained by insufficient effective blood volume. However, patients either with or without CKD showed significantly exacerbated renal function at the first time OPD. On the other hand, AJCC tumor staging ≥III, embolized tumor size ≥5 cm, adverse events of TACE ≥grade 3 and admission days ≥7 days became benefit factors to continue improvement in renal function after discharge. These factors were closely related. In comparison with patients with AJCC tumor staging <III or tumor size <5 cm, patients with AJCC tumor staging ≥III or tumor size ≥5 cm usually showed more severe adverse events of TACE and admitted for longer duration to receive intensive care. These patients were allowed to discharge only at their very stable condition. This may explain why the renal function in these patients could continue to improve after discharge. These findings pointed out the important issues including timing for discharge and education for adequate daily hydration and self‐care to prevent re‐exacerbation of renal function after discharge.
Serum albumin is the main plasma protein to maintain the intravascular oncotic pressure to oppose both the intravascular hydrostatic blood pressure and the interstitial colloidal osmotic pressure.17, 18, 19 Low serum albumin level not only can precipitate accumulation of excess extravascular fluid but also can resulting insufficient effective blood volume which can further exacerbate renal function. TACE can cause various degrees of adverse effects such as decrease in appetite, abdominal discomfort, hepatic damage and fever which can further decrease serum albumin level due to decrease in oral intake and/or hepatic synthesis. The effective blood volume may become insufficient and thus to exacerbate the renal function. Intravenous hydration without keeping adequate serum albumin level is unable to correct insufficient effective blood volume and can induce accumulation of fluid in extravascular space. Therefore, low serum albumin level at admission became the unfavored factor to exacerbate renal function at discharge. Low serum albumin level at admission was not an exacerbated factor for renal function at the third day after TACE might be due to short comparative interval and other factors including proteinuria and poor DM control to mask its influence. Proteinuria indicates the presence of renal damage and the possibility of hypoalbuminemia. Poor DM control also indicates combined chronic kidney injury.20, 21 Injection of contrast medium in these patients can further induce renal damage.2, 5, 6 This can explain by why proteinuria and poor DM control increased serum creatinine level at the third day after TACE. However, these unfavored factors could be obliterated during further admission for more than 3 days. This again emphasize the importance of proper medical care during admission.
N‐acetylcysteine is an antioxidant which has been described for the potential of protection against CIN. Although the patient number was not large, the present study did not show significant benefit of N‐acetylcysteine to prevent exacerbation of renal function after TACE in patients with low CG‐GFR. This result was in accordance with the previous reports.22
The weakness of the present study was data originated from only one medical center. Moreover, most HCC were caused by chronic viral hepatitis rather than MAFLD or alcohol. Further studies using predominant MAFLD or alcohol induced HCC are required to complement our results. On the other hand, the non‐parametric sign test rather than paired t test was applied for statistical calculation because several data were markedly skewed. The reason to collect data form patients who underwent TACE for the first time rather than multiple TACE from the same patients was to minimize statistical bias due to individual effects.
In conclusion, TACE exerted same influence on renal function between patients with and without CKD. Low serum albumin level, proteinuria and poor diabetes mellitus control were factors to exacerbate renal function after TACE. On the contrary, most patients either with or without CKD showed improved renal function at discharge which pointed out the importance of medical care and timing for discharge. For the prevention of re‐exacerbation of renal function after discharge, personal education for adequate daily hydration and self‐care were mandatory.
CONFLICT OF INTEREST STATEMENT
The authors declare no conflict of interest.
ETHICS STATEMENT
This study was approved by the Institutional Review Board (Kaohsiung Medical University Chung‐Ho Memorial Hospital, KMUHIRB‐E(I)‐20240274). Waiver of informed consent for this study was approved by the Institutional Review Board of the hospital.
Supporting information
Table S1
Appendix S1
The reference list from the paper itself. Each links out to its DOI / PubMed record.
- 1Reig M , Forner A , Rimola J , Ferrer‐Fàbrega J , Burrel M , Garcia‐Criado Á , et al. BCLC strategy for prognosis prediction and treatment recommendation: the 2022 update. J Hepatol. 2022;76(3):681–693.34801630 10.1016/j.jhep.2021.11.018PMC 8866082 · doi ↗ · pubmed ↗
- 2Rudnick MR , Leonberg‐Yoo AK , Litt HI , Cohen RM , Hilton S , Reese PP . The controversy of contrast‐induced nephropathy with intravenous contrast: what is the risk? Am J Kidney Dis. 2020;75(1):105–113.31473019 10.1053/j.ajkd.2019.05.022 · doi ↗ · pubmed ↗
- 3Chandiramani R , Cao D , Nicolas J , Mehran R . Contrast‐induced acute kidney injury. Cardiovasc Interv Ther. 2020;35(3):209–217.32253719 10.1007/s 12928-020-00660-8 · doi ↗ · pubmed ↗
- 4Zhang F , Lu Z , Wang F . Advances in the pathogenesis and prevention of contrast‐induced nephropathy. Life Sci. 2020;259:118379.32890604 10.1016/j.lfs.2020.118379 · doi ↗ · pubmed ↗
- 5Kusirisin P , Chattipakorn SC , Chattipakorn N . Contrast‐induced nephropathy and oxidative stress: mechanistic insights for better interventional approaches. J Transl Med. 2020;18(1):400.33081797 10.1186/s 12967-020-02574-8PMC 7576747 · doi ↗ · pubmed ↗
- 6Raffort J , Lareyre F , Katsiki N , Mikhailidis DP . Contrast‐induced nephropathy in non‐cardiac vascular procedures, a narrative review: part 1. Curr Vasc Pharmacol. 2022;20(1):3–15.34238194 10.2174/1570161119666210708165119 · doi ↗ · pubmed ↗
- 7Eslam M , Sanyal AJ , George J , International Consensus Panel . MAFLD: a consensus‐driven proposed nomenclature for metabolic associated fatty liver disease. Gastroenterology. 2020;158(7):1999–2014.32044314 10.1053/j.gastro.2019.11.312 · doi ↗ · pubmed ↗
- 8Eslam M , Newsome PN , Sarin SK , Anstee QM , Targher G , Romero‐Gomez M , et al. A new definition for metabolic dysfunction‐associated fatty liver disease: an international expert consensus statement. J Hepatol. 2020;73(1):202–209.32278004 10.1016/j.jhep.2020.03.039 · doi ↗ · pubmed ↗