Correction to: Retrospective ANalysis of multi-drug resistant Gram-nEgative bacteRia on veno-venous extracorporeal membrane oxygenation. The multicenter RANGER STUDY
Annalisa Boscolo, Andrea Bruni, Marco Giani, Eugenio Garofalo, Nicolò Sella, Tommaso Pettenuzzo, Michela Bombino, Matteo Palcani, Emanuele Rezoagli, Matteo Pozzi, Elena Falcioni, Elisa Pistollato, Eugenio Biamonte, Francesco Murgolo, Graziella D’Arrigo, Mercedes Gori

Abstract
Genes, proteins, chemicals, diseases, species, mutations and cell lines named across the full text — each resolved to its canonical identifier and authoritative record.
Click any figure to enlarge with its caption.
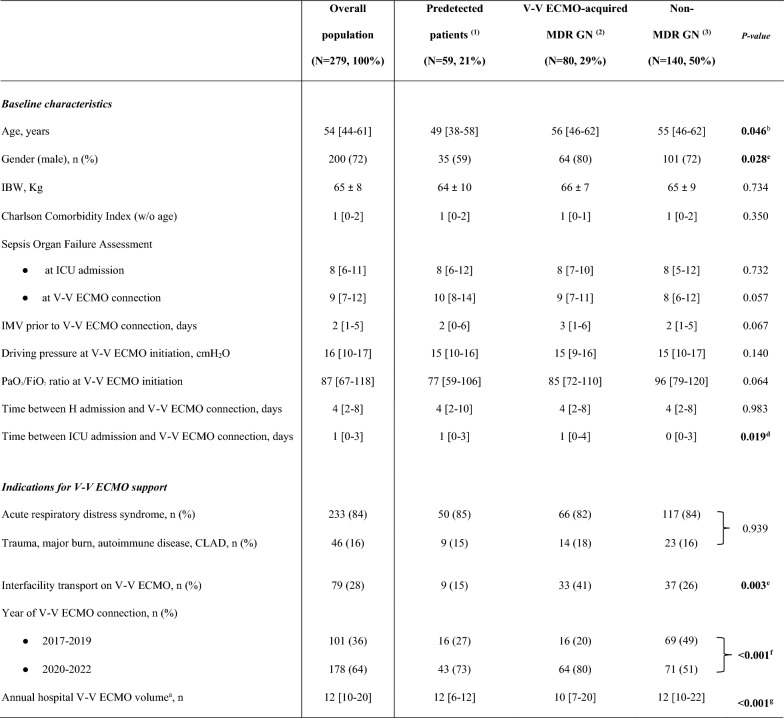 Figure 1
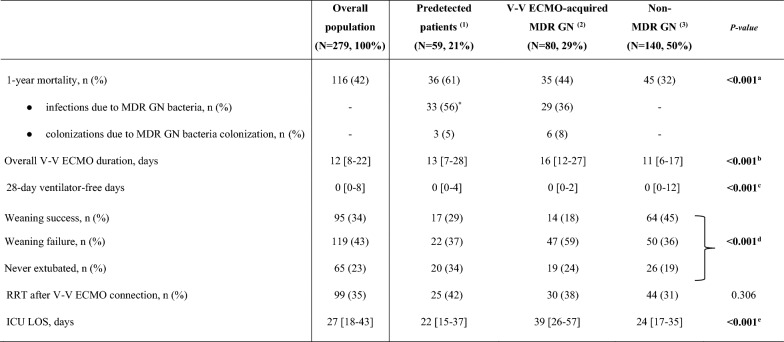 Figure 2
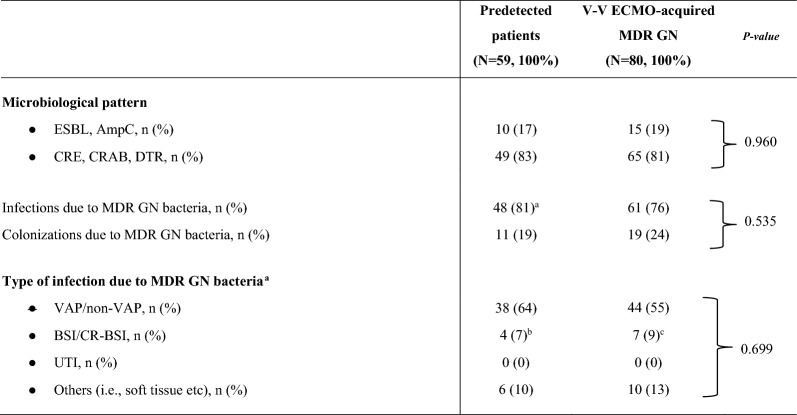 Figure 3
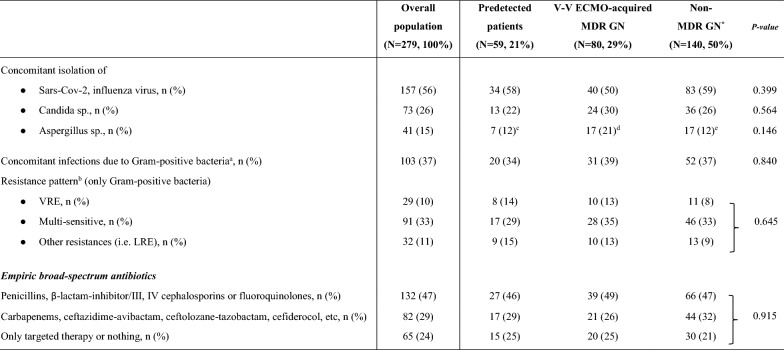 Figure 4
Peer Reviews
No public reviews on file for this paper yet. If you reviewed it on a platform where reviews are public (OpenReview, ICLR, NeurIPS, ICML), you can paste yours below so the community can read it here.
Videos
No videos yet. Explain this paper in a talk, walkthrough, or lecture? Add one.
Taxonomy
TopicsMicrobial Metabolism and Applications · Vibrio bacteria research studies · Antibiotics Pharmacokinetics and Efficacy
**Correction: Critical Care (2024) 28:279 ** 10.1186/s13054-024-05068-x
Following publication of the original article [1], the authors identified an error in Tables 1–4. There were values missing in Table 3 and alignment/indention errors in Tables 1–4. Both the incorrect and correct tables are given hereafter.
The incorrect Table 1:Table 1. Patients’ characteristics at V–V ECMO connectionOverall population (N = 279, 100%)Predetected patients ^(1)^ (N = 59, 21%)V-V ECMO-acquired MDR GN ^(2)^ (N = 80, 29%)Non-MDR GN ^(3)^ (N = 140, 50%)P-value**Baseline characteristicsAge, years54 [44–61]49 [38–58]56 [46–62]55 [46–62]0.046^b^Gender (male), n (%)200 (72)35 (59)64 (80)101 (72)0.028^c^IBW, Kg65 ± 864 ± 1066 ± 765 ± 90.734Charlson Comorbidity Index (w/o age)1 [0–2]1 [0–2]1 [0–1]1 [0–2]0.350Sepsis Organ Failure Assessmentat ICU admission8 [6–11]8 [6–12]8 [7–10]8 [5–12]0.732at V-V ECMO connection9 [7–12]10 [8–14]9 [7–11]8 [6–12]0.057IMV prior to V-V ECMO connection, days2 [1–5]2 [0–6]3 [1–6]2 [1–5]0.067Driving pressure at V-V ECMO initiation, cmH_2_O16 [10–17]15 [10–16]15 [9–16]15 [10–17]0.140PaO_2_/FiO_2_ ratio at V-V ECMO initiation87 [67–118]77 [59–106]85 [72–110]96 [79–120]0.064Time between H admission and V-V ECMO connection, days4 [2–8]4 [2–10]4 [2–8]4 [2–8]0.983Time between ICU admission and V-V ECMO connection, days1 [0–3]1 [0–3]1 [0–4]0 [0–3]0.019^d^Indications for V-V ECMO supportAcute respiratory distress syndrome, n (%)233 (84)50 (85)66 (82) \documentclass[12pt]{minimal} \usepackage{amsmath} \usepackage{wasysym} \usepackage{amsfonts} \usepackage{amssymb} \usepackage{amsbsy} \usepackage{mathrsfs} \usepackage{upgreek} \setlength{\oddsidemargin}{-69pt} \begin{document}$$\left. {\begin{array}{*{20}c} {117 \, \left( {84} \right)} \\ {23 \, \left( {16} \right)} \\ \end{array} } \right\}$$\end{document} 0.939Trauma, major burn, autoimmune disease, CLAD, n (%)46 (16)9 (15)14 (18)Interfacility transport on V-V ECMO, n (%)79 (28)9 (15)33 (41)37 (26)0.003^e^Year of V-V ECMO connection, n (%)2017–2019101 (36)16 (27)16 (20) \documentclass[12pt]{minimal} \usepackage{amsmath} \usepackage{wasysym} \usepackage{amsfonts} \usepackage{amssymb} \usepackage{amsbsy} \usepackage{mathrsfs} \usepackage{upgreek} \setlength{\oddsidemargin}{-69pt} \begin{document}$$\left. {\begin{array}{*{20}c} {69 \, \left( {49} \right)} \\ {71 \, \left( {51} \right)} \\ \end{array} } \right\}$$\end{document} < 0.001^f^2020–2022178 (64)43 (73)64 (80)Annual hospital V-V ECMO volume^a^, n12 [10–20]12 [6–12]10 [7–20]12 [10–22] < 0.001^ g^Data are presented as absolute frequency (% of the included patients) or as median and [interquartile range] or as mean ± SD. 'Predetected' group includes patients, infected or colonized, by MDR GN bacteria cultured before VV-ECMO placement^a^Annual hospital V-V ECMO volume is defined as the specific number of patients treated with V-V ECMO per year [27]^b^(1) vs (2) p-value 0.041, (1) vs (3) p-value 0.017^c^(1) vs (2) p-value 0.013^d^(2) vs (3) p-value 0.011^e^(1) vs (2) p-value 0.001, (2) vs (3) p-value 0.025^f^(1) vs (3) p-value 0.005, (2) vs (3) p-value < 0.001^g^(1) vs (3) and (2) vs (3) p-values < 0.001ICU Intensive Care Unit; IMV Invasive mechanical ventilation; IBW Ideal body weight; ECMO Extracorporeal membrane oxygenation; MDR Multidrug resistant; GN Gram-negative; N or n Number; SD Standard deviation; w/o Without; V-V Veno-venous; CLAD Chronic lung allograft dysfunction; PaO2/FiO2 The ratio of arterial oxygen partial pressure to fractional inspired oxygen< 0.001^f^ referes to both lines (2017-19 and 2020-2022)
The correct Table 1:Table 1. Patients’ characteristics at V-V ECMO connection.The bold font was used for significant* p*-values.Data are presented as absolute frequency (% of the included patients) or as median and [interquartile range] or as mean ± SD. 'Predetected' group includes patients, infected or colonized, by MDR GN bacteria cultured before VV-ECMO placement.^a^Annual hospital V-V ECMO volume is defined as the specific number of patients treated with V-V ECMO per year [27]^b^(1) vs (2)* p*-value 0.041, (1) vs (3) * p*-value 0.017^c^(1) vs (2) * p*-value 0.013^d^(2) vs (3) * p*-value 0.011^e^(1) vs (2) * p*-value 0.001, (2) vs (3) * p*-value 0.025^f^(1) vs (3) * p*-value 0.005, (2) vs (3) * p*-value < 0.001^g^(1) vs (3) and (2) vs (3) * p*-values < 0.001ICU Intensive Care Unit; IMV Invasive mechanical ventilation; IBW Ideal body weight; ECMO Extracorporeal membrane oxygenation; MDR Multidrug resistant; GN Gram-negative; N or n Number; SD Standard deviation; w/o Without; V-V Veno-venous; CLAD Chronic lung allograft dysfunction; PaO2/FiO2 The ratio of arterial oxygen partial pressure to fractional inspired oxygen< 0.001^f^ referes to both lines (2017-19 and 2020-2022)
The incorrect Table 2: Table 2. OutcomesOverall population (N = 279, 100%)Predetected patients ^(1)^ (N = 59, 21%)V-V ECMO-acquired MDR GN ^(2)^ (N = 80, 29%)Non-MDR GN ^(3)^ (N = 140, 50%)P-value1-year mortality, n (%)116 (42)36 (61)35 (44)45 (32) < 0.001^a^infections due to MDR GN bacteria, n (%)–33 (56)^^29 (36)–colonizations due to MDR GN bacteria colonization, n (%)–3 (5)6 (8)–Overall V-V ECMO duration, days12 [8–22]13 [7–28]16 [12–26, 28]11 [6–17] < 0.001^b^28-day ventilator-free days0 [0–8]0 [0–4]0 [0–2]0 [0–12] < 0.001^c^Weaning success, n (%)95 (34)17 (29)14 (18) \documentclass[12pt]{minimal} \usepackage{amsmath} \usepackage{wasysym} \usepackage{amsfonts} \usepackage{amssymb} \usepackage{amsbsy} \usepackage{mathrsfs} \usepackage{upgreek} \setlength{\oddsidemargin}{-69pt} \begin{document}$$\left. {\begin{array}{*{20}c} {64 \, \left( {45} \right)} \\ {50 \, \left( {36} \right)} \\ {26 \, \left( {19} \right)} \\ \end{array} } \right\}$$\end{document} < 0.001^d^Weaning failure, n (%)119 (43)22 (37)47 (59)Never extubated, n (%)65 (23)20 (34)19 (24)RRT after V-V ECMO connection, n (%)99 (35)25 (42)30 (38)44 (31)0.306ICU LOS, days27 [18–43]22 [15–37]39 [26–57]24 [17–35] < 0.001^e^Data are presented as absolute frequency (% of the included patients) or as median and [interquartile range]^^Of those non-survivors, 10 subjects were pre-infected by MDR GN bacteria at V-V ECMO initiation^a^(1) vs (3) p value < 0.001^b^(1) vs (2) p value < 0.001, (1) vs (3) p value 0.043, (2) vs (3) p value < 0.001^c^(1) vs (3) p value 0.005, (2) vs (3) p value < 0.001^d^(1) vs (2) p value 0.042, (1) vs (3) 0.028, (2) vs (3) p value < 0.001^e^(1) vs (2) p value < 0.001, (2) vs (3) p value < 0.001ICU Intensive Care Unit; RRT Renal replacement therapy; IMV Invasive mechanical ventilation; ECMO Extracorporeal membrane oxygenation; MDR Multidrug resistant; GN Gram-negative; N or n Number; V-V Veno-venous< 0.001^a^ referes only to the first line (1-year mortality, n (%)
The correct Table 2:Table 2. Outcomes.The bold font was used for significant* p*-values.Data are presented as absolute frequency (% of the included patients) or as median and [interquartile range]Of those non-survivors, 10 subjects were pre-infected by MDR GN bacteria at V-V ECMO initiation^a^(1) vs (3) p value < 0.001^b^(1) vs (2) p value < 0.001, (1) vs (3) p value 0.043, (2) vs (3) p value < 0.001^c^(1) vs (3) p value 0.005, (2) vs (3) p value < 0.001^d^(1) vs (2) p value 0.042, (1) vs (3) 0.028, (2) vs (3) p value < 0.001^e^(1) vs (2) p value < 0.001, (2) vs (3) p value < 0.001ICU* Intensive Care Unit; RRT Renal replacement therapy; IMV Invasive mechanical ventilation; ECMO Extracorporeal membrane oxygenation; MDR Multidrug resistant; GN Gram-negative; N or n Number; V-V Veno-venous< 0.001^a^ referes only to the first line (1-year mortality, n (%)
The incorrect Table 3:Table 3. Microbiological characteristics of MDR GN bacteriaPredetected patients (N = 59, 100%)V-V ECMO-acquired MDR GN (N = 80, 100%)P value**Microbiological patternESBL, AmpC, n (%)10 (17) \documentclass[12pt]{minimal} \usepackage{amsmath} \usepackage{wasysym} \usepackage{amsfonts} \usepackage{amssymb} \usepackage{amsbsy} \usepackage{mathrsfs} \usepackage{upgreek} \setlength{\oddsidemargin}{-69pt} \begin{document}$$\left. {\begin{array}{*{20}c} {15 \, \left( {19} \right)} \\ {65 \, \left( {81} \right)} \\ \end{array} } \right\}$$\end{document} 0.960CRE, CRAB, DTR, n (%)49 (83)Infections due to MDR GN bacteria, n (%)48 (81)^a^ \documentclass[12pt]{minimal} \usepackage{amsmath} \usepackage{wasysym} \usepackage{amsfonts} \usepackage{amssymb} \usepackage{amsbsy} \usepackage{mathrsfs} \usepackage{upgreek} \setlength{\oddsidemargin}{-69pt} \begin{document}$$\left. {\begin{array}{*{20}c} {61 \, \left( {76} \right)} \\ {19 \, \left( {24} \right)} \\ \end{array} } \right\}$$\end{document} 0.535Colonizations due to MDR GN bacteria, n (%)11 (19)Type of infection due to MDR GN bacteria^a^VAP/non-VAP, n (%)38 (64)0.699BSI/CR-BSI, n (%)4 (7)^b^UTI, n (%)0 (0)Others (i.e., soft tissue etc.), n (%)6 (10)Data are presented as absolute frequency (% of the included patients)^a^Of those patients, only 10 subjects were pre-infected by MDR GN bacteria at V-V ECMO initiation^b^1 CR-BSI; ^c^: 2 CR-BSI. Additional information is reported in Fig. 1***.*** For more details about microbiological surveillance and diagnostic criteria see Methods and additional-Methods 1ECMO extracorporeal membrane oxygenation; MDR Multidrug resistant; GN Gram-negative; N or n Number; ESBL Extended spectrum beta-lactamase; V-V Veno-venous; AmpC AmpC β-lactamase-producing; CRE Carbapenem-resistant Enterobacteriaceae; DTR Difficult-to-treat resistance (mainly Pseudomonas aeruginosa); CRAB Carbapenem-resistant Acinetobacter baumannii; BSI Blood stream infection; VAP Ventilator-associated pneumonia; CR-BSI Catheter-related bloodstream infection; UTI Urinary tract infection0.960 referes to the first (ESBL, AmpC) and second line (CRE, CRAB, DTR)
The correct Table 3:Table 3. Microbiological characteristics of MDR GN bacteria.Data are presented as absolute frequency (% of the included patients)^a^Of those patients, only 10 subjects were pre-infected by MDR GN bacteria at V-V ECMO initiation^b^1 CR-BSI^c^: 2 CR-BSI. Additional information is reported in Fig. 1***.*** For more details about microbiological surveillance and diagnostic criteria see Methods and additional-Methods 1ECMO extracorporeal membrane oxygenation; MDR Multidrug resistant; GN Gram-negative; N or n Number; ESBL Extended spectrum beta-lactamase; V-V Veno-venous; AmpC AmpC β-lactamase-producing; CRE Carbapenem-resistant Enterobacteriaceae; DTR Difficult-to-treat resistance (mainly Pseudomonas aeruginosa); CRAB Carbapenem-resistant Acinetobacter baumannii; BSI Blood stream infection; VAP Ventilator-associated pneumonia; CR-BSI Catheter-related bloodstream infection; UTI Urinary tract infection0.960 referes to the first (ESBL, AmpC) and second line (CRE, CRAB, DTR)
The incorrect Table 4:Table 4. Concomitant pathogens and antibiotics.Overall population (N = 279, 100%)Predetected patients (N = 59, 21%)V-V ECMO-acquired MDR GN (N = 80, 29%)Non-MDR GN^^ (N = 140, 50%)P-value**Concomitant isolation ofSars-Cov-2, influenza virus, n (%)157 (56)34 (58)40 (50)83 (59)0.399Candida sp., n (%)73 (26)13 (22)24 (30)36 (26)0.564Aspergillus sp., n (%)41 (15)7 (12)^c^17 (21)^d^17 (12)^e^0.146Concomitant infections due to Gram-positive bacteria^a^, n (%)103 (37)20 (34)31 (39)52 (37)0.840Resistance pattern*^b^* (only Gram-positive bacteria)VRE, n (%)29 (10)8 (14)10 (13) \documentclass[12pt]{minimal} \usepackage{amsmath} \usepackage{wasysym} \usepackage{amsfonts} \usepackage{amssymb} \usepackage{amsbsy} \usepackage{mathrsfs} \usepackage{upgreek} \setlength{\oddsidemargin}{-69pt} \begin{document}$$\left. {\begin{array}{*{20}c} {11 \, \left( 8 \right)} \\ {46 \, \left( {33} \right)} \\ {13 \, \left( 9 \right)} \\ \end{array} } \right\}$$\end{document} 0.645Multi-sensitive, n (%)91 (33)17 (29)28 (35)Other resistances (i.e. LRE), n (%)32 (11)9 (15)10 (13)Empiric broad-spectrum antibioticsPenicillins, β-lactam-inhibitor/III, IV cephalosporins or fluoroquinolones, n (%)132 (47)27 (46)39 (49) \documentclass[12pt]{minimal} \usepackage{amsmath} \usepackage{wasysym} \usepackage{amsfonts} \usepackage{amssymb} \usepackage{amsbsy} \usepackage{mathrsfs} \usepackage{upgreek} \setlength{\oddsidemargin}{-69pt} \begin{document}$$\left. {\begin{array}{*{20}c} {66 \, \left( {47} \right)} \\ {44 \, \left( {32} \right)} \\ {30 \, \left( {21} \right)} \\ \end{array} } \right\}$$\end{document} 0.915Carbapenems, ceftazidime-avibactam, ceftolozane-tazobactam, cefiderocol, etc., n (%)82 (29)17 (29)21 (26)Only targeted therapy or nothing, n (%)65 (24)15 (25)20 (25)Data are presented as absolute frequency (% of the included patients) or as median and [interquartile range]. For more details about microbiological surveillance see Methods and additional-Methods 1^^Moreover, 39 (28%) subjects detected multisensitive GN bacteria and only 23 (16%) patients never recorded positive cultures^a^for more details concerning Gram-positive bacteria see additional-Table 6^b^in case of multiple bacterial isolations, only the worst resistance pattern was counted^c^1 out of 7 patients isolated Candida sp. and Aspergillus sp. simultaneously^d^3 out of 17 patients isolated Candida sp. and Aspergillus sp. simultaneously^e^1 out of 7 patients isolated Candida sp. and Aspergillus sp. simultaneouslyECMO Extracorporeal membrane oxygenation; MDR Multidrug resistant; GN Gram-negative; N or n Number; VRE Vanco-resistant enterococcus; LRE Linezolid-resistant enterococcus; V-V Veno-venous; sp Species
The correct Table 4:Table 4. Concomitant pathogens and antibiotics.Data are presented as absolute frequency (% of the included patients) or as median and [interquartile range]. For more details about microbiological surveillance see Methods and additional-Methods 1.*Moreover, 39 (28%) subjects detected multisensitive GN bacteria and only 23 (16%) patients never recorded positive cultures.^a^for more details concerning Gram-positive bacteria see additional-Table 6.^b^in case of multiple bacterial isolations, only the worst resistance pattern was counted.^c^1 out of 7 patients isolated Candida sp. and Aspergillus sp. simultaneously.^d^3 out of 17 patients isolated Candida sp. and Aspergillus sp. simultaneously.^e^1 out of 7 patients isolated Candida sp. and Aspergillus sp. simultaneously.ECMO Extracorporeal membrane oxygenation; MDR Multidrug resistant; GN Gram-negative; N or n Number; VRE Vanco-resistant enterococcus; LRE Linezolid-resistant enterococcus; V-V Veno-venous; sp Species.
Tables 1, 2, 3 and 4 have been updated in this correction article and the original article [1] has been corrected.