Associations between left atrial indices and cardiorespiratory and muscular fitness among physically active military personnel
Yen-Chen Lin, Pang-Yen Liu, Kun-Zhe Tsai, Wei-Chun Huang, Wen-Chung Yu, Xuemei Sui, Carl J. Lavie, Gen-Min Lin

TL;DR
This study explores how left atrial measurements relate to physical fitness in military personnel, finding specific correlations with running, push-up, and sit-up performance.
Contribution
The study introduces novel composite left atrial indices that correlate with different types of exercise performance in physically active individuals.
Findings
The LAVI-to-LASI_v ratio was the best overall correlate for running, push-up, and sit-up performance.
The LAVI-to-mitral E/e′ ratio was the strongest unique correlate for 3-km running performance.
Top runners had lower stiffness and higher LAVI-to-index ratios compared to controls.
Abstract
Left atrial (LA) size and function are linked to exercise intolerance in heart failure, while associations between LA parameters and exercise performance remain unclear in athletes. This study aimed to identify correlations between echocardiographic LA size, pressure, stiffness, and composite indices, and various exercise performance indicators. Echocardiographic parameters were obtained from 181 physically active military personnel receiving regular training and tests for a 3-km run and 2 min of push-ups and sit-ups. The top 16% of runners were compared sex-specifically, with the remaining 84% as controls to identify LA discriminators for running capacity. LA composite indices were defined as the LA volume index (LAVI) divided by the stiffness index (LASI) or pressure index (mitral E/e′). Spearman correlations were used to identify LA correlates with exercise performance. Generalized…
Genes, proteins, chemicals, diseases, species, mutations and cell lines named across the full text — each resolved to its canonical identifier and authoritative record.
Click any figure to enlarge with its caption.
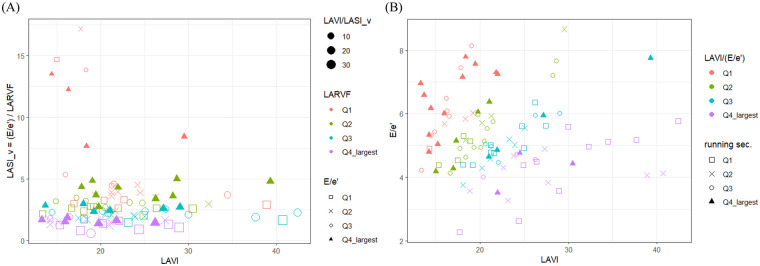 Figure 1
| Top runners ( | Controls ( | ||
|---|---|---|---|
| Clinical characteristics | |||
| Age (years) | 24 (19.5–29) | 26 (22–32) | 0.036 |
| Males [ | 26 (87) | 133 (88) | |
| Height (cm) | 171 ± 7.19 | 171 ± 7.22 | 0.904 |
| Weight (kg) | 68.4 (63.8–74.4) | 71.2 (65.0–80.4) | 0.156 |
| Body mass index (kg/cm2) | 23.2 (21.5–26.2) | 24.8 (22.6–26.6) | 0.083 |
| Body surface area (cm2) | 1.81 (1.72–1.87) | 1.83 (1.74–1.96) | 0.345 |
| Waist circumference (cm) | 78.2 ± 7.48 | 82.9 ± 9.17 | 0.004 |
| Waist-to-height ratio | 0.458 ± 0.039 | 0.486 ± 0.048 | 0.001 |
| Pulse rate (beats/min) | 69 (64–72) | 75 (67.5–82) | 0.006 |
| Systolic blood pressure (mm Hg) | 119 ± 9.28 | 120 ± 11.8 | 0.478 |
| Diastolic blood pressure (mm Hg) | 71.9 ± 7.01 | 72.6 ± 10.0 | 0.617 |
| Current tobacco smoking [ | 9 (30) | 67 (44) | |
| Exercise performance | |||
| Estimated sVO2max (L/min) | 38.0 (36.8–38.4) | 32.2 (28.7–34.0) | <0.001 |
| 3-km running time (s) | 755 (745–785) | 905 (860–995) | <0.001 |
| 2-min push-ups ( | 50.5 (45–60) | 42 (40–50) | <0.001 |
| 2-min sit-ups ( | 48 (45–50) | 42 (40–45) | <0.001 |
| Top runners ( | Controls ( | ||
|---|---|---|---|
| M-mode and two-dimensional echocardiography | |||
| IVS (mm) | 9 (8–9) | 9 (8–10) | 0.252 |
| IVS, BSA-indexed (mm/m2) | 4.9 ± 0.546 | 4.94 ± 0.485 | 0.773 |
| LVPW (mm) | 9 (8–9) | 9 (8–9) | 0.722 |
| LVPW, BSA-indexed (mm/m2) | 4.76 ± 0.461 | 4.88 ± 0.445 | 0.184 |
| LVEDD (mm) | 50.5 (47.2–53) | 49 (46–51) | 0.064 |
| LVEDDI (mm/m2) | 27.6 ± 2.22 | 26.5 ± 2.29 | 0.019 |
| LV mass, BSA-indexed (g/m2) | 85.4 ± 15.0 | 81.6 ± 15.1 | 0.206 |
| LV ejection fraction (%) | 64.5 (61–68) | 64 (61–66.5) | 0.767 |
| LAD (mm) | 33 (30.2–35) | 33 (31–35) | 0.498 |
| LADI (mm/m2) | 18.0 (16.9–19.1) | 17.8 (16.9–19.1) | 0.904 |
| SoV (mm) | 28.5 (27–30.8) | 29 (27–31) | 0.378 |
| SoV, BSA-indexed (mm/m2) | 15.9 ± 1.52 | 15.9 ± 1.43 | 0.943 |
| AVO (mm) | 20 (18.2–21) | 20 (18.5–21) | 0.431 |
| AVO, BSA-indexed (mm/m2) | 11.1 ± 0.834 | 10.8 ± 0.995 | 0.096 |
| RVD, PLAX (mm) | 24.8 ± 4.33 | 25.3 ± 4.02 | 0.913 |
| RVD, BSA-indexed, PLAX (mm/m2) | 13.7 ± 2.26 | 13.8 ± 2.09 | 0.870 |
| Pulsed wave and tissue Doppler echocardiography | |||
| Mitral E velocity (cm/s) | 94.5 ± 12.3 | 88.1 ± 16.7 | 0.018 |
| Mitral A velocity (cm/s) | 50.6 (45.3–59.5) | 51.6 (45.7–59.2) | 0.631 |
| Mitral E/A ratio | 1.77 (1.70–2.02) | 1.7 (1.41–2.00) | 0.094 |
| Mitral annulus e′ velocity (cm/s) | 19.0 (17.1–21.4) | 17.2 (14.2–19.3) | <0.001 |
| Mitral E/e′ ratio | 4.9 (4.38–5.28) | 5.17 (4.57–5.98) | 0.064 |
| Mitral annulus a′ velocity (cm/s) | 8.78 (7.38–10.1) | 9.26 (8.06–10.7) | 0.201 |
| Speckle tracking echocardiography | |||
| LAVI (ml/m2) | 19.9 (17.9–25.6) | 20.2 (16.6–23.8) | 0.528 |
| LAEVI (ml/m2) | 13.0 (9.4–17.2) | 12.1 (7.1–15.3) | 0.181 |
| LAEF (%) | 71.8 (60.3–75.0) | 63.4 (51.0–72.3) | 0.050 |
| PALS (%) | 35 (31.3–40.9) | 34.4 (28.8–42.7) | 0.598 |
| LARVF (%) | 2.55 (1.52–2.98) | 1.72 (1.04–2.6) | 0.055 |
| LASI_v (ml−1) | 0.196 (0.139–0.316) | 0.245 (0.185–0.444) | 0.013 |
| LASI_m (%−1) | 0.13 (0.116–0.147) | 0.151 (0.126–0.183) | 0.021 |
| LAVI-to-LASI_m ratio | 164 (135–214) | 127 (100–170) | 0.024 |
| LAVI-to-LASI_v ratio | 12.3 (10.4–18.7) | 8.08 (5.26–10.7) | 0.001 |
| LAVI-to-(mitral E/e′) ratio | 4.37 (3.58–6.10) | 3.76 (2.95–4.82) | 0.038 |
| Performance correlate | Correlation coefficient, rho (95% CI) | Confounding correlates ( |
| |
|---|---|---|---|---|
| Running time (s) | ||||
| LAVI/(E/e′) | −0.457 (−0.606 to −0.277) | <0.001 | Not found | 96 |
| WHtR | 0.445 (0.306 to 0.565) | <0.001 | Not found | 159 |
| e′ velocity | −0.433 (−0.555 to −0.294) | <0.001 | Not found | 159 |
| LAVI/LASI_v | −0.403 (−0.562 to −0.214) | 0.001 | LAVI/(E/e′) (0.053) | 96 |
| LAVI/LASI_m | −0.401 (−0.561 to −0.212) | 0.002 | LAVI/(E/e′) (0.544) | 96 |
| Waist | 0.391 (0.247 to 0.519) | <0.001 | WHtR (0.344) | 159 |
| BMI | 0.354 (0.205 to 0.487) | <0.001 | Waist (0.558); WHtR (0.513) | 159 |
| LVEDDI | −0.328 ( −0.464 to −0.177) | <0.001 | Not found | 159 |
| E/A | −0.299 (−0.438 to −0.145) | 0.004 | e′ velocity (0.548) | 159 |
| PR | 0.291 (0.137 to 0.431) | 0.005 | LAVI/(E/e′) (0.132); LAVI (0.051) | 159 |
| E/e′ | 0.273 (0.118 to 0.415) | 0.013 | e′ velocity (0.997); LAVI/(E/e′) (0.695); WHtR (0.200) | 159 |
| AVOI | −0.244 (−0.389 to −0.087) | 0.048 | LVEDDI (0.247); WHtR (0.222); LAVI/(E/e′) (0.061) | 159 |
| Push-up count | ||||
| LAVI/LASI_v | 0.335 (0.138 to 0.506) | 0.029 | Not found | 96 |
| LVEDDI | 0.334 (0.184 to 0.469) | <0.001 | Not found | 159 |
| LASI_m | −0.296 (−0.453 to −0.121) | 0.029 | LAVI/LASI_v (0.804) | 124 |
| e′ velocity | 0.265 (0.110 to 0.408) | 0.025 | Not found | 159 |
| Waist | −0.256 (−0.400 to −0.100) | 0.036 | LVEDDI (0.200); e′ velocity (0.054); LAVI/LASI_v (0.051) | 159 |
| Sit-up count | ||||
| LAVI/LASI_v | 0.352 (0.157 to 0.520) | 0.016 | Not found | 96 |
| LASI_m | −0.303 (−0.459 to −0.128) | 0.022 | LAVI/LASI_v (0.773) | 124 |
| e′ velocity | 0.284 (0.130 to 0.425) | 0.010 | Not found | 159 |
| Performance correlate | Correlation coefficient, | Confounding correlates ( |
| |
|---|---|---|---|---|
| Running time (s) | ||||
| WHtR | 0.168 (0.013 to 0.316) | <0.001 | Not found | 159 |
| LAVI/(E/e′) | 0.146 (−0.056 to 0.337) | <0.001 | Not found | 96 |
| e′ velocity | 0.145 (−0.011 to 0.294) | <0.001 | Not found | 159 |
| LAVI/LASI_v | 0.126 (−0.076 to 0.318) | <0.001 | Not found | 96 |
| Waist | 0.116 (−0.040 to 0.267) | <0.001 | WHtR (1) | 159 |
| BMI | 0.115 (−0.041 to 0.266) | <0.001 | WHtR (0.459) | 159 |
| LAVI/LASI_m | 0.103 (−0.099 to 0.298) | <0.001 | LAVI/(E/e′) (0.134) | 96 |
| LVEDDI | 0.077 (−0.080 to 0.230) | <0.001 | Not found | 159 |
| E/A | 0.072 (−0.084 to 0.225) | <0.001 | Not found | 159 |
| LAVI | 0.062 (−0.140 to 0.259) | <0.001 | LAVI/(E/e′) (0.852); LAVI/LASI_m (0.120) | 96 |
| E/e′ | 0.061 (−0.096 to 0.215) | <0.001 | e′ velocity (0.117) | 159 |
| PR | 0.058 (−0.099 to 0.211) | <0.001 | LAVI/(E/e′) (0.080); LAVI (0.062); LAVI/LASI_v (0.059); LAVI/LASI_m (0.053) | 159 |
| A velocity | 0.049 (−0.107 to 0.203) | <0.001 | Not found | 159 |
| Age | 0.043 (−0.114 to 0.197) | <0.001 | LAVI/LASI_v (0.310); LAVI/LASI_m (0.250); LAVI/(E/e′) (0.209); LAVI (0.180); e′ velocity (0.173) | 159 |
| Weight | 0.041 (−0.115 to 0.196) | <0.001 | WhtR (1); Waist (1); BMI (1) | 159 |
| AVOI | 0.036 (−0.120 to 0.191) | <0.001 | WHtR (0.051) | 159 |
| E velocity | 0.035 (−0.121 to 0.190) | <0.001 | LAVI (0.198); LAVI/LASI_v (0.187); LAVI/LASI_m (0.167); LAVI/(E/e′) (0.154); E/A (0.100) | 159 |
| LASI_m | 0.035 (−0.143 to 0.210) | 0.025 | LAVI/LASI_v (0.982); LAVI/LASI_m (0.852); e′ (0.251); LAVI/(E/e′) (0.148) | 124 |
| DBP | 0.033 (−0.123 to 0.188) | 0.002 | LAVI/(E/e′) (0.516); LAVI/LASI_v (0.482); LAVI (0.463); LAVI/LASI_m (0.460) | 159 |
| Push-up count | ||||
| LVEDDI | 0.088 (−0.069 to 0.240) | <0.001 | Not found | 159 |
| LAVI/LASI_m | 0.068 (−0.135 to 0.264) | <0.001 | Not found | 96 |
| LAVI/LASI_v | 0.066 (−0.136 to 0.263) | <0.001 | Not found | 96 |
| Waist | 0.066 (−0.091 to 0.219) | <0.001 | Not found | 159 |
| WHtR | 0.061 (−0.096 to 0.214) | <0.001 | Waist (0.109) | 159 |
| LASI_m | 0.056 (−0.121 to 0.230) | <0.001 | LAVI/LASI_m (0.140); LAVI/LASI_v (0.133) | 124 |
| LAVI/(E/e′) | 0.052 (−0.150 to 0.250) | 0.006 | LAVI/LASI_m (0.166) | 96 |
| e′ velocity | 0.052 (−0.105 to 0.206) | <0.001 | Not found | 159 |
| AVOI | 0.045 (−0.111 to 0.200) | <0.001 | Not found | 159 |
| BSA | 0.043 (−0.113 to 0.197) | <0.001 | Waist (0.137) | 159 |
| Weight | 0.039 (−0.117 to 0.194) | <0.001 | Waist (0.871); BSA (0.401); WHtR (0.065) | 159 |
| E/A | 0.039 (−0.118 to 0.193) | <0.001 | Not found | 159 |
| E/e′ | 0.034 (−0.122 to 0.189) | 0.002 | e′ velocity (0.051) | 159 |
| Age | 0.032 (−0.124 to 0.186) | 0.005 | Not found | 159 |
| PR | 0.026 (−0.130 to 0.181) | 0.040 | LAVI/(E/e′) (0.472); LAVI (0.433); LAVI/LASI_v (0.425); LAVI/LASI_m (0.417) | 159 |
| Sit-up count | ||||
| LAVI/LASI_v | 0.100 (−0.102 to 0.295) | <0.001 | Not found | 96 |
| e′ velocity | 0.061 (−0.096 to 0.215) | <0.001 | Not found | 159 |
| LASI_m | 0.061 (−0.117 to 0.234) | <0.001 | LAVI/LASI_v (0.429) | 124 |
| LAVI/LASI_m | 0.059 (−0.143 to 0.256) | 0.001 | LAVI/LASI_v (0.319) | 96 |
| Age | 0.052 (−0.104 to 0.206) | <0.001 | LAVI/LASI_v (0.068) | 159 |
| WHtR | 0.047 (−0.109 to 0.201) | <0.001 | LAVI/LASI_v (0.074) | 159 |
| Waist | 0.043 (−0.113 to 0.197) | <0.001 | LAVI/LASI_v (0.137) | 159 |
| LVEDDI | 0.037 (−0.119 to 0.191) | <0.001 | LAVI/LASI_v (0.094) | 159 |
| PR | 0.034 (−0.122 to 0.189) | 0.002 | LAVI/LASI_v (0.085) | 159 |
| Size | Emptying | Pressure | Reservoir | Stiffness | Composite | ||||||||
|---|---|---|---|---|---|---|---|---|---|---|---|---|---|
| LAD | LADI | LAVI | LAEVI | LAEF | E/e′ | PALS | LARVF | LASI_m | LASI_v | LAVI/LASI_m | LAVI/LASI_v | LAVI/(E/e′) | |
| Running time in seconds | indir | uncor | indir | indir | indir | Direct | Direct | ||||||
| crude_men | 0.150 | 0.824 | <0.001 | 0.035 | 0.505 | <0.001 | 0.593 | 0.413 | 0.040 | 0.680 | <0.001 | <0.001 | <0.001 |
| model_sex | 0.124 | 0.755 | <0.001 | 0.034 | 0.461 | <0.001 | 0.469 | 0.354 | 0.040 | 0.987 | <0.001 | <0.001 | <0.001 |
| model_epi | 0.188 | 0.635 | <0.001 | 0.011 | 0.481 | 0.071 | 0.888 | 0.193 | 0.022 | 0.795 | 0.001 | <0.001 | <0.001 |
| model_dCor | 0.139 | 0.612 | 0.014 | 0.053 | 0.130 | 0.840 | 0.947 | 0.075 | 0.497 | 0.626 | 0.103 | 0.005 | 0.013 |
| Push-up count | indir | indir | Direct | Direct | indir | ||||||||
| crude_men | 0.350 | 0.148 | 0.062 | 0.119 | 0.481 | 0.006 | 0.474 | 0.534 | 0.013 | 0.314 | 0.017 | 0.042 | 0.010 |
| model_sex | 0.359 | 0.142 | 0.062 | 0.123 | 0.527 | 0.011 | 0.332 | 0.460 | 0.009 | 0.573 | 0.013 | 0.041 | 0.012 |
| model_epi | 0.504 | 0.074 | 0.068 | 0.115 | 0.658 | 0.176 | 0.079 | 0.427 | 0.017 | 0.594 | 0.002 | 0.070 | 0.071 |
| model_dCor | 0.524 | 0.784 | 0.431 | 0.256 | 0.265 | 0.354 | 0.076 | 0.227 | 0.038 | 0.338 | 0.196 | 0.235 | 0.462 |
| Sit-ups count | Uncor | Uncor | Uncor | indir | indir | Direct | Uncor | ||||||
| crude_men | 0.320 | 0.997 | 0.256 | 0.043 | 0.129 | 0.016 | 0.319 | 0.040 | 0.005 | 0.351 | 0.003 | <0.001 | 0.003 |
| model_sex | 0.282 | 0.971 | 0.306 | 0.050 | 0.133 | 0.024 | 0.265 | 0.030 | 0.013 | 0.538 | 0.004 | <0.001 | 0.005 |
| model_epi | 0.788 | 0.789 | 0.383 | 0.067 | 0.248 | 0.138 | 0.166 | 0.046 | 0.032 | 0.557 | 0.006 | 0.001 | 0.017 |
| model_dCor | 0.727 | 0.514 | 0.788 | 0.163 | 0.068 | 0.400 | 0.257 | 0.017 | 0.572 | 0.349 | 0.432 | 0.038 | 0.878 |
- —Medical Affairs Bureau Ministry of National Defense
- —Hualien Armed Forces General Hospital
Peer Reviews
No public reviews on file for this paper yet. If you reviewed it on a platform where reviews are public (OpenReview, ICLR, NeurIPS, ICML), you can paste yours below so the community can read it here.
Videos
No videos yet. Explain this paper in a talk, walkthrough, or lecture? Add one.
Taxonomy
TopicsCardiovascular and exercise physiology · Cardiovascular Effects of Exercise · Cardiovascular Function and Risk Factors
Introduction
While sonographic left atrial (LA) parameters are useful in assessing left ventricular (LV) diastolic function and predicting exercise intolerance in heart failure (1), differential sonographic LA indices with unclear implications in athletes vs. untrained controls have been observed. Body surface area (BSA)-indexed maximum LA volume (LAVI) expansion could be a consequence of LV dysfunction, however, LAVI has been shown to positively correlate with cardiorespiratory fitness in a healthy population (2). Athletes are associated with a larger LAVI (3, 4), and a prospective study showed that exercise training increases LAVI (5). Furthermore, lower peak atrial longitudinal strain (PALS) is associated with a higher risk of all-cause death and heart failure hospitalization (6), but both higher and lower PALS have been repeatedly reported in athletes (3). Although a post-training PALS decline is described in female athletes (6), a lower PALS but larger LA reservoir volume, another LA reservoir function parameter defined as the difference between LA maximum and minimum volumes (LAVmax and LAVmin, respectively), is observed in competitive athletes (7). Finally, a higher LA stiffness index (LASI), usually defined as the mitral E-to-e′ ratio divided by PALS is a heart failure risk and symptom predictor (8–10), and a lower LASI has been observed in athletes (7). Nevertheless, a prospective study showed unaltered LASI after 16 weeks of intensive training in female athletes (6).
While we outlined differential sonographic LA indices in athletes vs. untrained controls above, there are questions for clarification. First, whether differential LA features such as a larger LAVI or lower LASI in athletes directly correlate with exercise performance is uncertain because training volume and intensity could be confounders of both LA adaptation and exercise performance. Second, whether a specific LA characteristic has differential significance for performance in different exercises has not been clearly shown. While we consider the ability of the LA to efficiently uphold adequate LV preload in tachycardia-related short diastolic phases to be important for endurance exercise that requires prolonged cardiac output enhancement, one might think good LA compliance to accommodate repeated reposition-related right ventricular output changes may be crucial in sit-ups. Third, whether a composite LA index incorporating LA parameters from a physiological viewpoint outperforms isolated LA features in correlating with exercise performance is unknown. While a small LAVI limits stroke volume enhancement during exercise, high mean LA pressure is associated with exertional dyspnea. Because LA volume and pressure are interconnected for an individual person, we suspect a physiologically meaningful composite LA index incorporating volume and pressure information, the volume-to-pressure ratio, for example, can better demonstrate LA fitness.
To clarify the above questions, we enrolled physically active military personnel undergoing uniform sleep and food schedules and standardized endurance and strength training in this study. We controlled physical training and investigated the relationship between the performance in different exercises, including 3-km field runs and 2-min sit-up and push-up tests, and composite and separate sonographic parameters evaluating LA size, pressure, stiffness, and emptying and reservoir functions.
Methods
Study population
Physically active military personnel with uniform physical training programs, sleep and food schedules, and daily food types were included. They underwent regular tests for 3-km field running and 2 min of push-ups and sit-ups (11–13). Despite regular and uniform training, they were not all at the level of competitive athletes. The sex-specific top 16% of runners (one standard deviation) were compared with the remaining 84% of their colleagues, who were considered the controls for clinical, laboratory, and echocardiographic parameters. Estimated maximal oxygen consumption scaled to the body mass (sVO2max) was estimated based on time for the 3-km running test (11, 14, 15).
Echocardiography
M-mode and two-dimensional transthoracic echocardiography were performed using a Philips iE33 machine equipped with a 1–5 MHz probe by the same well-trained experienced technician. Speckle tracking echocardiography was performed with aCMQ (automated Cardiac Motion Quantification, Philips) software for PALS in the apical four-chamber view. LAVmax and LAVmin were measured at end-systole and at mitral valve closure in the apical four-chamber view (16). Tissue Doppler echocardiography was performed to obtain the lateral mitral annulus e′ velocity. LV mass (LVM) was calculated using end-diastolic linear echocardiographic parameters with the Devereux and Reichek Cube formula. BSA was calculated using the Du Bois formula. BSA-indexed cardiac chamber dimensions and LVM were calculated for data analysis.
Isolated and composite sonographic LA parameters
(1)Size: LA size indices included LAVI, LA anteroposterior diameter (LAD), and BSA-indexed LAD (LADI).(2)Pressure: LA pressure was represented by the mitral E-to-e′ ratio, which is proportionate to LA pressure, given there were no significant mitral valve/annulus diseases, significant aortic valve regurgitation, or left bundle branch block in our population (17).(3)Emptying function: LA total emptying function was evaluated by the LA emptying volume (LAEV) indexed to BSA (LAEVI) and LA emptying fraction (LAEF). LAEV was the difference between LAVmax and LAVmin. LAEF was defined as the LAEV-to-LAVmax ratio.(4)Reservoir function: LA reservoir function was evaluated by one-dimensional PALS and volume-based LA reservoir volume fraction (LARVF). LARVF was defined as the LAEV-to-LAVmin ratio.(5)Stiffness: LASI based on myocardial deformation (LASI_m) was defined as the mitral E/e′-to-PALS ratio (7). LASI based on volume changes (LASI_v) was defined as the mitral E/e′-to-LARVF ratio. LASIes denotes LASI_m and LASI_v together.(6)Composite indices: the LAVI-to-E/e′ ratio represented the LA volume-to-pressure index. The LAVI-to-LASIes ratios were LA volume-to-stiffness indices.
Statistical analysis
Analyses were performed using R language in RStudio. The normal distribution of the continuous variables was double-checked using the Shapiro–Wilk and Anderson–Darling normality tests. For a specific continuous variable, data were presented as mean ± standard deviation if a normal distribution was confirmed in both groups and as median and interquartile range [q1, q3] otherwise. Categorical variables were presented as numbers and percentages. Comparisons between two independent groups were made with Welch's t-test if normally distributed and the Mann–Whitney U-test otherwise. Spearman correlation was used to determine the direction and strength of the monotonic relationship between two independent variables. Distance correlation was used to determine the strength of the association, which was not necessarily linear, between two independent variables. Variables with a significant correlation with exercise performance were further checked with partial correlation to identify independent variables. The partial Spearman correlation was conducted using the ppcor package and partial distance correlation with the energy package (18, 19). Robust generalized linear regression for non-Gaussian distributed continuous variables was constructed using robustbase::glmrob (gamma family). Generalized linear regression (quasi-Poisson family) was conducted to count data such as the number of push-ups and sit-ups. Collinear predictor variables for regression were detected and avoided to keep the Variance Inflation Factor <10, in general, using the usdm package. Statistical significance was defined as a p-value <0.05.
Results
A total of 181, including 159 male and 22 female, physically active military personnel were enrolled. LAVmax and LAVmin were randomly acquired in 96 participants, and PALS was randomly obtained in 124 participants. The sex-specific top 16% of participants, according to their 3-km running performance, were compared with the remaining 84% of their colleagues as controls. The physical and clinical characteristics of the top runners and controls are shown in Table 1. The top runners were younger and had lower waist circumference, waist-to-height ratio (WHtR), and resting pulse rate. The top runners had a higher estimated sVO2max and better performance in push-ups and sit-ups. The echocardiographic variables of both groups are listed in Table 2. The top runners had larger BSA-indexed LV end-diastolic diameter (LVEDDI), LAVI/(E/e′) and LAVI/LASIes, higher mitral E and e′ velocities, and lower LASIes.
Spearman non-parametric monotonic correlation was applied to find performance correlates, and the results are listed in Table 3. Because sex is a confounder for exercise performance and some clinical and echocardiographic parameters, and most of the participants were men, we did correlation tests for men-only data and included sex in the regression analyses later. Partial Spearman correlation was used to identify independent correlates, among which e′ velocity was a positive performance correlate for each exercise. LVEDDI positively correlated with running and push-ups, whereas LAVI/LASI_v positively correlated with push-up and sit-up ability. LAVI/(E/e′) was a positive, while WHtR was a negative running performance correlate.
We next performed distance correlation to detect the correlation strength of any relationship between exercise performance and the characteristics of the male participants, and the results are listed in Table 4. The distance correlation discovered more performance correlates, including all of those in the monotonic correlation. The list of running capacity correlates was the longest, and the strength and rank of the correlates with the different exercises were substantially dissimilar. Partial distance correlation was applied to find independent correlates. LAVI/LASI_v and mitral e′ were directly correlated with performance in all the exercises. WHtR was the most highly correlated anthropometric measurement with running and sit-up performance, while waist circumference was slightly more connected to push-up capacity. LAVI/(E/e′) was a top-ranked and independent running performance correlate. LVEDDI was directly connected to running and push-up performance and correlated with sit-up capacity through LAVI/LASI_v. Mitral E/A was independently correlated with running and push-up performance. LAVI was indirectly linked to running performance via LAVI/LASI_v. Pulse rate was correlated with sit-up capacity through LAVI/LASI_v and with running and push-up capacity through LAVI and all the composite LA indices.
After finding LA features that were differentially correlated with performance in different exercises, we performed regression analyses to clarify the relationship between performance in each exercise and sonographic LA indices, including those evaluating its size (LAD, LADI and LAVI), pressure (E/e′), reservoir ability (PALS and LARVF), total emptying function (LAEVI and LAEF), stiffness (LASIes), and physiologically meaningful composite indices [LAVI/(E/e′), LAVI/LASIes]. Table 5 shows the *p-*values of LA parameters in predicting performance in each exercise based on generalized linear regression, and the dependency information from the partial distance correlation is labeled. The regression coefficients and standard errors, on the link scale, for the significant LA parameters are presented in Supplementary Table S1. Two simple and two complex models were used for the regression analyses. In the simple models, the significance of performance-predicting LA indices in the men-only model held true in the sex-adjusted model. Of note is that the p-value of LASI_m decreased substantially after including women. For the complex models, model_epi controlled clinical data, including age, sex, WHtR, and SBP, while model_dCor adjusted performance correlates, including e′ velocity, LVEDDI, WHtR, and sex. For LA size, LAVI was directly linked to running capacity, while LAD and LADI were not performance predictors. For LA emptying functions, LAEVI no longer predicted running performance in model_dCor, whereas LAEF was not a predictor at all. For LA reservoir functions, LARVF was associated with sit-up capacity, probably through LAVI/LASI_v, and PALS alone did not predict performance. For the LA pressure surrogate, the ability of mitral E/e′ to predict exercise performance in the simple models disappeared after adjusting for e′ velocity (data not shown). For the LA stiffness indices, LASI_v alone was not predictive, while LASI_m lost its connection to running and sit-up performance in model_dCor. Furthermore, the significance of LASI_m in the complex models disappeared without women. For the LA composite indices, LAVI/LASI_v always predicted running and sit-up performance, while LAVI/LASI_m was not a predictor in model_dCor. Figure 1A shows while LAVI and LASI_v interactively shaped LAVI/LASI_v, LARVF surpassed mitral E/e′ in deciding LASI_v in our study population. Finally, LAVI/(E/e′) predicted running performance in all models. Figure 1B depicts the negative correlation between LAVI/(E/e′) and seconds taken to complete a 3-km field run.
Scatter plots visually depicting (A) how variations in LAVI, LARVF, and mitral E/e′ impact the composite LAVI-LASI_v ratio, and (B) the relationship between LAVI/(E/e’) and seconds taken to complete a 3-km field run. Q, quartile.
Discussion
We identified clinical and echocardiographic indices that correlated with performance in a 3-km field run and 2 min of push-ups and sit-ups in the same group of physically active military personnel receiving uniform exercise training, sleep and food schedules, and diet. By comparing the performance in different exercises in the same population, we controlled for interpersonal diversity to identify sonographic indices that were differential and significant for running, push-up, and sit-up capacity. In addition, body training might have confounding effects on both exercise performance and sonographic parameters, and sleep and food schedules and diet interfere with exercise capacity (20, 21). After controlling for the above-mentioned confounding factors, we showed that LAVI/LASI_v was the most prominent common LA correlate with running, sit-up, and probably push-up performance, while LAVI/(E/e′) was the strongest, most direct, and relatively specific LA correlate with running capacity. We concluded that, compared to separate LA variables, composite LA indices properly incorporating LA volume with pressure or stiffness information are more highly correlated with overall exercise performance.
LAVI but not LAD nor LADI is correlated with endurance
By controlling physical training in military personnel, we showed that LAVI was positively correlated with and predictive of running performance. An increased LAVI is among the presentations of an athlete's heart (22). In a prospective study of top-level female athletes, LAVI increased without filling pressure changes after a 16-week intensive training program (6). Another study showed that 10 months of high-intensity exercise led to comparable rises in LAVmax, LV end-diastolic volume, and VO2max (5). A larger LAVI represents higher LA potential for efficiently boosting total emptying volume in tachycardia-related short diastolic phases to support cardiac output enhancement during endurance exercise. In contrast to LAVI, LAD and LADI did not reflect LA volume and failed to predict field running performance.
LAVI outperforms LAEVI in predicting running performance for hemodynamic reasons
Resting total LA emptying parameters were not as predictive of running performance as LAVI. LAEF represented LA emptying volume scaled to the LA but not body size and was unconnected to exercise capacity. LAEVI lost its power to predict sit-up performance in our complex models and, to our surprise, running performance in model_dCor. A real-time magnetic resonance imaging-based study shows that during supine bicycle exercise, LAEVI enhancement results from reduced LAVmin with unchanged LAVI in both athletes and non-athletes. Exercise induces comparable LAEF increase and BSA-indexed LAVmin decrease in athletes and non-athletes, and a larger LAVI was the main determinant of a larger exercise LAEVI (23). Similarly, our finding implied that resting LAVI vs. LAEVI is more representative of exercise LAEVI. Hence, the LAVI was used to represent the stroke volume reserve scaled to the body size in our composite LA indices.
Proper combination of LA hemodynamic parameters helps in performance prediction
LA reservoir indices and their derived LA stiffness variables behaved quite differently with regard to their correlation with and prediction of exercise performance. PALS and LARVF did not represent absolute LA reservoir volume; however, PALS was performance-unrelated, whereas LARVF predicted sit-up capacity. The reason behind this phenomenon was unclear, but there was a link between sit-ups and LARVF. Sit-ups involve reposition-related cyclic volumetric changes in venous return and, thus right ventricular output to the LA, while LARVF represents LA capacity for global volume expansion. Interestingly, PALS-based LASI_m was significantly correlated with performance in all the exercises except in model_dCor, while to our surprise, LARVF-based LASI_v was not predictive of exercise performance. These findings might be explained by the fact that PALS and mitral E and e′ wave velocities, unlike LARVF, are all one-dimensional measurements in the longitudinal direction in the four-chamber view, and therefore only LASI_m truly represented LA stiffness. These observations suggest that properly combining isolated LA hemodynamic parameters helped in predicting exercise performance.
LAVI-based composite hemodynamic indices are better performance correlators
Unsurprisingly, compared to individual LA parameters, we showed that physiologically meaningful composite LA variables combining LA volume with pressure or stiffness information were more highly correlated with exercise performance. While a larger LAVI signified a better ability to increase exercise LV preload without providing information on associated costs, larger LAVI/(E/e′) and LAVI/LASI_m ratios represented a higher LA-contributed reserve at a unit expense of LA pressure and stiffness, respectively. The reason behind the dramatically improved performance correlation from LASI_v to LAVI/LASI_v not determined, but perhaps because the latter could be re-formulated as {[(LAVmax/LAVmin) * (LAVmax − LAVmin)]/BSA}/(E/e′). While the {numerator} described detailed LA expansive abilities scaled to the body size, the denominator again provided the accompanied expense of LA pressure. The reasons why LAVI/(E/e′) and LAVI/LASIes were differentially correlated with the performance of different exercises were uncertain, and the need for endurance and cardiac cycle-unrelated variations of LA preload and afterload might play a role. The ability of the LA to boost exercise LAEVI without significant LA and pulmonary venous pressure rises is crucial for 3-km field running, which requires endurance and does not involve significant cardiac cycle-unrelated variations in LV preload and afterload. In contrast, the ability of the LA to accommodate reposition-related variations in venous return and peripheral resistance might play a role in sit-up and push-up performance, respectively.
LAVI-based hemodynamic indices connect resting heart rate with exercise performance
LAVI-based LA hemodynamic indices provide more comprehensive information to assess LA fit, and we showed that resting heart rate, lower in the top runners, was negatively correlated with exercise performance through these composite parameters. Resting heart rate is usually reported to be lower in athletes vs. controls and in athletes with vs. those without a dilated LA (24–26). A larger LAVI potentially ensures larger stroke volume and a lower heart rate is enough to maintain adequate resting cardiac output. Nevertheless, in a trial of supine bicycle exercise, athletes had a trend of lower resting but higher exercise heart rates (23). With a larger LAVI and normal or supernormal exercise heart rate response, athletes increase cardiac outputs to support musculoskeletal systems and have extraordinary exercise performance.
Major common non-LA performance correlators
Exercise performance is undoubtedly influenced by multiple non-LA factors. Our distance correlation analyses indicated that mitral e′ velocity, LVEDDI, and WHtR were dominant and shared non-LA parameters correlating with all exercise performance. Mitral e′ velocity is roughly inversely proportionate to the LV relaxation time constant, and is determined by LV relaxation, restoring forces, and filling pressure in the general population (1, 17). LV diastolic function, crucial for athletes, positively correlated with exercise performance in this study. An appropriately larger LVEDDI, according to the Frank–Starling law, represents the capacity of the LV to enhance stroke volume while lessening forceful contraction, which is highly energy-consuming. WHtR is a surrogate measurement of body fat percentage, which in contrast to muscles, increases weight burden without improving exercise ability. People with a high WHtR also have higher cardiometabolic and mortality risks (27). Compared to BMI and body weight, WHtR was negatively correlated with all exercise performance in our study. Therefore, we included mitral e′ velocity to represent LV diastolic function, LVEDDI to represent stroke volume reserve, and WHtR to represent fat burden and cardiometabolic risk in our generalized linear regression analyses.
Potential application of composite LA hemodynamic indices in practice
While we proved that properly incorporating interconnected LA indices from an exercise type-specific physiologic viewpoint benefited fitness assessments, one might try to improve exercise capacities or adjust training programs based on this knowledge. For example, because endurance training is most known to be associated with a larger LAVI, which enhances stroke volume, strength athletes might improve performance by including suitable endurance activities in their daily training. Furthermore, because pathological conditions and probably also inappropriately violent training increase the risk of stretch-associated atrial fibrosis, which increases LA stiffness, periodical assessments of LA health with LAVI/LASIes might contribute to athlete-focused echocardiographic evaluations and help to tailor training programs individually (28).
Study limitations
First, we did not evaluate LA conduit and active pumping functions, nor did we separate PALS into LA conduit and contraction strains. Total LA conduit volume is the difference between LV stroke volume and total LA reservoir volume; however, we were unable to obtain LV stroke volume for its calculation. Second, we used the apical four-chamber but not the two-chamber view to evaluate PALS and LA volumes. Third, we combined men and women to compare sex-specific top runners with controls. For example, LASI_m was not a significant push-up performance predictor in model_epi and model_dCor if women were excluded. However, removing female data did not change the predictive significance of the other LA parameter-exercise performance combinations. Fourth, we could only evaluate resting echocardiographic parameters, which might substantially change during exercise. Fifth, exercise performance is determined not only by cardiac functions and structures but also by musculoskeletal robustness, mental health, and exercise skills. Cardiac fitness might not be the leading factor affecting exercise capacity. Sixth, all echocardiographic parameters were obtained by a well-trained and experienced echocardiographer, but we could not analyze measurement variability because most of the parameters were clearly measured only once in sinus rhythm, and there was no suitable internal control. Finally, physically active military personnel were enrolled to control for confounding and interfering factors, as mentioned above, and the finding might not be extrapolated to a real-world general population.
Conclusions
Specific LA characteristics play roles of different importance with regard to correlating with and predicting the performance in different exercises. A larger LAVI, which efficiently boosts LV preload in tachycardia-related short diastolic phases to support prolonged stroke volume enhancement during endurance exercise, is not a performance-irrelevant consequence of physical training and is uniquely and positively associated with running performance. Physiologically meaningful composite LA indices combining LAVI with information on LA pressure and stiffness improve the strength and significance of the correlation with and prediction of performance in not only field running but also sit-ups and probably push-ups. Applying composite LA indices from an exercise type-specific physiological viewpoint to routine practice might benefit practical fitness assessments or interventions in military or athletic populations.
Prospectives
Competency in medical knowledge
LA volume and functional indices could be used in conjunction with clinical characteristics and sonographic LV parameters to evaluate potential exercise capacity in physically fit people.
Translational outlook
It is sometimes difficult to differentiate physiological adaptation-related larger LA volume from pathological LA dilation. LAVI-to-LASI and LAVI-to-(mitral E/e′) ratios comprising LA volume with concurrent information on LA stiffness and pressure, respectively, could better describe LA fitness. These functional indices have the potential to be extrapolated across the population spectrum from a physiological viewpoint. While we have proved composite LAVI functional indices are useful in physically fit people, whether these indices play roles in exercise tolerance or clinical outcomes in patients with LV diastolic dysfunction, heart failure, or cardiovascular diseases requires additional research.
The reference list from the paper itself. Each links out to its DOI / PubMed record.
- 1Nagueh SF Smiseth OA Appleton CP Byrd BF Dokainish H Edvardsen T Recommendations for the evaluation of left ventricular diastolic function by echocardiography: an update from the American society of echocardiography and the European association of cardiovascular imaging. J Am Soc Echocardiogr. (2016) 29(4):277–314. 10.1016/j.echo.2016.01.01127037982 · doi ↗ · pubmed ↗
- 2Letnes JM Nes B Vaardal-Lunde K Slette MBMølmen-Hansen HE Aspenes ST Left atrial volume, cardiorespiratory fitness, and diastolic function in healthy individuals: the HUNT study, Norway. J Am Heart Assoc. (2020) 9(3):e 014682. 10.1161/JAHA.119.01468231986991 PMC 7033857 · doi ↗ · pubmed ↗
- 3Cuspidi C Tadic M Sala C Gherbesi E Grassi G Mancia G. Left atrial function in elite athletes: a meta-analysis of two-dimensional speckle tracking echocardiographic studies. Clin Cardiol. (2019) 42(5):579–87. 10.1002/clc.2318030907013 PMC 6523010 · doi ↗ · pubmed ↗
- 4Iskandar A Mujtaba MT Thompson PD. Left atrium size in elite athletes. JACC Cardiovasc Imaging. (2015) 8(7):753–62. 10.1016/j.jcmg.2014.12.03226093921 · doi ↗ · pubmed ↗
- 5Opondo MA Aiad N Cain MA Sarma S Howden E Stoller DA Does high-intensity endurance training increase the risk of atrial fibrillation? Circ Arrhythm Electrophysiol. (2018) 11(5):e 005598. 10.1161/CIRCEP.117.00559829748195 PMC 5951393 · doi ↗ · pubmed ↗
- 6D’Ascenzi F Pelliccia A Natali BM ZacàV Cameli M Alvino F Morphological and functional adaptation of left and right atria induced by training in highly trained female athletes. Circ Cardiovasc Imaging. (2014) 7(2):222–9. 10.1161/CIRCIMAGING.113.00134524470314 · doi ↗ · pubmed ↗
- 7D’Ascenzi F Pelliccia A Natali BM Cameli M Andrei V Incampo E Increased left atrial size is associated with reduced atrial stiffness and preserved reservoir function in athlete’s heart. Int J Cardiovasc Imaging. (2015) 31(4):699–705. 10.1007/s 10554-015-0600-725627780 · doi ↗ · pubmed ↗
- 8Kim D Seo JH Choi KH Lee SH Choi JO Jeon ES Prognostic implications of left atrial stiffness Index in heart failure patients with preserved ejection fraction. Cardiovasc Imaging. (2023) 16(4):435–45. 10.1016/j.jcmg.2022.11.00236752431 · doi ↗ · pubmed ↗