The C. elegans gba-3 gene encodes a glucocerebrosidase that exacerbates α-synuclein-mediated impairments in deletion mutants
Ning Liu, Rongzhen Li, Xiaobing Huang, Merja Lakso, Garry Wong

Abstract
Genes, proteins, chemicals, diseases, species, mutations and cell lines named across the full text — each resolved to its canonical identifier and authoritative record.
Click any figure to enlarge with its caption.
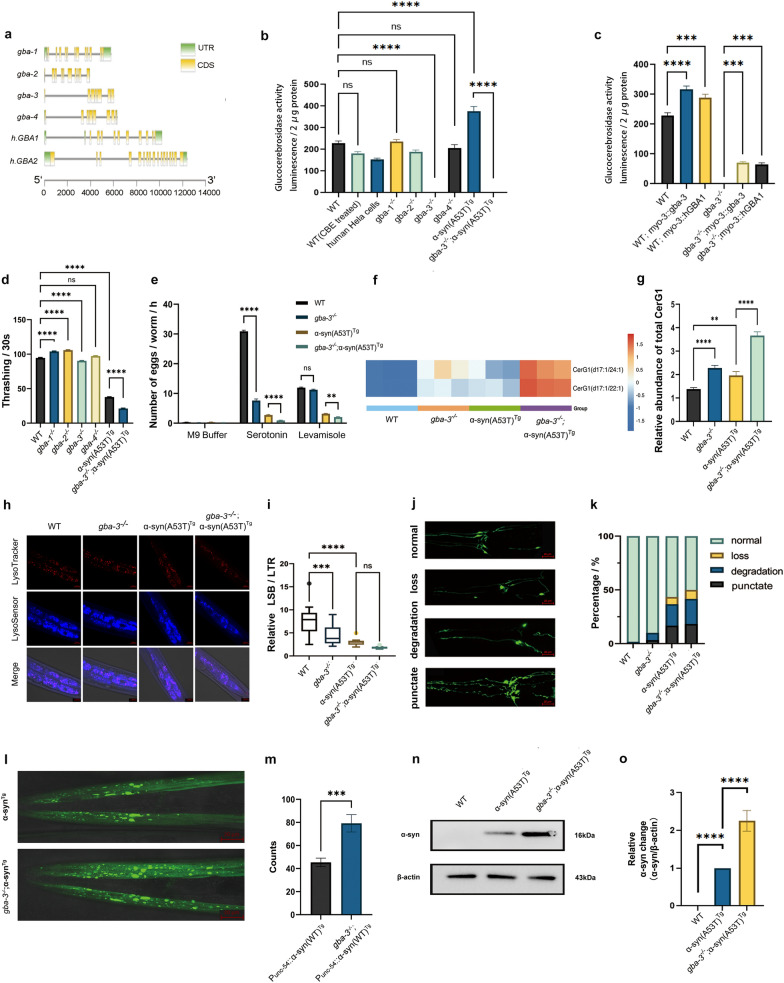 Figure 1
- —http://dx.doi.org/10.13039/501100001809National Natural Science Foundation of China
Peer Reviews
No public reviews on file for this paper yet. If you reviewed it on a platform where reviews are public (OpenReview, ICLR, NeurIPS, ICML), you can paste yours below so the community can read it here.
Videos
No videos yet. Explain this paper in a talk, walkthrough, or lecture? Add one.
Taxonomy
TopicsLysosomal Storage Disorders Research · Parkinson's Disease Mechanisms and Treatments · Genetics, Aging, and Longevity in Model Organisms
Glucocerebrosidases (GCases) catalyze the hydrolysis of β-glucoceremides and β-glucosphingosines to produce glucose and ceramide or sphingosine, respectively. In humans, GCase is encoded by GBA1 which is widely and abundantly expressed and localized in lysosomal membranes, while GBA2 encodes a microsomal-β-glucosidase [1]. Loss-of-function mutations in GBA1 result in accumulation of glucoceramides or glucosphingosines and underlie Gaucher’s disease (GD), a lysosomal storage disease characterized by anemia, enlarged spleen and liver, and skeletal disorders [2, 3]. The most common GBA1 N370S mutant retains some residual activity while homozygosity results in a range of outcomes from mild symptoms to severe disease [4]. Specific GBA1 mutations are the highest known genetic risk factors (odds ratio > 5) for Parkinson’s disease (PD) [5]. Nonetheless, knowledge of how GCase functional loss can increase PD risk is limited due to the lack of animal models [6]. In this study, we identified the gene encoding GCase in C. elegans via genetic and enzymatic activity analysis and transgenic overexpression. Interactions between GCase function and α-synuclein (α-syn) were investigated to gain further insight into how GBA1 variations account for the largest risk factors for PD. Methods, strains, and primers are provided in Additional File 1: Table S1 and Table S2.
Gene nomenclature assignments predicted 4 GCase genes, gba-1 to gba-4, with high identity to the human hGBA1. The genomic structures are shown (Fig. 1a). To verify that C. elegans has GCase activity, we assayed wild-type (WT) animals using the fluorogenic substrate 4-methylumbelliferyl-beta-D-glucopyranoside (MUB-Glc). WT animals had GCase activity comparable to HeLa cell extracts (0.69 ± 0.02 of WT) and the activity could be partially inhibited by the GBA1 inhibitor conduritol B epoxide (0.75 ± 0.03 of WT) (Fig. 1b). To determine which of the 4 gba genes encodes a GCase, we obtained deletion mutants and assayed their enzymatic activity. Only gba-3-deletion mutants showed a loss of activity (− 0.09 ± 0.01 of WT), while the other mutants retained activity similar to WT, strongly suggesting that gba-3 encodes a GCase (Fig. 1b). Next, the gba-3-deletion animals were microinjected with either the gba-3 or hGBA1 cDNA constructs, and they showed recovery of GCase activity (0.31 ± 0.03 and 0.26 ± 0.03 of WT, respectively). Moreover, microinjection of the same constructs to WT animals increased GCase activity (1.39 ± 0.11 and 1.27 ± 0.06 of WT, respectively) (Fig. 1c). These results firmly demonstrate that gba-3 is a C. elegans GCase-encoding gene.Fig. 1. Phenotypic analysis of WT, gba-3^−/−^, α-syn(A53T)^Tg^, and gba-3^−/−^;α-syn(A53T)^Tg^ crosses. a Gene structures of C. elegans gba family members and human GBA1 and GBA2 genes. b, c Glucocerebrosidase enzymatic activity in relative fluorescence units (RFU). CBE, Conduritol-β-epoxide. d, e Locomotion (mean ± SEM, n = 30) and egg laying assays (mean ± SEM, n = 72). f, g Heatmap and quantitation of glucosyl ceramides. h, i Confocal images and quantitation of Lysosensor Blue (LSB)-to-Lysotracker Red (LTR) staining ratio (n = 30). j, k Dopaminergic neuron morphology and quantitation. At least 30 animals were used for each strain. l, m Confocal imaging and quantitation of α-syn aggregates in unc-54p::α-syn(WT)::YFP (NL5901) and unc-54p::α-syn(WT)::YFP (NL5901);gba-3^−/−^ crosses (n = 30). n, o Western blot and quantitation of α-syn protein levels in WT and transgenic animals (n = 3). ****P < 0.0001, ***P < 0.001, **P < 0.01, *P < 0.05; ns, no significance using one-way ANOVA with Sidak’s multiple comparisons post-hoc test. For data that were not normally distributed, Kruskal-Wallace was used. Two-tailed t-test was used for metabolite comparisons
To investigate the interactions between gba-3 and α-syn, the main pathogenic protein in PD, we crossed gba-3 deletion mutants to a previously established C. elegans PD model that pan-neuronally overexpresses human α-syn(A53T) [7]. This PD model had higher GCase activity than WT (1.64 ± 0.04), but crossing with the gba-3 deletion mutants led to loss of enzymatic activity (Fig. 1b). To characterize the effects of GCase activity loss on PD phenotypes, we assayed movement. Compared to WT (94.6 ± 0.6), as well as gba-1- (104.0 ± 0.6), gba-2- (105.8 ± 0.6), gba-3- (90.3 ± 0.5) and gba-4-deletion (97.3 ± 0.4) mutants, the α-syn(A53T)^Tg^ animals had decreased thrashing behavior (37.8 ± 0.4), and gba-3 deletion further decreased the thrashing behavior of the PD model (21.1 ± 0.7) (Fig. 1d). We also observed significantly weaker egg laying in response to serotonin stimulation in gba-3 deletion mutants (7.63 ± 0.5) compared to WT (30.9 ± 0.4). The response was further weakened in the PD model (α-syn(A53T)^Tg^, 2.75 ± 0.2; gba-3^−/−^;α-syn(A53T)^Tg^, 0.90 ± 0.1) (Fig. 1e). This phenotypic deficit was not observed with the cholinergic agonist levamisole where gba-3 mutants responded similar to WT and gba-3 deletion did not significantly alter the weak response of the PD model (Fig. 1e). Thus, at least 2 different assays showed exacerbation of phenotypic deficits by gba-3 mutants on the PD model.
Next, we wanted to determine if GCase activity loss could lead to accumulation of unreacted substrate, as previous studies suggested involvement of lipid pathway dysregulation in mediating PD pathology [8]. Using a targeted metabolomics approach, we observed increases in glucosylceramides CerG1(d17:1/24:1) and CerG1(d17:1/22:1), which are putative substrates for GCase (Fig. 1f). We also observed accumulation of the same CerG1 substrates in the human α-syn(A53T)-overexpressing animals, and gba-3 deletion further exerted an additive effect (WT, 1.383 ± 0.03631; gba-3^−/−^, 2.282 ± 0.06307; α-syn(A53T)^Tg^, 1.966 ± 0.09361; gba-3^−/−^;α-syn(A53T)^Tg^, 3.664 ± 0.09231) (Fig. 1g). These results suggest that the disturbed fatty acid homeostasis in PD may be further exacerbated by gba-3 deletion.
Lysosomes are implicated in the disease progression of both GD and PD [9]. We explored the status of the lysosomes using lysotracker dyes and observed decreased functional capacity (LysoSensor blue/LysoTracker red) in gba-3^−/−^ mutants and α-syn(A53T)-overexpressing animals (Fig. 1h). However, the lysosomal impairment in α-syn(A53T)^Tg^ animals was not significantly changed by gba-3 deletion (Fig. 1i). The low level of lysosomal function in the PD model may have prevented a more severe impairment.
We next investigated the morphology of dopaminergic neurons (Fig. 1j). The percentages of normal morphology in WT, gba-3^−/−^, α-syn(A53T)^Tg^, and gba-3^−/−^;α-syn(A53T)^Tg^ were 98.3% ± 0.017%, 91.7% ± 0.030%, 56.7% ± 0.033%, and 50% ± 0.029%, respectively (Fig. 1k). Confocal microscopy indicated that the gba-3^−/−^ animals had slightly more abnormalities than WT, and gba-3 deletion added only slightly to the percentage of impairment in α-syn(A53T)^Tg^ (Fig. 1k). This suggests that gba-3 function may only slightly contribute to dopaminergic neuron degeneration.
Finally, we wanted to determine the α-syn protein level to test if gba-3 deletion could contribute to increased risk of PD in this manner. Using a transgenic line that overexpresses α-syn fused to YFP in muscle cells [10], we observed increased α-syn aggregation in gba-3-deletion mutant animals (control 45.3 ± 3.7 vs. gba-3 ^−/−^ 79.2 ± 7.5) (Fig. 1l, m). Western blots showed that the total protein level of α-syn increased significantly in gba-3-deletion mutants (fold change 2.109 ± 0.227) (Fig. 1n, o**;** uncropped images available in Additional File 2). These results indicate that loss of GCase function could further increase α-syn protein levels in vivo. This increase suggests a sequence of events that ultimately lead to neurodegeneration.
In this study, by establishing gba-3 as a C. elegans GCase-encoding gene, we could genetically cross loss-of- function mutants to an α-syn(A53T)-overexpressing line and explore their interactions. We observed exacerbation of movement deficits and serotonergic signaling. However, we did not observe any worsening of lysosomal function, although it was already at a low level, but did observe increased accumulation of CerG1 substrates that were already higher in the PD transgenic animal model. A significant finding is that loss of GCase activity led to increased α-syn protein levels. As α-syn is a key protein in Lewy bodies and central to PD pathology, this may lead to an increased risk. Importantly, we observed only modest changes to dopaminergic neuron degeneration in loss-of-function mutants, suggesting that the effects of GCase activity loss may occur early, perhaps before neurodegeneration. Thus, translational approaches to enhancing GCase activity should be used at an early stage to exert beneficial effects. We do not know if gba-3 loss-of-function mutation may affect memory or other neurodegenerative processes, therefore, future studies are required to address this in a rigorous manner. Finally, our investigation provides two new animal models for studying GD or PD, respectively, which may further aid in the understanding of these neurodegenerative disorders.
Supplementary Information
Additional file 1. Methods. Table S1. Strains used in this study. Table S2. Primers used in this study.Additional file 2. Uncropped images of Western blots.