Dust Storms and Emergency Department Visits in 3 Southwestern States Using NWS Storm Reports
Xiaping Zheng, Howard H. Chang, Stefanie T. Ebelt, Rohan D’Souza, Kirk Hohsfield, James L. Crooks

TL;DR
This study finds that dust storms in the US Southwest are linked to increased emergency department visits for asthma, pneumonia, heart failure, and motor vehicle accidents.
Contribution
The study provides new evidence on the health impacts of dust storms, particularly their association with specific emergency department visits in a warming climate.
Findings
Dust storms were positively associated with emergency department visits for asthma, culture-negative pneumonia, and motor vehicle accidents.
Dust storms showed a protective association with ischemic heart disease emergency department visits.
The strongest associations were observed for asthma and culture-negative pneumonia within 2-7 days of dust storm exposure.
Abstract
This cross-sectional study investigates the association of dust storm exposure, as reported by the National Weather Service (NWS), with emergency department visits by diagnosis in Arizona, California, and Utah. Are dust storms associated with the rate of cardiopulmonary and motor vehicle accident emergency department visits in the US Southwest? In this cross-sectional study of 33 500 emergency department visits, dust storms were positively associated with visits for asthma, culture-negative pneumonia, and motor vehicle accidents but negatively associated with ischemic heart disease. These findings suggest that dust storms may be a significant contributor to increased health care utilization under a warming climate. Dust storms are projected to increase with climate change. The short-term health outcomes associated with dust storms in the US are not well characterized, especially for…
Genes, proteins, chemicals, diseases, species, mutations and cell lines named across the full text — each resolved to its canonical identifier and authoritative record.
Click any figure to enlarge with its caption.
 Figure
| Characteristic | ED visits, No. (%) | |||||||
|---|---|---|---|---|---|---|---|---|
| Asthma (n = 6734) | COPD (n = 3768) | CNP (n = 6303) | CHF (n = 2762) | CVD (n = 2917) | IHD (n = 4263) | MVA (n = 6753) | Total (N = 33 500) | |
| Age, y | ||||||||
| 0-17 | 2920 (43.4) | 1 (<0.1) | 1661 (26.4) | 3 (0.1) | 20 (0.7) | 1 (<0.1) | 1111 (16.5) | 5717 (17.1) |
| 18-29 | 1051 (15.6) | 19 (0.5) | 382 (6.1) | 15 (0.5) | 30 (1) | 17 (0.4) | 2135 (31.6) | 3649 (10.9) |
| 30-44 | 1137 (16.9) | 108 (2.9) | 714 (11.3) | 156 (5.6) | 163 (5.6) | 205 (4.8) | 1605 (23.8) | 4088 (12.2) |
| 45-64 | 1100 (16.3) | 1515 (40.2) | 1326 (21) | 803 (29.1) | 856 (29.3) | 1756 (41.2) | 1364 (20.2) | 8720 (26.0) |
| ≥65 | 494 (7.3) | 2125 (56.4) | 2098 (33.3) | 1780 (64.4) | 1846 (63.3) | 2284 (53.6) | 523 (7.7) | 11 150 (33.3) |
| Unknown | 32 (0.5) | 0 | 122 (1.9) | 5 (0.2) | 2 (0.1) | 0 | 15 (0.2) | 176 (0.5) |
| Sex | ||||||||
| Female | 3447 (51.2) | 2071 (55.0) | 3013 (47.8) | 1136 (41.1) | 1369 (46.9) | 1567 (36.8) | 3501 (51.8) | 16 104 (48.1) |
| Male | 3287 (48.8) | 1697 (45.0) | 3290 (52.2) | 1626 (58.9) | 1547 (53.0) | 2695 (63.2) | 3252 (48.2) | 17 394 (51.9) |
| Unknown | 0 | 0 | 0 | 0 | 1 (<0.1) | 1 (<0.1) | 0 | 2 (<0.1) |
| Race | ||||||||
| Black | 1059 (15.7) | 220 (5.8) | 369 (5.9) | 220 (8.0) | 169 (5.8) | 197 (4.6) | 595 (8.8) | 2829 (8.4) |
| White | 3696 (54.9) | 3166 (84.0) | 4299 (68.2) | 2032 (73.6) | 2172 (74.5) | 3315 (77.8) | 3857 (57.1) | 22 537 (67.3) |
| Other | 1894 (28.1) | 349 (9.3) | 1551 (24.6) | 479 (17.3) | 542 (18.6) | 701 (16.4) | 2150 (31.8) | 7666 (22.9) |
| Unknown | 85 (1.3) | 33 (0.9) | 84 (1.3) | 31 (1.1) | 34 (1.2) | 50 (1.2) | 151 (2.2) | 468 (1.4) |
| Ethnicity | ||||||||
| Hispanic | 2491 (37.0) | 380 (10.1) | 1986 (31.5) | 617 (22.3) | 595 (20.4) | 797 (18.7) | 2390 (35.4) | 9256 (27.6) |
| Non-Hispanic | 4154 (61.7) | 3342 (88.7) | 4235 (67.2) | 2118 (76.7) | 2294 (78.6) | 3419 (80.2) | 4199 (62.2) | 23 761 (70.9) |
| Unknown | 89 (1.3) | 46 (1.2) | 82 (1.3) | 27 (1.0) | 28 (1.0) | 47 (1.1) | 164 (2.4) | 483 (1.4) |
| Outcome | Arizona | California | Utah | |||
|---|---|---|---|---|---|---|
| All ED visits, No. | Outpatient visits, No. (%) | All ED visits, No. | Outpatient visits, No. (%) | All ED visits, No. | Outpatient visits, No. (%) | |
| Asthma | 3243 | 2768 (85.4) | 3478 | 3100 (89.1) | 13 | 9 (69.2) |
| COPD | 2065 | 1274 (61.7) | 1700 | 979 (57.6) | 3 | 2 (66.7) |
| CNP | 3122 | 1868 (59.8) | 3166 | 2050 (64.8) | 15 | 7 (46.7) |
| CHF | 1349 | 467 (34.6) | 1407 | 452 (32.1) | 6 | 2 (33.3) |
| CVD | 1765 | 604 (34.2) | 1147 | 292 (25.5) | 5 | 1 (20) |
| IHD | 2536 | 901 (35.5) | 1716 | 435 (25.3) | 11 | 4 (36.4) |
| MVA | 3621 | 3203 (88.5) | 3076 | 2824 (91.8) | 56 | 49 (87.5) |
| Measure | State | Overall | ||
|---|---|---|---|---|
| Arizona (July 1, 2010, to 2018) | California (2005-2018) | Utah (2005-2016) | ||
| Zip codes, No. | 128 | 70 | 8 | 206 |
| No. of dust days per year, mean (SD) | 16.33 (3.95) | 5.07 (2.24) | 0.17 (0.41) | 14.28 (3.70) |
| Temperature, mean (IQR), °C | 30.49 (28.17 to 33.02) | 18.56 (12.94 to 24.36) | 22.16 (21.64 to 23.24) | 25.25 (22.80 to 30.35) |
| Dew point, mean (IQR), °C | 9.98 (7.69 to 13.40) | 1.10 (−3.28 to 4.93) | −0.21 (−1.36 to 1.05) | 6.12 (2.55 to 10.11) |
| O3, mean (IQR), ppb | 52.76 (48.88 to 57.09) | 49.29 (42.48 to 55.92) | 57.87 (54.95 to 59.98) | 52.00 (47.9 to 57.01) |
| NO2, mean (IQR), ppb | 10.10 (8.22 to 12.1) | 13.82 (10.67 to 16.72) | 12.74 (11.64 to 13.96) | 12.74 (11.64 to 13.96) |
| PM2.5, mean (IQR), μg/m3 | 4.29 (3.31 to 5.23) | 5.61 (3.68 to 7.02) | 6.06 (5.33 to 6.80) | 4.70 (3.46 to 5.68) |
Peer Reviews
No public reviews on file for this paper yet. If you reviewed it on a platform where reviews are public (OpenReview, ICLR, NeurIPS, ICML), you can paste yours below so the community can read it here.
Videos
No videos yet. Explain this paper in a talk, walkthrough, or lecture? Add one.
Taxonomy
TopicsClimate Change and Health Impacts · Air Quality and Health Impacts · Radioactivity and Radon Measurements
Introduction
Dust storms, which are meteorological phenomena characterized by strong winds that lift soil and particulates into the air, pose substantial environmental and health risks, particularly in arid and semiarid regions. These events are influenced by weather and climatic variability and by human activities, such as land use changes and agricultural practices.^1,2^ Evidence that dust storms have increased in frequency and intensity in the recent past varies by region.^1,3,4,5^ Evidence that dust storms will increase in the future due to global climate change also varies by region^6,7,8,9^ given that increasing temperatures and prolonged periods of drought enhance the conditions favorable to dust storm formation in some areas.
The US Southwest, comprising Arizona, California, Nevada, New Mexico, and Utah, frequently experiences dust storms. These intense storms increase levels of airborne fine particulate matter pollution (PM_2.5_ and PM_10_, particulate matter with aerometric diameters <2.5 μm and <10 μm, respectively). PM_2.5_ and PM_10_ are known to penetrate the lungs, with the smallest particles able to enter the bloodstream, leading to a range of adverse health problems.^10,11^
Understanding health outcomes associated with these dust storms is crucial for developing effective public health interventions and enhancing emergency preparedness and response strategies. Published work from East Asia,^12,13,14,15,16,17,18,19,20,21,22,23,24,25,26,27,28,29,30,31,32^ southern Europe,^33,34,35,36,37,38,39,40,41,42,43,44^ the Middle East,^45,46,47,48,49^ and Australia^50,51,52,53^ has found associations between dust storms (or airborne dust and sand events more broadly) and increases in risk of mortality,^3,21,22,25,26,33,34,36,37,38,42,44,47,54,55^ hospitalization, intensive care unit (ICU) admissions,^40,48,56,57^ and emergency department (ED) visits^19,52,58^ for respiratory, cardiovascular, and other causes, as well as reduced lung function and infectious diseases. Prior work from around the world has also found associations between dust storms and motor vehicle accidents,^59,60,61,62^ and model-based warning systems for drivers have been developed in some locations.^63,64^
Despite the recognized risk of dust storms, there is a relative paucity of research quantifying direct health outcomes associated with dust storms in the US. Previous work has found dust storms to be positively associated with nonaccidental mortality^3^ and total and respiratory ICU admissions^57^ over subsequent days across the Western US, motor vehicle accidents in 3 California counties,^62^ and, less certainly, Valley fever in Arizona and California.^65,66^ However, to our knowledge, only a single study in the US^67^ has investigated associations with ED visits, and it was limited to zip codes located near PM monitors in the Interagency Monitoring of Protected Visual Environments (IMPROVE) network, which measures air quality in US national parks, and to days when IMPROVE monitors are collecting data (roughly every third day). ED visits constitute an important indicator of acute health problems. The ED is the only component in the US health care system that is accessible at any time of day, and it plays important roles in disaster response.^68,69,70^ ED visits are more common than other administrative outcomes, such as hospitalizations and ICU admissions. In 2017, there were 144.8 million ED visits in the US, costing a total of $76.3 billion.^71^ Because EDs provide treatment regardless of the ability of patients to pay, these settings often serve as the safety net for underresourced populations with care-seeking barriers.^72,73,74^ Furthermore, the ED setting is noted as being a more sensitive and real-time indicator than mortality.^75,76^
This study aimed to bridge the gap in knowledge about dust storms and ED visits in the US. We hypothesized that dust storms would have positive associations with certain respiratory and cardiovascular outcomes, as well as motor vehicle accidents. This study investigated their associations across 3 Southwestern states where dust storms are relatively frequent using dust storm data with greater spatial coverage and temporal completeness than prior ED work, with a resulting increase in scope and power.
Methods
This cross-sectional study was approved by the Emory University Institutional Review Board, with a waiver of consent. The waiver of consent was granted given that this research was deemed to involve no more than minimal risk, could not practicably be carried out without the requested waiver, and involved use of identifiable private information and could not practicably be carried out without using such information in an identifiable format and given that the waiver would not adversely affect the rights and welfare of participants. The study follows the Strengthening the Reporting of Observational Studies in Epidemiology (STROBE) reporting guideline for cross-sectional studies.
Study Area and Population
This study focused on 3 states in the US Southwest: Arizona, California, and Utah. These states were selected based on their high incidence of dust storms and availability of comprehensive health data. The study period spans from 2005 to 2018 (Arizona: July 1, 2010, to December 31, 2018; California: January 1, 2005, to December 31, 2018; Utah: January 1, 2005, to December 31, 2016). The difference in time periods by state is due to differences in data availability from the 3 health departments.
Dust Storm Events
Data on dust storm occurrences were sourced from the US National Weather Service (NWS) Storm Events Database^77^ and are localized to NWS Weather Forecast Zones (WFZs). In the Eastern US, WFZs tend to be coterminous with counties, but in the Western US, they tend to be smaller than counties and more closely follow topographic features. All storm events with EVENT_TYPE listed as Dust Storm were included.
The storm dataset includes information on the timing, duration, and geographical extent of each dust storm, as well as the NWS regional office generating the dust storm report. Where multiple dust storm events were reported on the same day in the same WFZ, they were treated as a single dust storm event. When a single dust storm was reported to last into a second day, it was treated as 2 dust storms. Each dust storm event was georeferenced to ED patient residential zip codes based on a minimum 5% areal overlap with NWS forecast zones. A map of these zip codes is found in eFigure 1 in Supplement 1.
Emergency Department Visits
Patient-specific ED visit records were obtained from the 3 state health departments, constituting complete capture during each state’s study years. However, only zip codes overlapping NWS WFZs in which at least 1 dust storm was reported during the study period were included in the study. Many of these zip codes, especially those in Utah, were in rural areas and thus contributed few ED visits.
ED visit records included the date of visit, primary and secondary *International Classification of Diseases, Ninth Revision *(ICD-9) and *International Statistical Classification of Diseases and Related Health Problems, Tenth Revision *(ICD-10) diagnoses, patient demographics (age, sex, race, and ethnicity), and zip code of residence. Race and ethnicity data were taken from state health department administrative databases, where this information was taken from hospital billing record data. Categories varied but included American Indian or Native Alaskan, Asian, Black, Native Hawaiian or Other Pacific Islander, White, and multiracial; numbers are reported only for Black and White participants in the demographic table because other categories were small and categories were not consistent across state or time. Race and ethnicity are reported to provide a demographic description of the study population. The health outcomes analyzed were chosen to reflect conditions previously found to be associated with or thought to be exacerbated by dust exposure, including respiratory conditions (asthma [ICD-9: 493; ICD-10: J45], chronic obstructive pulmonary disease [COPD; ICD-9: 491, 492, and 496; ICD-10: J41-J44], and culture-negative pneumonia [ICD-9: 485-486; ICD-10: J18]), cardiovascular conditions (congestive heart failure [ICD-9: 428; ICD-10: I42, I50-I51], ischemic heart disease [ICD-9: 410-414; ICD-10: I20-I25], and cerebrovascular disease [ICD-9: 430-434, 436-438; ICD-10: I60-I69]), and motor vehicle accidents (ICD-9: E810-E819; ICD-10: V87-V89). Outcomes were defined based on primary ICD-9 or ICD-10 diagnosis code, except for motor vehicle accidents, which were defined based on secondary diagnosis codes given that no primary codes were observed for this outcome.
Meteorology and Air Pollution
ED visits may be influenced by other air pollutant exposures aside from dust storms in ways that may have confounded our main association. Daily ambient air pollution data for nitrogen dioxide (NO_2_; 1-h maximum), ozone (O_3_; 8-h maximum) and PM_2.5_ (24-h mean) concentrations at a 1 km × 1 km spatial resolution were obtained from the Socioeconomic Data and Applications Center (SEDAC),^78^ and the spatial mean was found to the zip code level. Air pollution data were available only for 2005 to 2016, and therefore all analyses that included these air pollutant variables excluded the years 2017 and 2018.
PM_10_ data were not available from SEDAC. However, much of the airborne dust in dust storms is in the form of PM_10_, and it has been shown^3,57^ that ambient PM_10_ concentrations tend to be highly correlated with dust storm events. Therefore, controlling for PM_10_ would be inappropriate.
Exposure Assessment
Binary indicators for the presence of dust storm events were assigned to zip code- and cause-specific daily ED visit counts. We considered exposures defined by whether a dust storm occurred on the same day (lag 0), over the last 2 days (lag 0-2), over the last 5 days (lag 0-5), or over the last week (lag 0-7). Days falling on the same day of week in the same month but without a storm event were treated as matched control days within a stratum. This design controls for time-invariant confounders and is particularly suited for acute environmental exposures, such as dust storms. Only strata that had at least 1 dust storm were included in the analysis because strata without any event could not contribute to the estimation of dust storm outcomes.
Statistical Analysis
Time-stratified case-crossover conditional quasi-Poisson regression models were used to estimate the relative risk (RR) of the outcome (daily ED visit counts) associated with exposure to dust storms. ED visit counts on control days served as the control population. We controlled for temperature using a combination of natural splines with 5 degrees of freedom each for mean temperature on the exposure day and 3-day moving mean temperature on the days after the exposure day. We controlled for dew point temperature in the same way. Strata-specific intercepts automatically controlled for temporally invariant factors within each zip code, as well as smoothly but slowly varying factors in time. We accounted for shorter-term time trends by including a temporal spline in the model with 4 degrees of freedom per year. Crude models with only dust storm term and strata-specific intercepts were also estimated. The level of significance was set at α = .05 unless otherwise stated, and P values were 2-sided. Analyses were performed using R statistical software version 4.4.1 (R Project for Statistical Computing) and SAS statistical software version 9.4 (SAS Institute). Data were analyzed between April 21 and November 12, 2024.
Attributable Fraction
Based on the distribution of coefficients estimated by our main model, we simulated 5000 total ED visit counts under the observed distribution of dust storms and under a scenario with the dust storm variable set to 0, which we label N_dust,i and N_nodust,I, respectively, for replicate i. The attributable fraction (AF) for replicate i expressed as a percentage was then AF_i_ = 100% × [1 − (N_nodust,i/N_dust,i)]. From the resulting distribution, we calculated 2.5th, 50th, and 97.5th percentiles of the attributable fraction. Due to the structure of our models, we calculated this fraction with respect to the number of ED visits encompassed by the set of zip code-days used in our models, not all ED visits.
Sensitivity Analyses
Sensitivity analyses were conducted to assess the robustness of findings across different model specifications. These analyses included (1) varying the overlap percentage used to assign dust storms to zip codes from 5% to 10% and 20%, which changes the balance between sample size and exposure accuracy (in particular, by switching some dust storm exposure values from 1 to 0); (2) defining outcomes based on both primary and secondary ICD-9 and ICD-10 diagnosis codes as opposed to primary only; (3) varying the degrees of freedom in spline functions used to model temporal trends (degrees of freedom/y = 4, 8, or 12); (4) controlling air pollutants (O_3_, NO_2_, and PM_2.5_) in models (recall that these models do not use ED visits and dust storms from 2017 to 2018 owing to data availability), and (5) comparing results between outpatient ED visits and inpatient ED visits resulting in hospitalization.
Results
Descriptive Statistics
The main analyses encompassed 206 reported days of dust storms and 129 506 ED visits by patients residing in zip codes with 5% areal overlap with NWS forecast zones in which dust storms are reported (eFigure 1 in Supplement 1). Of the ED visits, 33 500 visits fell into time strata used in our analyses (5717 children aged 0-17 years [17.1%] and 11 150 adults aged >65 years [33.3%]; 17 394 male [51.9%] and 16 104 female [48.1%]; 2829 Black [8.4%] and 22 537 White [67.2%]; 9256 Hispanic [27.6%]) (Table 1).
Cause-specific counts of overall ED visits in the study period in the states under investigation are presented in eTable 1 in Supplement 1. Table 2 presents cause-specific counts of those ED visits falling into time strata used in our analyses. Among our studied outcomes, the largest numbers of ED visits falling into time strata were for motor vehicle accidents (6753 visits [20.2%]) and asthma (6734 visits [20.1%]), followed closely by culture-negative pneumonia (6303 visits [18.8%]). Among these, motor vehicle accidents and asthma had the highest proportion of outpatient visits (6076 outpatient visits [90.0%] and 5877 outpatient visits [87.3%], respectively), followed by other respiratory end points. Cardiovascular end points had lower proportions of outpatient visits, with cerebrovascular diseases having the lowest (897 outpatient visits among 1917 inpatient or outpatient visits [25.3%]).
ED visits were nearly balanced between Arizona (17 701 visits [52.8%]) and California (15 690 visits [46.8%]), with Utah making only a small contribution (109 visits [0.3%]) owing to the small number of dust storms reported (Table 3) and the low population in its dust-impacted zip codes. State-level demographics are reported in eTable 2 in Supplement 1.
Counts of ED visits after dust storms but not control days by state and exposure window are presented in eTable 3 in Supplement 1. For example, there were 172 ED visits for asthma in Arizona on the day of dust storms but 1168 ED visits over the 0 to 7–day lag period.
Dust Storm Exposure Analysis
As presented in Table 3, Arizona had the largest number of dust-impacted zip codes (128 zip codes), followed by California (70 zip codes) and Utah (8 zip codes). Among dust-impacted zip codes, Arizona also had the highest mean (SD) number of dust storm days per year (16.3 [4.0] days) followed by California (5.1 [2.2] days) and Utah (0.2 [0.4] days).
Health Outcomes Associated With Dust Storms
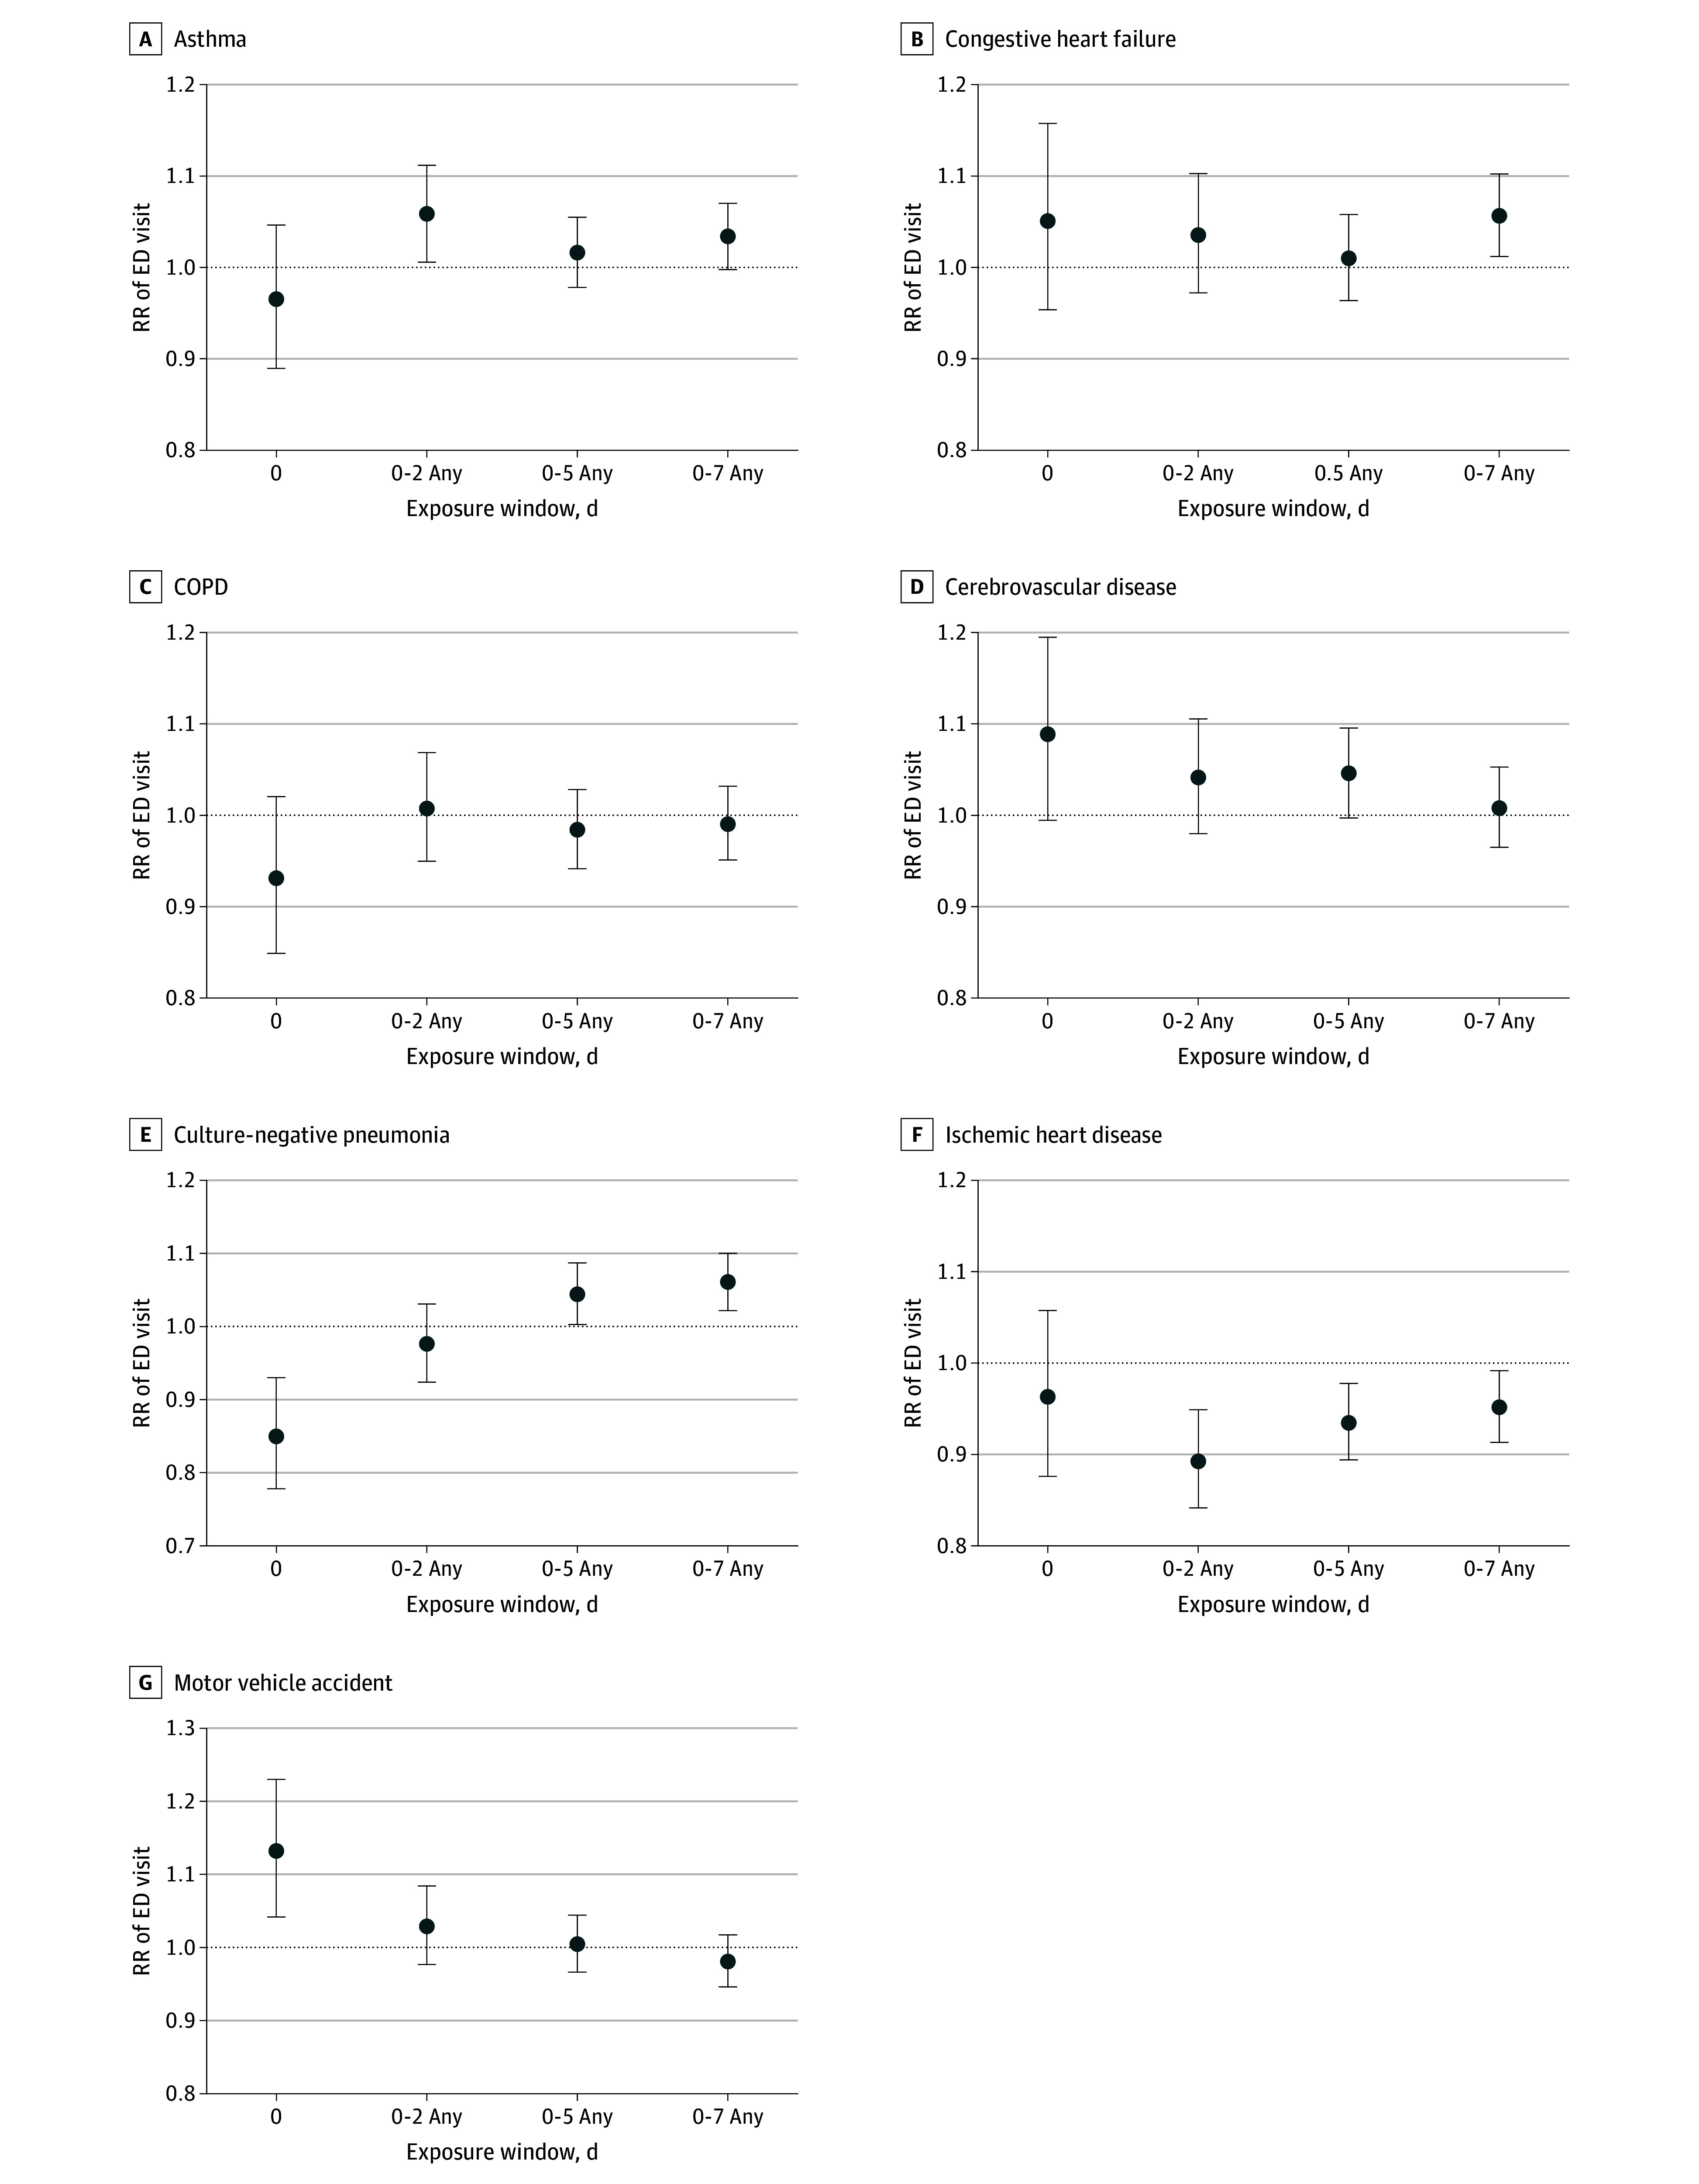
As shown in the Figure, dust storms were positively associated with ED visits for asthma over the 0 to 2–day exposure window (RR, 1.06; 95% CI, 1.01-1.11; P = .03), culture-negative pneumonia (RR, 1.06; 95% CI, 1.02-1.10; P = .002) and congestive heart failure (RR, 1.06; 95% CI, 1.01-1.10; P = .01) over the 0 to 7–day window, and motor vehicle accidents on the day of the dust storm (RR, 1.13; 95% CI, 1.04-1.23; P = .003). However, dust storms were negatively associated with ED visits for culture-negative pneumonia on the day of the storm (RR = 0.85; 95% CI, 0.78-0.93; P < .001) and ischemic heart disease over 3 exposure windows (eg, 0-2 days: RR, 0.89; 95% CI, 0.84-0.95; P < .001). Crude estimates were similar to the main model estimates excepting positive associations with cerebrovascular disease at lags 0 and 0 to 5 days (eFigure 2 in Supplement 1).
Association of Dust Storms With Emergency Department (ED) Visits by Health OutcomeDust storms could occur on any day of the given lag day range. COPD indicates chronic obstructive pulmonary disease; RR, relative risk; whiskers, 95% CIs.
Attributable Fraction
The fraction of ED visits attributable to dust storms ranged as high as 1.79% (95% CI, 0.61% to 2.94%) for culture-negative pneumonia (0-7–day lag) and 1.70% (95% CI, 0.39% to 3.02%) for congestive heart failure (0-7–day lag) (eFigure 3 in Supplement 1). Because underlying associations were negative for certain outcomes and lag windows, attributable fractions can be negative (eg, −1.74%; 95% CI, −2.84% to −0.56% for ischemic heart disease at the 0-5–day lag).
Sensitivity Analyses
Increasing the areal overlap required to assign a dust storm in a WFZ to a zip code diminished the number of dust-impacted zip codes and thus the number of ED visits to be analyzed. CIs of dust storm-ED visit associations were therefore wider (eFigure 4 in Supplement 1). Associations with culture-negative pneumonia remained positive for longer time windows when the threshold was set at 10% but not at 20%. Defining health outcomes using both primary and secondary ICD-9 and ICD-10 diagnosis codes, compared with use of primary diagnoses only, yielded some differences in observed associations (eFigure 5 in Supplement 1), including the attenuation of negative associations observed with ischemic heart disease and culture-negative pneumonia but stronger positive associations with cerebrovascular disease at lags 0 and 0 to 2 days. Changing the number of degrees of freedom per year to control for time (eFigure 6 in Supplement 1) and including air pollution covariates in the models (eFigure 7 in Supplement 1) produced results similar to the primary analyses. Associations with risk of ED visits for CHF and motor vehicle accidents were robust against adjustment for ambient O_3_(eg, CHF: RR, 1.08; 95% CI, 1.03-1.13; P = .003) and NO_2_ (eg, CHF: RR, 1.08; 95% CI, 1.03-1.13; P = .003) (eFigure 7 in Supplement 1). PM_2.5_ and O_3_ were positively associated with asthma. PM_2.5_ was also negatively associated with cerebrovascular disease, while NO_2_ was negatively associated with COPD. All 3 pollutants were negatively associated with ischemic heart disease (eFigure 8 in Supplement 1). Stratifying results by ED visits resulting in inpatient hospitalization vs outpatient visits yielded large differences for congestive heart failure and COPD at lags 0 and 0 to 2 days, with dust storms having a positive association with inpatient visits and a negative association with outpatient visits. Dust storms were negatively associated with inpatient visits for asthma at lag 0 days, but results were consistent with the null hypothesis for outpatient visits. Over lags 0 to 2 days, dust storms were positively associated with outpatient visits and inpatient visit outcomes were consistent with the null hypothesis. Dust storms were positively associated with ED visits for cerebrovascular disease at all lags and motor vehicle accidents at lag 0 only for outpatient visits (eFigure 9 in Supplement 1).
Discussion
In this cross-sectional study of dust storms and ED visits in 3 Southwestern US states using a time-stratified case-crossover design, we observed robust associations of dust storms identified by NWS reports with ED visits for several health outcomes. In particular, dust storms were consistently and positively associated with ED visits for motor vehicle accidents on the day of the dust storm. Dust storms were also positively associated with asthma and congestive heart failure. There were no observed associations for other outcomes, and associations were negative for ischemic heart disease. These results were robust to changes in different confounder controls, and the positive association with motor vehicle accidents was robust to changes to the WFZ to zip code assignment.
Overall, the fraction of ED visits attributable to dust storms was modest. This may reflect the possibility that reports of dust storms included relatively small or low-intensity dust storms. Furthermore, reported storm durations in the database were overwhelmingly less than 3 hours and thus may have yielded small cumulative exposures to PM.
While we have used primary ICD-9 and ICD-10 diagnosis in the definition of health outcomes (excepting for motor vehicle accidents), the choice of whether to include secondary ICD-9 or ICD-10 diagnosis codes is not obvious. When we included both, our results tended to be attenuated toward the null except for cerebrovascular diseases.
Similarly, ED visit diagnoses vary in how frequently they result in inpatient hospital admission, which can obscure differences in mean severity between, for example, respiratory and cardiovascular diagnoses. A sensitivity analysis stratifying by inpatient vs outpatient visits found that dust storm associations for inpatient visits were more positive than for outpatient visit congestive heart failure and COPD, but more negative for asthma, cerebrovascular disease, ischemic heart disease, and motor vehicle accidents..
The findings of a positive association with asthma ED visits over the 0 to 2–day time window and with culture-negative pneumonia over the 0 to 7–day window are broadly consistent with results in the literature on respiratory outcomes associated with coarse PM.^79,80,81,82^ However, results for cardiovascular outcomes were null in most of our primary models but positive for cerebrovascular disease at lag 0 and lags 0 to 2 days when including secondary diagnosis ICD-9 and ICD-10 codes. This is in contrast to previous work, which found associations with cardiovascular mortality using primary ICD-9 codes only^3^ and no associations with cardiovascular ICU admissions using primary and secondary ICD-9 and ICD-10 codes together.^57^ While ischemic heart disease tended to yield protective dust storm associations in our main models at lag 0 to 2 and 0 to 5 days, these associations were no longer apparent in the model with secondary ICD-9 and ICD-10 codes included. However, one explanation for a negative association may be that ischemic heart disease complications tend to be more severe on dust storm days, and therefore a higher fraction of patients would be admitted straight to the hospital without first going through the ED. Ischemic heart disease was already the most likely to be associated with subsequent hospital admission of any outcome we studied.
The positive association between dust storms and motor vehicle accidents observed here is in contrast to the protective association found previously using data from Phoenix, Arizona.^83^ However, the difference in the direction of association may be attributable to methodological differences. For instance, the prior work focused on a single metropolitan area rather than several states and compared ED visits during the 6 hours after the storm with those in the 6 hours prior to the storm rather than comparing daily ED counts across a month as we did. That work also used a different and likely stricter definition of a haboob than the dust storm definition used here, and it may be that individuals avoid driving in the worst due events but not the more moderate ones and thereby flip the sign of the association.
Dust and sand storms have been associated with motor vehicle accidents and associated health outcomes in a variety of regions, including California,^62^ Saudi Arabia,^60^ and southeastern Iran.^59^ In the US specifically, researchers found that dust storms were responsible for 232 motor vehicle accident deaths in the US over an 11-year period.^61^ However, null results were reported in Kuwait^84^ and Cape Province, South Africa.^85^ The differences may point to differences in dust storm characteristics, driving behavior, and the presence of warning systems for drivers.
Limitations
To our knowledge, this is the largest and most comprehensive study to date of dust storms and ED visits in the US. However, it has several limitations. First, the accuracy of dust storm events listed in the NWS database has been justifiably questioned as being based on potentially inaccurate and subjective observations lacking in quality control,^86^ which can result in dust storms being improperly included or excluded. While efforts have been made to find a better dust characterization approach for health studies,^87^ there is no widely used alternative. Second, the assignment of these events (localized to WFZs, which tend to be relatively large) to zip codes that can be much smaller and do not often align with WFZ boundaries requires choosing how best to perform the assignment. While we followed a previously published approach,^57^ our sensitivity analysis results demonstrated how different choices regarding how to assign WFZs to zip codes led to qualitatively different RR estimates. Third, our work did not differentiate between larger WFZs, which may overlap more zip codes but yield greater exposure misclassification, and smaller WFZs, which may not. Fourth, the unit of analysis used here was the zip code–day, and thus our results were impacted by the ecologic fallacy whereby a uniform exposure is assigned to multiple individuals although true individual exposures vary. Fifth, we performed a large number of statistical tests, which heighten the chance of a false-positive result. Using a more stringent P value threshold of .01, positive associations were still evidenced for culture-negative pneumonia (lag 0-7) and motor vehicle accidents (lag 0) and negative associations for culture-negative pneumonia (lag 0) and ischemic heart disease (lag 0-2). Sixth, our focus on ED visits as a less severe outcome than hospitalizations by necessity fails to encompass direct admissions to the hospital, a common occurrence for acute cardiovascular problems. While it is not always clear whether or in which direction these limitations may have biased our results, we speculate that the accuracy of the database, mapping between WFZs and zip codes, and ecologic fallacy may have produced nondifferential exposure misclassification and thus biased our results toward the null.
Conclusions
This cross-sectional study’s finding of the increase in motor vehicle accidents associated with dust storm days underscores the immediate dangers posed by reduced visibility and hazardous driving conditions during such events. This finding supports the intuitive notion that dust storms are associated with health through biological pathways and through their influence on environmental safety.
Enhancing public awareness about the risks associated with dust storms, especially on days when high dust activity is forecasted, may help at-risk populations take preventive actions, such as avoiding driving, staying indoors, using air purifiers, or wearing protective masks. Health care professionals could also be alerted to the increased likelihood of dust storm–related health issues during these times, which could improve response times and preparedness in emergency and primary care settings.
The reference list from the paper itself. Each links out to its DOI / PubMed record.
- 1Wu C, Lin Z, Shao Y, Liu X, Li Y. Drivers of recent decline in dust activity over East Asia. Nat Commun. 2022;13(1):7105. doi:10.1038/s 41467-022-34823-3 36402787 PMC 9675820 · doi ↗ · pubmed ↗
- 2Aryal Y, Evans S. Dust emission response to precipitation and temperature anomalies under different climatic conditions. Sci Total Environ. 2023;874:162335. doi:10.1016/j.scitotenv.2023.162335 36858225 · doi ↗ · pubmed ↗
- 3Crooks JL, Cascio WE, Percy MS, Reyes J, Neas LM, Hilborn ED. The association between dust storms and daily non-accidental mortality in the United States, 1993-2005. Environ Health Perspect. 2016;124(11):1735-1743. doi:10.1289/EHP 21627128449 PMC 5089887 · doi ↗ · pubmed ↗
- 4East AE, Sankey JB. Geomorphic and sedimentary effects of modern climate change: current and anticipated future conditions in the Western United States. Rev Geophys. 2020;58(4):e 2019 RG 000692. doi:10.1029/2019 RG 000692 · doi ↗
- 5Shi L, Zhang J, Yao F, Zhang D, Guo H. Drivers to dust emissions over dust belt from 1980 to 2018 and their variation in two global warming phases. Sci Total Environ. 2021;767:144860. doi:10.1016/j.scitotenv.2020.144860 33434842 · doi ↗ · pubmed ↗
- 6Zong Q, Mao R, Gong DY, . Changes in dust activity in spring over East Asia under a global warming scenario. Asia Pac J Atmos Sci. 2021;57:839-850. doi:10.1007/s 13143-021-00224-7 · doi ↗
- 7Li J, Hao X, Liao H, . Predominant type of dust storms that influences air quality over northern China and future projections. Earth’s Future. 2022;10(6):e 2022 EF 002649. doi:10.1029/2022 EF 002649 · doi ↗
- 8Li Y, Mickley LJ, Kaplan JO. Response of dust emissions in southwestern North America to 21st century trends in climate, CO 2 fertilization, and land use: implications for air quality. Atmos Chem Phys. 2021;21(1):57-68. doi:10.5194/acp-21-57-2021 · doi ↗