Correction to: Combining Mechanisms of Growth Arrest in Solid Tumours: A Mathematical Investigation
Chloé Colson, Helen M. Byrne, Philip K. Maini

Abstract
Genes, proteins, chemicals, diseases, species, mutations and cell lines named across the full text — each resolved to its canonical identifier and authoritative record.
Click any figure to enlarge with its caption.
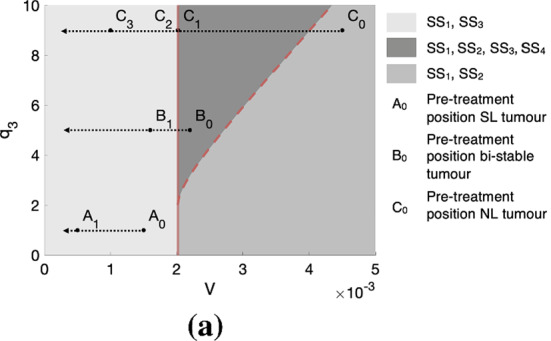 Figure 1
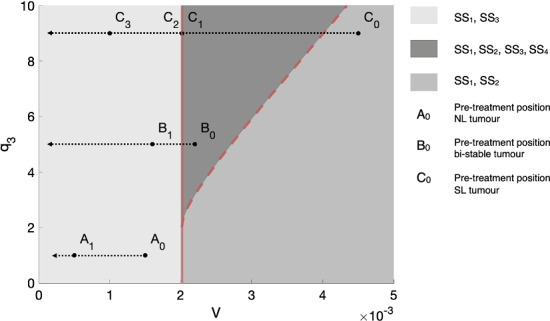 Figure 2
Peer Reviews
No public reviews on file for this paper yet. If you reviewed it on a platform where reviews are public (OpenReview, ICLR, NeurIPS, ICML), you can paste yours below so the community can read it here.
Videos
No videos yet. Explain this paper in a talk, walkthrough, or lecture? Add one.
Taxonomy
TopicsMathematical Biology Tumor Growth
Correction to: Bulletin of Mathematical Biology 10.1007/s11538-022-01034-2
In this article, there were minor typos in the captions of Figs. 3, 5 and 6, and in the legend of Fig. 6a. The correct version of Fig. 6a and corrected captions are given below with changes marked in bold.
1. Figure 3:
Incorrect Caption: Phase portrait for Eqs. (4)–(5), where (a) (V0, q1, q3) = (0.0005, 0.5, 5) and (b) (V0, q3, q1) = (0.0015, 0.5, 5). From (a) and (b), we can find the sign of the component J21 of the Jacobian (23) evaluated at SS_3_ and SS_4_: J21 is, respectively, negative and positive. Since, for SS_3_, we also have J11, J22 < 0 and J12 > 0, this implies that SS_3_ is stable. In contrast, we cannot definitively determine the stability of SS_4_ using the signs of the components of the Jacobian. However, we can see from the trajectories in b that SS_4_ is unstable.
Correct Caption: Phase portrait for Eqs. (4)–(5), where (a) (V0, q1, q3) = (0*.0005,* 0*.5,* 5) and (b) (V0, **q1, q3) = (0*.0015,* 0*.5,* 5). From (a) and (b), we can find the sign of the component J21 of the Jacobian (23) evaluated at SS_3_ and SS_4_: J21 is, respectively, negative and positive. Since, for SS_3_, we also have J11, J22 < 0 and J12 > 0, this implies that SS_3_ is stable. In contrast, we cannot definitively determine the stability of SS_4_ using the signs of the components of the Jacobian. However, we can see from the trajectories in (b) that SS_4_ is unstable.
2. Figure 5:
Incorrect Caption: In (a), we represent the three tumour growth regimes in (V0, q3)-space for q1 = 0.1. In (b), we numerically solve the system (4)–(5) for t ∈ (0, 10^5^] subject to the initial conditions (T(0), c(0)) = (0.05, 1) and plot the evolution of the tumour volume in time. We set (V0, q1, q3) corresponding to points A, B and C in (a), i.e. (V0, q3, q1) = (0.005, 0.15, 0.1), (V0, q3, q1) = (0.014, 0.8, 0.1) and (V0, q3, q1) = (0.035, 0.5, 0.1), respectively. We observe that a tumour characterised by parameter set A grows to a SL steady state, while the tumours characterised by parameter sets B and C both grow to a NL steady state.
Correct Caption: In (a), we represent the three tumour growth regimes in (V0, q3)-space for q1 = 0.5. In (b), we numerically solve the system (4)–(5) for t ∈ (0*,* 10^5^] subject to the initial conditions (T(0), c(0)) = (0*.05,* 1) and plot the evolution of the tumour volume in time. We set (V0, q1, q3) corresponding to points A, B and C in (a), i.e., (V_0, q1, q3) = (0.0005, 0.5, 2), **(**V0, q1, q3)**** = (0.0016, 0.5, 6) and **(**V0, q1, q3_)**** = (0.003, 0.5, 1), respectively. We observe that a tumour characterised by parameter set C grows to a SL steady state, while the tumours characterized by parameter sets A and B both grow to a NL steady state.
3. Figure 6:
Incorrect caption: We illustrate how tumours that belong to different growth regimes respond to treatment 1, under the assumption that the vascular volume, V, is a monotonically decreasing function of the dose, D, of treatment 1. In (a), we show how a nutrient-limited (NL) tumour, a tumour in a bi-stable regime and a spatially limited (SL) tumour, respectively characterised by the parameters (V0, q1, q3) = (0.0022, 1, 1), (V0, q1, q3) = (0.0022, 1, 5) and (V0, q1, q3) = (0.0045, 1, 9), traverse the parameter space as V decreases in response to the application of increasing doses of treatment 1. A0, B0 and C0 respectively represent the pre-treatment position of these three tumours in parameter space. In (b)–(d), we respectively show, using bifurcation diagrams, how the steady state volumes of these three tumours change in response to the same treatment. We see that, for the tumours initially in NL (b) and bi-stable (c) regimes, their steady state volumes both decrease gradually with V. For the tumour initially in a SL regime (d), decreasing V initially leads to a slight increase in tumour steady state volume. However, a sufficiently large decrease in V can cause a large and rapid reduction in tumour steady state volume that is followed by a continued, gradual decrease.
Correct caption: We illustrate how tumours that belong to different growth regimes respond to treatment 1, under the assumption that the vascular volume, V, is a monotonically decreasing function of the dose, D, of treatment 1. In (a), we show how a nutrient-limited (NL) tumour, a tumour in a bi-stable regime and a spatially-limited (SL) tumour, respectively characterised by the parameters (V0, q1, q3) = (0.0015, 1*,* 1), (V0, q1, q3) = (0*.0022,* 1*,* 5) and (V0, q1, q3) = (0*.0045,* 1*,* 9), traverse the parameter space as V decreases in response to the application of increasing doses of treatment 1. A0, B0 and C0 respectively represent the pre-treatment position of these three tumours in parameter space. In (b)–(d), we respectively show, using bifurcation diagrams, how the steady state volumes of these three tumours change in response to the same treatment. We see that, for the tumours initially in NL (b) and bi-stable (c) regimes, their steady state volumes both decrease gradually with V. For the tumour initially in a SL regime (d), decreasing V initially leads to a slight increase in tumour steady state volume. However, a sufficiently large decrease in V can cause a large and rapid reduction in tumour steady state volume that is followed by a continued, gradual decrease.
Figure 6a
Incorrect Figure
Correct Figure