Unraveling a novel therapeutic facet of Etravirine to confront Hepatocellular Carcinoma via disruption of cell cycle
Gouri Nair, G. R. Saraswathy, Jesil Mathew Aranjani, Rafwana Ibrahim

TL;DR
This study explores Etravirine, an HIV drug, as a potential treatment for liver cancer by targeting cell cycle regulators.
Contribution
Etravirine is identified as a novel candidate for HCC treatment through repurposing and targeting CDK2.
Findings
Etravirine showed cytotoxic effects in Huh-7 liver cancer cells.
Etravirine inhibited CDK2, disrupting the cell cycle in Huh-7 cells.
Molecular docking identified Etravirine as a potential CDK2 inhibitor.
Abstract
Hepatocellular Carcinoma (HCC) is a malignancy with high mortality rates and limited treatment options. This study aimed to unearth the repurposable potential of FDA-approved drugs against specific genetic targets governing the HCC pathological pathways. The transcriptomics microarray datasets were explored to retrieve the HCC specific differentially expressed genes, and the significant genes were fed in Search Tool for the Retrieval of Interacting Genes/Proteins (STRING) database to capture the protein-protein interactions, which were visualized in Cytoscape. This revealed CCNA2, a cell cycle regulator, as a potential target, which mediates its action by interacting with CDK1 and CDK2. Further, with the intention of identifying inhibitors for CDK1 and CDK2, a drug library was created, and the drugs were virtually screened against their respective targets via molecular docking and…
Genes, proteins, chemicals, diseases, species, mutations and cell lines named across the full text — each resolved to its canonical identifier and authoritative record.
Click any figure to enlarge with its caption.
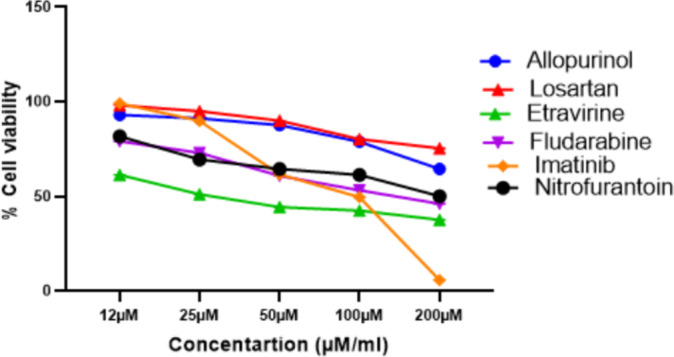 Figure 10
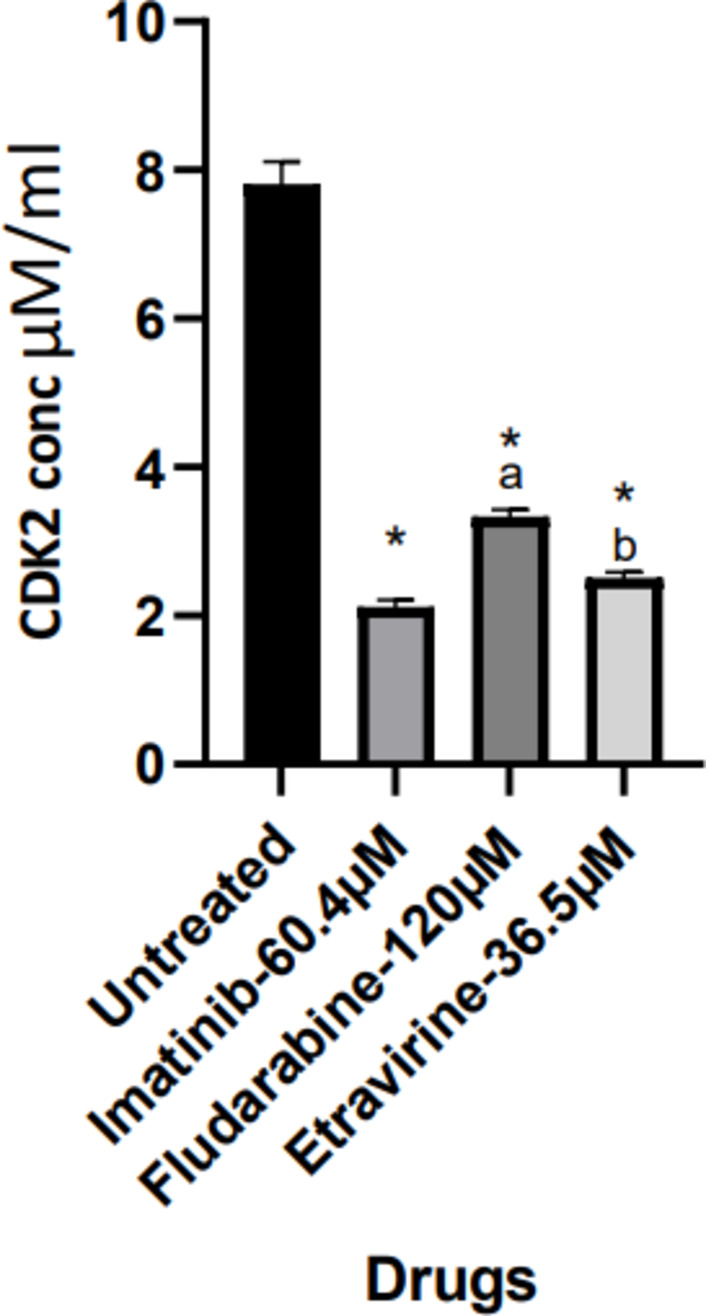 Figure 11
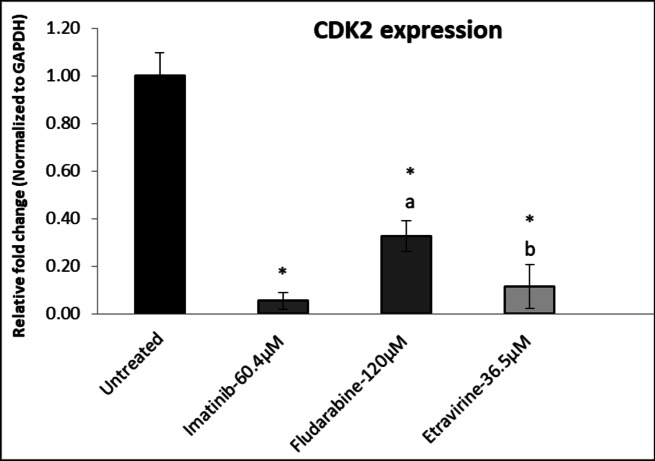 Figure 12
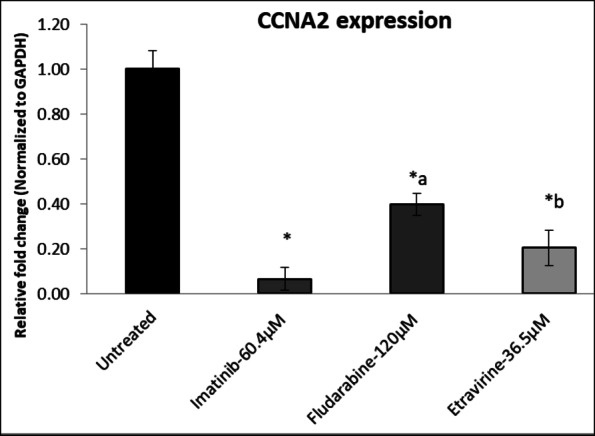 Figure 13
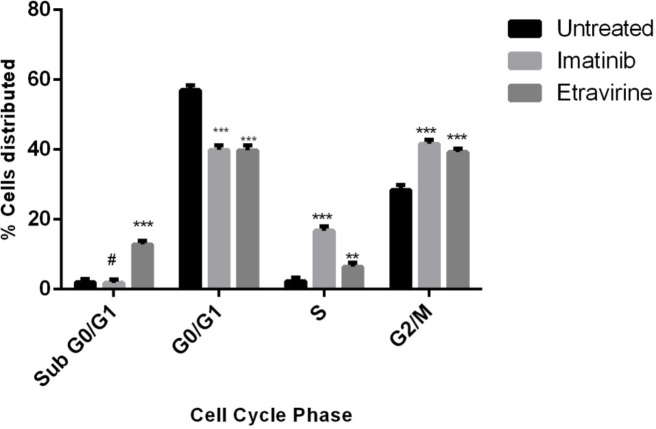 Figure 14
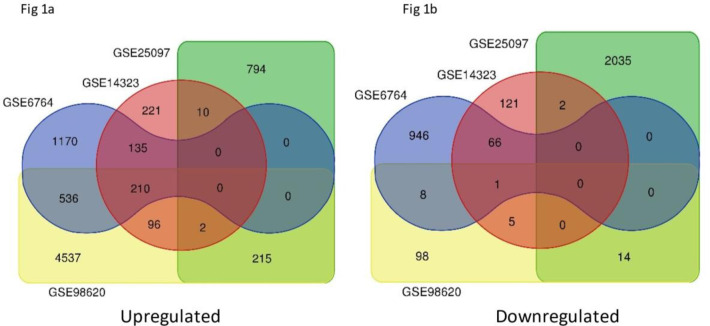 Figure 1
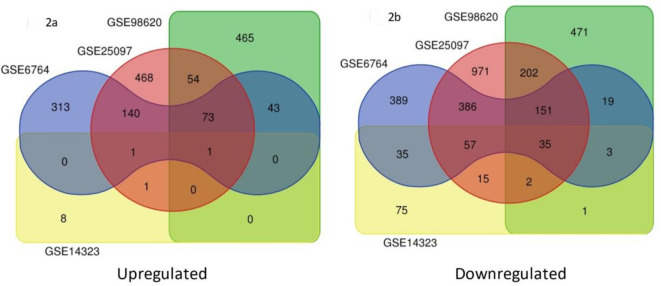 Figure 2
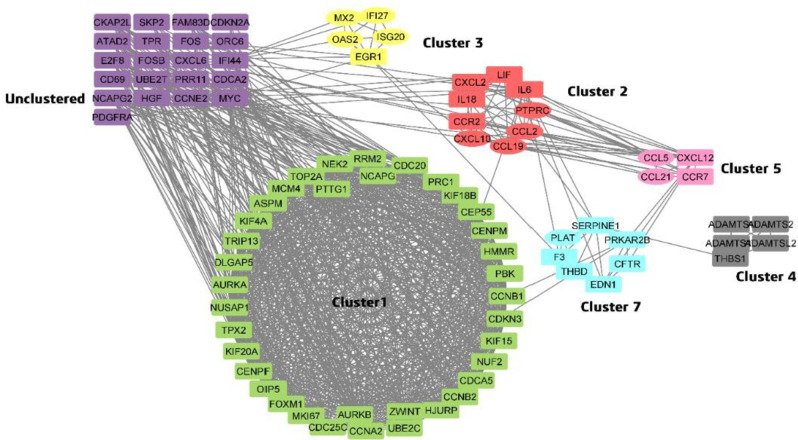 Figure 3
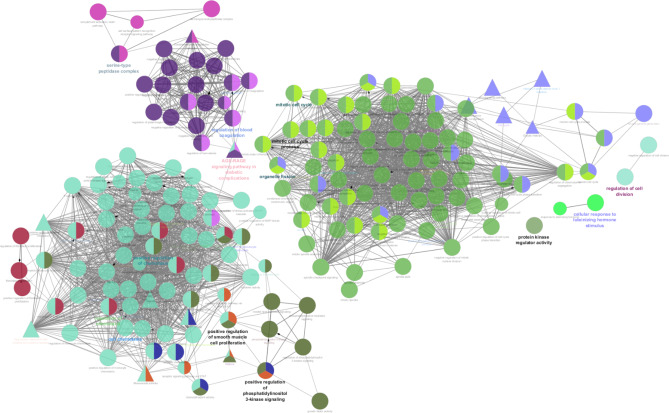 Figure 4
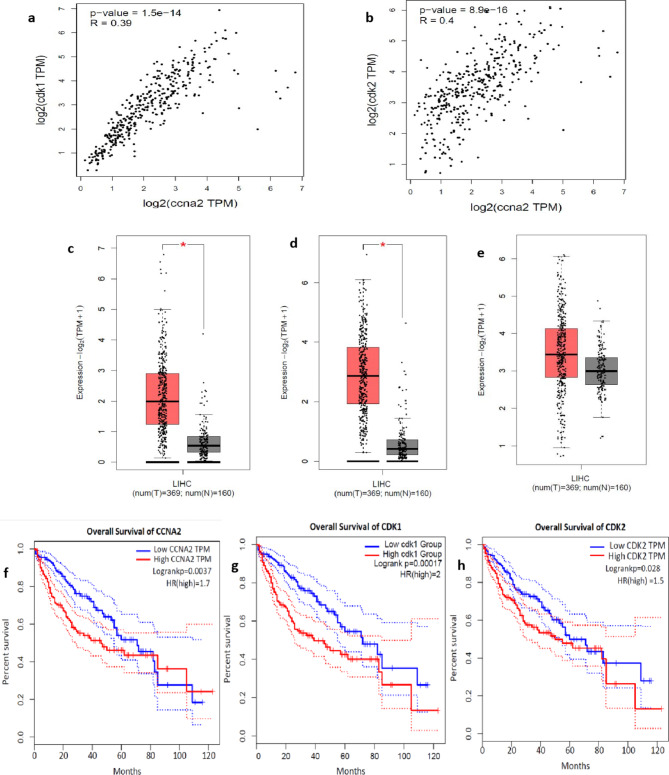 Figure 5
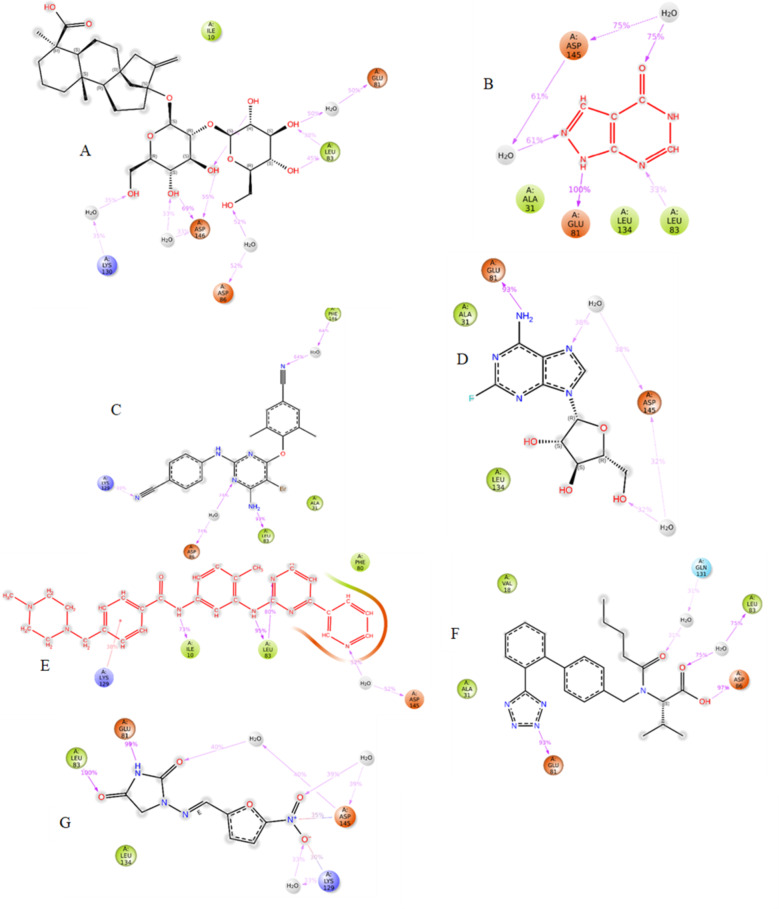 Figure 6
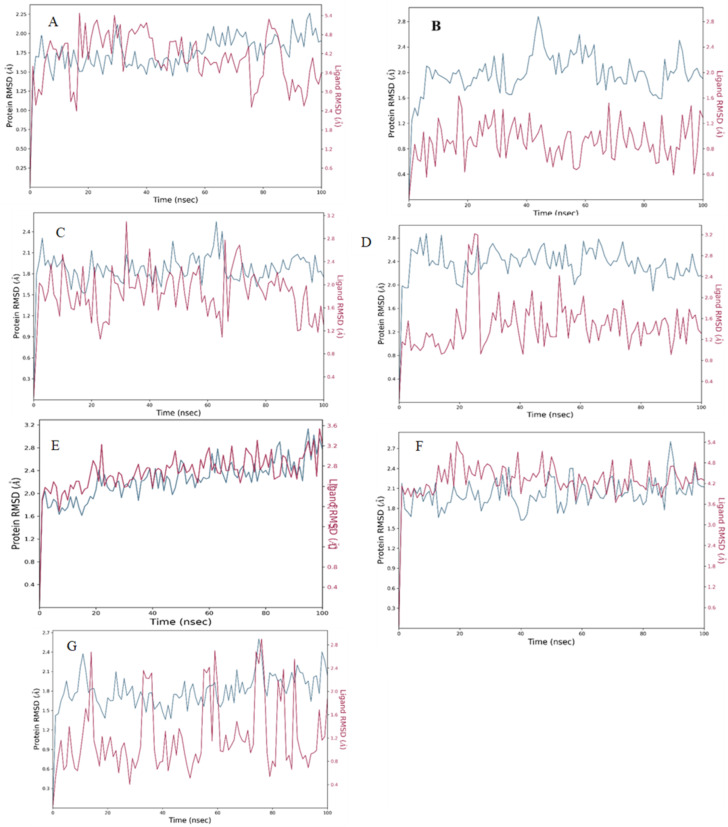 Figure 7
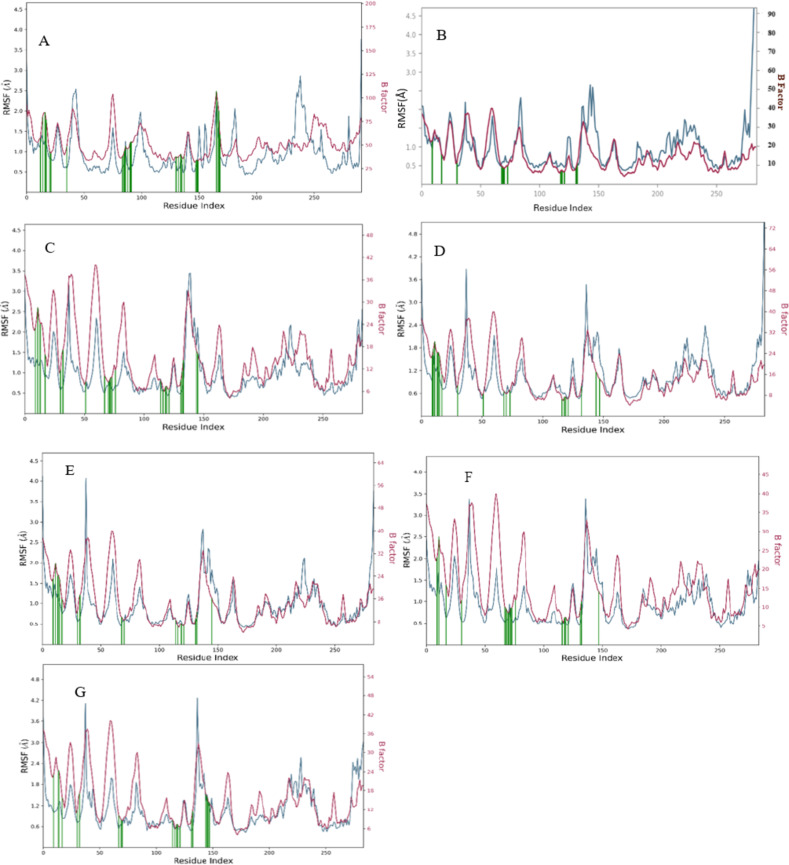 Figure 8
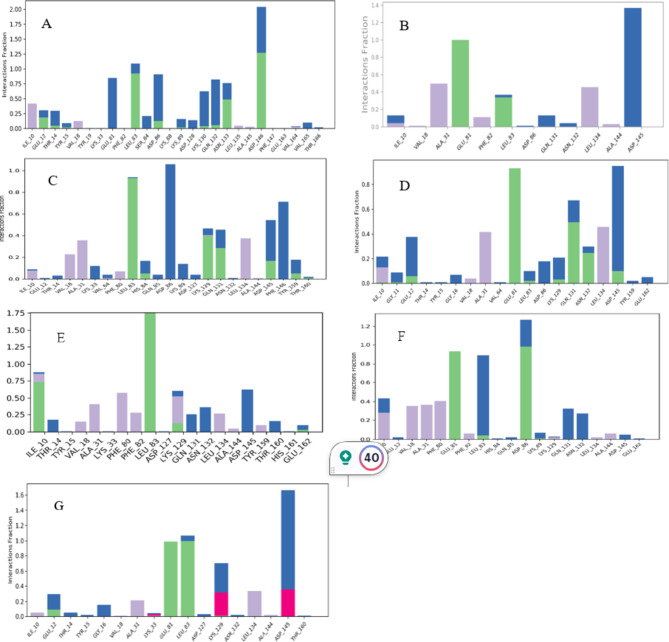 Figure 9
- —Manipal Academy of Higher Education, Manipal
Peer Reviews
No public reviews on file for this paper yet. If you reviewed it on a platform where reviews are public (OpenReview, ICLR, NeurIPS, ICML), you can paste yours below so the community can read it here.
Videos
No videos yet. Explain this paper in a talk, walkthrough, or lecture? Add one.
Taxonomy
TopicsHepatitis B Virus Studies · RNA modifications and cancer · Hepatocellular Carcinoma Treatment and Prognosis
Introduction
Drug repurposing has gained significant traction in recent years as this stratagem systematically orchestrates and leverages cutting-edge technologies to disinter novel therapeutic targets, pathways and indications of existing drugs and abandoned drugs with utmost precision. For instance, Thalidomide, a sedative drug that was outlawed in several nations owing to its catastrophic impact on foetal development, which prompted the establishment of a global pharmacovigilance program, is now studied for its novel therapeutic indications. Currently, this drug is approved by the US FDA for the management of leprosy and multiple myeloma with a special labeling of contraindication in pregnancy^1^.
Drug repurposing is of paramount importance in oncotherapeutics due to intolerable adverse effects and emerging therapeutic resistance, especially in cancers with limited therapeutic options and poor prognosis. Hepatocellular Carcinoma (HCC) is one such aggressive malignancy of global concern with a high mortality rate. In 2020, liver cancer ranked as the sixth most regularly detected cancer and the third main cause of most cancer-related fatalities globally. This devastating disease accounted for over 9,00,000 new diagnoses and more than 8,30,000 deaths^2^. There are reports stating about 9.3 new instances of liver cancer worldwide for every 100,000 population, with an 8.5% death rate^3^. Therapeutic options for HCC include immune checkpoint inhibitors (Nivolumab and Pembrolizumab), multikinase inhibitors (Regorafenib, Lenvatinib, Cabozantinib, and Ramucirumab), and a combination of Bevacizumab/Atezolizumab and Tremelimumab/Durvaluma; however, economic constraints add limitations. Despite numerous approved treatment modalities, the development of effective therapeutic strategies is still an urgent requirement owing to the heterogeneous genetic and epigenetic alterations contributing to development, invasiveness and progression of the disease^4^.
This study is a drug repurposing venture that is focused on disinterring the repurposable potential of FDA-approved drugs against specific genetic targets governing the HCC pathological pathways. At the outset, transcriptomics big data was explored, leveraging bioinformatic algorithms to identify differential gene expression in HCC. Based on statistical significance, robust genes were mapped with proteins that are considered as potential drug targets. Subsequently, standard inhibitors or literature-derived inhibitors specific to the shortlisted disease targets were collated to create a comprehensive drug library by the inclusion of other FDA drugs sharing structural and side effect similarities. Further, computational approaches were employed to establish drug-target interactions virtually. Drugs that displayed significant interactions and stability within the binding pockets of the target proteins were validated for their cytotoxic and cell cycle-arresting properties in Huh-7 cell lines.
Result
Phase 1: identification of potential targets for HCC and pathway analysis
Datasets comprising developmental stages of HCC (normal, cirrhosis, and HCC) were chosen to be the focus of the investigation. The potential druggable targets for HCC and the carcinogenic cascade from preneoplastic lesion to neoplasm were identified by analyzing the gene expression profile.
Omics-based differential gene expression analysis
In normal vs. cirrhosis, 210 common upregulated DEGs, and one common downregulated DEG (Fig. 1). In cirrhosis vs. HCC, total of (73 + 1 + 1) 75 common upregulated DEGs were chosen. Similarly, total of (35 + 151 + 57 + 3 + 2) 248 common downregulated DEGs were shortlisted (Fig. 2).
Fig. 1. Venn diagram of common upregulated and downregulated DEGs in normal Vs cirrhosis based on the criteria “P-value < 0.05 with Log FC > 1”.
Fig. 2. Venn diagram of common upregulated and downregulated DEGs in cirrhosis Vs HCC based on the criteria “P-value < 0.05 with Log FC > 1”.
Protein-protein interactions
Shortlisted common DEGs from Normal Vs Cirrhosis and Cirrhosis Vs HCC were assessed via the STRING tool to identify the physical and functional associations among the proteins of DEGs. The protein interactions were further visualized through Cytoscape, which revealed 2820 edges and 213 nodes. Cyclin A2 (CCNA2) exhibited the highest node degree of 49, with an MCODE score of 28 in cluster 1, and hence, it was identified as a potential DEG (Fig. 3) (Table 1).
Fig. 3PPI of DEGs in different clusters. Elliptical shaped nodes indicate proteins of Normal Vs Cirrhosis and rectangle-shaped nodes indicate proteins of HCC Vs cirrhosis.
Table 1. Cluster analysis of DEGs.Node degreeMCODE ClusterMCODE ScoreGene symbolGroup49Cluster 128.6704546CCNA2C vs. HCC46Cluster 128.6704546CCNB1C vs. HCC46Cluster 128.6704546CDC20C vs. HCC45Cluster 128.6704546TOP2AC vs. HCC44Cluster 128.6704546ASPMC vs. HCC42Cluster 128.6704546AURKAC vs. HCC42Cluster 128.6704546CCNB2C vs. HCC42Cluster 128.6704546CEP55C vs. HCC42Cluster 128.6704546NCAPGC vs. HCC41Cluster 128.6704546AURKBC vs. HCC41Cluster 128.6704546CENPFC vs. HCC41Cluster 128.6704546DLGAP5C vs. HCC41Cluster 128.6704546KIF20AC vs. HCC41Cluster 128.6704546PBKC vs. HCC41Cluster 128.6704546TPX2C vs. HCC40Cluster 128.6704546HMMRC vs. HCC40Cluster 128.6704546NUSAP1C vs. HCC40Cluster 128.6704546RRM2C vs. HCC40Cluster 128.6704546UBE2CC vs. HCC39Cluster 128.6704546KIF4AC vs. HCC38Cluster 128.8245968FOXM1C vs. HCC38Cluster 128.8245968NEK2C vs. HCC38Cluster 128.6704546ZWINTC vs. HCC37Cluster 128.8245968KIF15C vs. HCC37Cluster 128.9376344MKI67C vs. HCC37Cluster 128.6704546PRC1C vs. HCC36Cluster 128.6704546CDKN3C vs. HCC36Cluster 128.6704546OIP5C vs. HCC36Cluster 128.6704546PTTG1C vs. HCC35Cluster 128.6704546HJURPC vs. HCC34Cluster 127CDCA5C vs. HCC33Cluster 126.9334975MCM4C vs. HCC33Cluster 129NUF2C vs. HCC33Cluster 129TRIP13C vs. HCC31Cluster 127CDC25CC vs. HCC30Cluster 127.8193548CENPMC vs. HCC25Cluster 124KIF18BC vs. HCC24Cluster 26.22222222IL6C vs. HCC16Cluster 25PTPRCC vs. HCC14Cluster 26.22222222CCL2N vs. C12Cluster 26.22222222CXCL10N vs. C11Cluster 25.33333333CCL19N vs. C11Cluster 25.78571429CCR2C vs. HCC10Cluster 26.22222222CXCL2C vs. HCC10Cluster 25.78571429LIFC vs. HCC
Gene Set Enrichment Analysis (GSEA)
GSEA of CCNA2 revealed their significant involvement in biological processes such as mitotic sister chromatid segregation GO:0000070, cell cycle G2/M phase transition GO:0044839, fibroblast proliferation GO:0048144 etc. KEGG pathway^1^ revealed that CCNA2 was involved in cell-cycle pathway KEGG:04110, Cellular senescence KEGG:04218 etc. (Fig. 4). Other significant genes in cluster 1 were found to be involved in chromosome separation GO:0051304, regulation of sister chromatid segregation GO:0033045 etc.
Fig. 4. Gene Set Enrichment Analysis. Circular nodes indicated Gene ontology and triangular nodes indicate KEGG pathway.
Validation of hub genes
CCNA2 is a cell cycle regulator protein that combines with CDK2 to facilitate DNA replication when the cell enters the S phase. Moreover, it also forms the CDK1-CCNA2 complex, which is essential for cell progression into mitosis. Many malignancies exhibit overactivation of the CDK2- CCNA2 and CDK1-CCNA2 complexes, making them a promising target for cancer therapy. The disruption of CCNA2/CDK2 and CCNA2/CDK1 complexes may be facilitated by the development of highly efficient inhibitors^5,6^.
Spearman’s correlation analysis of mRNA expression in GEPIA2 revealed a positive association between CDK2 and CCNA2 and between CDK1 and CCNA2 (Fig. 5a and b) in HCC. This suggests that an upregulation in the expression of CCNA2 is associated with an increased expression of both CDK2 and CDK1. Moreover, CCNA2, CDK2, and CDK1 were found to be overexpressed in HCC (Log2FC = 1 and p-value = 0.01) compared to normal (Fig. 5c, d, and e). Furthermore, high expression levels of CCNA2, CDK1, and CDK2 were significantly associated with (p < 0.01) poorer OS in HCC patients (Fig. 5f, g and h). Hence, CDK2 and CDK1 were chosen as the HCC targets, and a drug library was created to identify the inhibitors that may hinder the complex formation of CDKs with CCNA2, thereby inducing cell cycle arrest.
Fig. 5. Validation of hub genes: (a, b) indicate positive correlation of expression of CCNA2- CDK1 and CCNA2-CDK2 in HCC. Fig (c,** d**,** e**) box plots representing the expression of CCNA2, CDK1, and CDK2 respectively in normal (grey colour) and HCC (red colour). (f,** g**,** h**) indicate the overall survival of patients with CCNA2, CDK1, and CDK2 expression.
Phase 2: creation of drug library
Given the fact that there were hitherto no FDA-approved drugs available for CDK1 and CDK2, meticulous literature mining was carried out to retrieve potential antagonists for the above targets. This search revealed Dihydroartemisinin as the tumor suppressor by targeting CDK1^7,8^; on the other hand, it demonstrated Imatinib^9^ and Bosutinib^10^ as potential antagonists against CDK2. Subsequently, a drug library was created with drugs exhibiting structural and side effect similarities with the above-mentioned standard or literature-derived drugs.
This screening process revealed ten drugs exhibiting structural similarities with Dihydroartemisinin (Table 2); however, there were no drugs that shared similar side effects. In the case of Bosutinib, 60 drugs (Table 3) were structurally similar and 335 drugs (Table 4) showed side effect similarity. Similarly, the structural similarity search of Imatinib (Table 5) yielded nine drugs, while 234 drugs shared the side effect similarity (Table 6).
Table 2. List of structural similar drugs of Dihydroartemisinin.Sl NoDrug Bank IDSimilarity ScoreDrugs1DB11638Score 1.0Dihydroartemisinin (standard)2DB06697Score 0.991Artemether3DB13851Score 0.991Artemotil4DB09274Score 0.813Artesunate5DB02772Score 0.573Sucrose6DB00581Score 0.538Lactulose7DB04465Score 0.538Lactose8DB12942Score 0.534Lactitol9DB11602Score 0.534Hydroxyethyl cellulose10DB15617Score 0.534Ferric derisomaltose11DB12434Score 0.5Steviolbioside
Table 3. List of structural similar drugs of Bosutinib.Sl noDrug Bank IDSimilarity ScoreDrugs1DB06616Score: 1.0Bosutinib2DB11828Score: 0.652Neratinib3DB00317Score: 0.596Gefitinib4DB05294Score: 0.583Vandetanib5DB00530Score: 0.554Erlotinib6DB08916Score: 0.54Afatinib7DB06608Score: 0.535Tafenoquine8DB01180Score: 0.534Rescinnamine9DB01220Score: 0.531Rifaximin10DB09101Score: 0.53Elvitegravir11DB12674Score: 0.53Lurbinectedin12DB03614Score: 0.529Mecobalamin13DB06290Score: 0.529Simeprevir14DB00200Score: 0.528Hydroxocobalamin15DB00206Score: 0.528Reserpine16DB00590Score: 0.527Doxazosin17DB00696Score: 0.526Ergotamine18DB01259Score: 0.525Lapatinib19DB11963Score: 0.524Dacomitinib20DB00570Score: 0.524Vinblastine21DB00762Score: 0.522Irinotecan22DB11574Score: 0.522Elbasvir23DB01137Score: 0.521Levofloxacin24DB01165Score: 0.521Ofloxacin25DB00361Score: 0.521Vinorelbine26DB17083Score: 0.521Linzagolix27DB13783Score: 0.52Acemetacin28DB00014Score: 0.52Goserelin29DB00541Score: 0.52Vincristine30DB11613Score: 0.52Velpatasvir31DB01089Score: 0.519Deserpidine32DB00080Score: 0.519Daptomycin33DB11586Score: 0.519Asunaprevir34DB00320Score: 0.518Dihydroergotamine35DB04115Score: 0.518Berberine36DB09047Score: 0.517Finafloxacin37DB09330Score: 0.517Osimertinib38DB11800Score: 0.516Tivozanib39DB00309Score: 0.516Vindesine40DB06699Score: 0.516Degarelix41DB11641Score: 0.516Vinflunine42DB11979Score: 0.516Elagolix43DB13345Score: 0.516Dihydroergocristine44DB06719Score: 0.515Buserelin45DB11581Score: 0.514Venetoclax46DB15102Score: 0.514Pemigatinib47DB00328Score: 0.514Indomethacin48DB12141Score: 0.513Gilteritinib49DB12483Score: 0.513Copanlisib50DB01200Score: 0.512Bromocriptine51DB09078Score: 0.512Lenvatinib52DB15413Score: 0.512Pafolacianine53DB16390Score: 0.511Mobocertinib54DB09128Score: 0.511Brexpiprazole55DB01419Score: 0.51Antrafenine56DB15685Score: 0.51Selpercatinib57DB11691Score: 0.51Naldemedine58DB12010Score: 0.51Fostamatinib59DB09297Score: 0.51Paritaprevir60DB11274Score: 0.508Dihydro-alpha-ergocryptine
Table 4. List of side effect similar drugs of Bosutinib.SI NoDrugsSI NoDrugsSl NoDrugs15-aminosalicylic acid113Colchicine225Mycophenolate Mofetil25-Aminolevulinic Acid114Dipyridamole226Parecoxib35-Aza-2’-Deoxycytidine115Disopyramide227Paroxetine45-Azacytidine116Dobutamine228Auranofin55-Fluorocytosine117Docetaxel229Pemetrexed65-Fu118Diphenhydramine230Pantoprazole76-Mercaptopurine119Dolasetron231Penciclovir86-Thioguanine120Donepezil232Penicillin9Amlodipine Besylate121Gadoversetamide233Risperidone10Amoxapine122Galantamine234Ritonavir11Amoxicillin123Ganciclovir235Rivastigmine12Amphotericin B124Gatifloxacin236Rofecoxib13Ampicillin125Gefitinib237Ropinirole14Amsacrine126Gemcitabine238Ropivacaine15Anagrelide127Gemfibrozil239Rosiglitazone16Anidulafungin128Copolymer 1240Mycophenolic Acid17Anthracycline129Gemifloxacin241Rosuvastatin18Apixaban130Gentamicin242Rufinamide19Aprepitant131Glibenclamide243Ruxolitinib20Arsenic132Cyproterone244Naratriptan21Asenapine133Glipizide245Sitaxsentan22Aspirin134Gold Sodium Thiomalate246Sevoflurane23Atazanavir135Cyproterone Acetate247Nebivolol24Atenolol136Granisetron248Sibutramine25Atorvastatin137Guanidinium249Silver Sulfadiazine26Atovaquone138Haloperidol250Simvastatin27Axitinib139Cytarabine251Nefazodone28Axitinib140Heparin252Sorafenib29Azathioprine141Hepatitis B Vaccines253Sotalol30Azithromycin142Hexamethylmelamine254Sparfloxacin31Aztreonam143Histamine255Spironolactone32Belinostat144Hydralazine256Stavudine33Benazepril145Hydrochlorothiazide257Stiripentol34Benazeprilat146Hydrocodone258Streptomycin35Bendamustine147Hydroflumethiazide259Streptozotocin36Bendrofluazide148Hydroxychloroquine260Sulfadiazine37Benicar-Hct149Doxazosin261Olmesartan38Benzathine Penicillin150Hydroxyurea262Sulfamethoxazole39Betaxolol151Ibuprofen263Sulfasalazine40Bexarotene152D-Telaprevir264Nelarabine41Bexarotene153Icodextrin265Sulindac42Bezafibrate154Idarubicin266Sumatriptan43Bicalutamide155Ifosfamide267Sunitinib44Bisoprolol156Iloprost268Tacrolimus45Bivalirudin157Doxepin269Pentostatin46Bleomycin158Imatinib270Tamoxifen47Boceprevir159Imipramine271Irbesartan48Bortezomib160Temsirolimus272Telmisartan49Losartan161Indinavir273Temazepam50Bosutinib162Dabigatran274Nelfinavir51Bosutinib163Indomethacin275Temozolomide52Bupropion164Irbesartan276Teniposide53Busulfan165Isomannide277Terazosin54Cabazitaxel166Isoniazid278Terbinafine55Cabozantinib167Dabigatran Etexilate279Nevirapine56Cabozantinib168Isosorbide-5-Mononitrate280Testosterone57Candesartan169Isradipine281Tetracycline58Candesartan Cilexetil170Itraconazole282Thalidomide59Capecitabine171Ixabepilone283Thiazide60Captopril172Ketoconazole284Thioridazine61Ciprofloxacin173Dabrafenib285Valsartan62Cytarabine174Dacarbazine286Nicorandil63Darunavir175Dalbavancin287Nifedipine64Delavirdine176Dalteparin288Nilotinib65Diltiazem177Ketoprofen289Thiotepa66Doxycycline178Doxorubicin290Pentoxifylline67D-Penicillamine179Efavirenz291Phenylbutyric Acid68Duloxetine180Perindopril292Pergolide69Emtricitabine181Danazol293Nimodipine70Enfuvirtide182Cyclobenzaprine294Nabumetone71Eprosartan183Doripenem295Penicillin V72Epsilon-aminocaproic acid184Emtricitabine296Phenytoin73Eptifibatide185Entacapone297Pilocarpine74Eribulin186Piroxicam298Perindoprilat75Erlotinib187Dothiepin299Pentamidine76Estramustine188Pralatrexate300Carfilzomib77Estramustine189Ertapenem301Polythiazide78Etoposide190Etodolac302Procaine Penicillin79Etravirine191Etoricoxib303Promethazine80Famciclovir192Dantrolene304Nitric Oxide81Fosamprenavir193Dasatinib305Nitrofurantoin82Goserelin194Esomeprazole306Ponatinib83Irinotecan195Deferasirox307Nitrogen Mustard84Lisinopril196Ethionamide308Procainamide85Mersyndol197Procarbazine309Prochlorperazine86Moxifloxacin198Deferoxamine310Nitrous Oxide87Nilotinib199Delamanid311Nizatidine88Octreotide200Everolimus312Propylthiouracil89Pamidronate201Ketorolac313Thiothixene90Pazopanib202Delavirdine314Norfloxacin91Piperacillin203Ethacrynic Acid315Pravastatin92Pixantrone204Ethambutol316Pregabalin93Ponatinib205Demeclocycline317Nortriptyline94Posaconazole206Deprenyl318Ofatumumab95Pramipexole207Desipramine319Ofloxacin96Prasugrel208Eslicarbazepine Acetate320Pomalidomide97Propafenone209Digoxin321Paliperidone98Raltegravir210Dexamethasone322Olanzapine99Regorafenib211Dexmedetomidine323Olmesartan100Ribavirin212Dexrazoxane324Olsalazine101Rilpivirine213Diatrizoate325Omeprazole102Rivaroxaban214Diazepam326Oseltamivir103Rivastigmine215Diazoxide327Oxaliplatin104Sertraline216Glimepiride328Saquinavir105Signifor217Cyproheptadine329Naproxen106Som230218Cyclophosphamide330Nalidixic Acid107Sorafenib219Dichlorphenamide331Oxaprozin108Sunitinib220Diclofenac332Oxcarbazepine109Tenoxicam221Buspirone333Tenofovir110Thalidomide222Dicloxacillin334Oxprenolol111Thymidine223Didanosine335Oxytetracycline
Table 5. List of structural similar drugs of Imatinib.Sl noDrug Bank IDSimilarity ScoreDrugs1DB00619Score: 1.0Imatinib2DB04868Score: 0.751Nilotinib3DB16390Score: 0.749Mobocertinib4DB09330Score: 0.603Osimertinib5DB12001Score: 0.602Abemaciclib6DB14726Score: 0.519Dabigatran7DB11697Score: 0.509Pacritinib8DB08901Score: 0.51Ponatinib9DB06695Score: 0.505Dabigatran etexilate
Table 6. List of side effect similar drugs of Imatinib.Sl NoDrugsSl NoDrugsSl NoDrugs1Aliskiren79Samarium157Nilotinib2Ambrisentan80Saquinavir158Ofloxacin3Aprepitant81Sitaxsentan159Oxaliplatin4Aripiprazole82Sofosbuvir160Paclitaxel5Atazanavir83Sorafenib161Pazopanib6Atropine84Stavudine162Pemetrexed7Axitinib85Sunitinib163Pentamidine8Azilsartan86Telmisartan164Pimecrolimus9Azithromycin87Temsirolimus165Piroxicam10Bendamustine88Tenofovir Disoproxil Fumarate166Podophyllotoxin11Bicalutamide89Tinidazole167Ponatinib12Bivalirudin90Pemetrexed168Indomethacin13Bosentan91Tirofiban169Pramipexole14Bromazepam92Tramadol170Raltitrexed15Caffeine93Trandolapril171Retinoic Acid16Cancidas94Posaconazole172Ixabepilone17Capecitabine95Trovafloxacin173Ribavirin18Carbidopa96Vandetanib174Risperidone19Cefaclor97Warfarin175Rivastigmine20Cefditoren985-Aminolevulinic Acid176Ropinirole21Cefpodoxime998-MOP177Sertaconazole22Cefuroxime100Cancidas178Sorafenib23Celecoxib101Ge-132179Sumatriptan: Rare24Citalopram102Acitretin180Tamoxifen25Clarithromycin103Acyclovir181Tamsulosin26Clopidogrel104Adapalene182Tazarotene27Crizotinib105Allopurinol183Temozolomide28Dabigatran Etexilate106Amphotericin B184Terbinafine29Dexmedetomidine107Arsenic185Thalidomide30Dexrazoxane108Arsenic Trioxide186Thiotepa31Diazoxide109Atovaquone187Vinflunine32Disopyramide110Benzyl Alcohol188Zalcitabine33Docetaxel111Bleomycin Hydrochloride189Ziconotide34Emtricitabine112Busulfan190K77935Ertapenem113Capecitabine191PEP00536Eslicarbazepine Acetate114Ceftazidime192Acetaminophen37Etravirine115Cevimeline193Aliskiren38Everolimus116Chlorhexidine194Betaxolol39FAMP117Propafenone195Lidocaine40Febuxostat118Chlorhexidine Gluconate196Brinzolamide41Fentanyl119Chloroquine197Cabergoline42Fludarabine120Ciclopirox198Cetirizine43Fondaparinux121Clindamycin199Clonazepam44Fosaprepitant Dimeglumine122Clobetasol200Clozapine45Fosfomycin123Clofarabine201Cytokinin46Fosfomycin Trometamol124Cytarabine202Deferiprone47Gadobenate Dimeglumine125Dasatinib203Dihydroergotamine48Gadoversetamide126Delavirdine204Diltiazem49Gemifloxacin127Desonide205Donepezil50Ibuprofen128Dexamethasone Sodium Phosphate206Doxycycline51Iloperidone129Diclofenac207Famciclovir52Imatinib130Docetaxel208Fusidic Acid53Imiquimod131Enoxaparin209Hetastarch54Indinavir132Erlotinib210Imatinib55Lansoprazole133Ertapenem211Iodixanol56Lapatinib134Erythromycin212Iopamidol57Lenalidomide135Esmolol213Ioversol58Lercanidipine136Estramustine214Latanoprost59Leuprorelin Acetate137Estramustine Phosphate215Methsuximide60Levodopa/Carbidopa138Etodolac216Nifedipine61Levonorgestrel139Everolimus217Pimozide62Levosimendan140Furosemide218Risperidone63Meropenem141Flurbiprofen219Salmon Calcitonin Acetate64Meropenem Anhydrous142Quetiapine220Linagliptin65Methylene Blue143Gabapentin221Sertraline66Mitoxantrone144Gemcitabine222Sulfadiazine67Moxifloxacin145Gemifloxacin223Sulfasalazine68N-Carbamylglutamate146Ribavirin224Lomefloxacin69Nelfinavir147Guanfacine225Sunitinib70Nilotinib148Hydroxyurea226Topiramate:71Nitrofurantoin149Icodextrin227Travoprost72Olanzapine150Imatinib228Zolpidem73PCI-32,765151Rifampicin229Memantine74Photofrin II152Rilpivirine230Methyl Aminolevulinate75Refludan153Riluzole231Methylphenidate76Revasc154Risperidone232Metronidazole77Losartan155Ropinirole233Nevirapine78Triptorelin156Rotigotine234Niacin
Phase 3: In-silico analysis
Screening of drug library
PDB was explored to retrieve X-ray crystallographic structures of CDK1. This search yielded 182 structures, among them 181 corresponded to “Homosapiens”. As this study is focused on CDK1 antagonists the PDBs with co-crystallized compounds with agonistic properties were excluded. The PDB-4Y72 that displayed CDK1 bound with inhibitor{[(2,6-difluorophenyl) carbonyl] amino}-N-(4-fluorophenyl)-1 H-pyrazole-3-carboxamide was chosen for the study. The interactive patterns at the binding interface between the co-crystallized inhibitor and CDK1 were retrieved to identify the crucial residues. Residues were selected for receptor grid generation based on the interactive profile. The created drug libraries were then screened for their affinity towards CDK1 binding sites.
Of the 607 X-ray crystallographic structures of CDK2 identified from PDB, 588 were associated with “Homosapiens”; however, agonistic co-crystallized molecules were rejected. Subsequently, PDB- 2FVD, with diaminopyrimidine inhibitor as co-crystallized ligand, was chosen for the investigation. The binding interface between the diaminopyrimidine inhibitor/CDK2 complex was scrutinized to detect key residues, and a receptor grid was created using the interactive profile. The created drug libraries were then screened for their affinity towards the CDK2 binding site.
XP screening of the Dihydroartemisinin drug library yielded 4 molecules with a docking score ranging from − 9.151 to -3.357. Further, these drugs were subjected to MMGBSA and Qikpro analysis. Among these shortlisted drugs, Steviolbioside exhibited better interaction, with no CNS permeability and no violations in Lipinski rule of five, and was further processed for molecular dynamics studies along with Dihydroartemisinin and co-crystallized CDK1 inhibitor (Table 7).
Table 7. Molecular docking parameters, binding energy, and pharmacokinetic properties of the selected drugs pertinent to CDK1 and CDK2.CompoundsTargetsDocking scoreCNSRule of FiveMMGBSA dG Bind(NS)SteviolbiosideCDK1-9.15100-50.096Dihydroartemisinin-4.0900-43.2066ValsartanCDK2-6.63-20-60.31Irbesartan-6.644-20-51.69Losartan-7.601-20-65.93Olmesartan-7.381-20-63.23Fludarabine-7.365-20-46.55Nitrofurantoin-6.652-20-35.7Lisinopril-8.659-20-50.04Furosemide-8.189-20-52.07Etravirine-6.836-20-52.09Enoxaparin-12.536-22-54.24Dobutamine-8.875-20-57.27Allopurinol-6.219-10-26.32Imatinib-10.330-10-61.87Aspirin-6.425-10-24.09Bosutinib-4.91411-30.43
HTVS of the CDK2 library yielded 600 drug molecules with docking scores ranging from − 7.613 to -1.368 and glide energy from − 58.902 to -2.478 kcal/mol. Further screening through SP mode resulted in 472 compounds with docking scores ranging from − 8.9 to -2.25 and glide energy ranging between − 60.73 to -27.59. Then, screening through XP mode yielded 366 compounds with docking scores ranging from − 12.536 to -2.162 and glide energy from − 85.585 to -36.86. Herein, standard drugs such as Bosutinib and Imatinib exhibited a docking score of -4.914 and − 10.330, respectively. The compounds with docking scores more than − 4.914 were shortlisted and subjected to MMGBSA and qikpro analysis. Among these shortlisted drugs, only 105 exhibited no CNS permeability with no violations of Lipinski’s rule of five. Among 105 drugs, 12 drugs that were not explored for their interactions with CDK2 from both Imatinib and Bosutinib libraries along with the standard drugs (Imatinib and Bosutinib) and Diaminopyrimidine (Co-crystallized ligand of CDK2 - PDB- 2FVD) were further processed for molecular dynamics (Table 7).
Molecular dynamics
Post docking, the drugs were shortlisted for molecular dynamics analysis based on the following parameters: (1) drugs that demonstrated no literature support pertaining to their interaction with CDK1 and/or CDK2, (2) drugs that exhibited substantial interactions with binding pockets in terms of low binding free energy, specificity/best fit within the pocket, and (3) the drugs that showcased favorable pharmacokinetic properties such as CNS non-permeability, and compliance with the rule of five. Herein, Steviolbioside, from the Dihydroartemisinin library, abided by the set criteria with respect to CDK1 and hence entered the molecular dynamics phase and was compared to the standard drug. Similarly Dobutamine, Irbesartan, Lisinopril, Losartan, Nitrofurantoin, Olmesartan and Valsartan, belonging to the Bosutinib library; Allopurinol, Fludarabine, Nitrofurantoin, Lisinopril, Losartan, Furosemide, Etravirine, Enoxaparin and belonging to Imatinib library; displayed compliance towards the pick out criteria concerning CDK2 complex and thus were processed for molecular dynamics with their respective standards.
RMSD of Steviolbioside exhibited substantial instability within the CDK1 binding pocket owing to its high RMSD between 3.0 A⁰ to 5.4 A⁰ throughout the simulation, which was much higher than the protein RMSD. It displayed four contacts, and the stability of hydrogen bonds and water bridges with ASP146 remained consistent throughout the simulation; however, the higher RMSD indicated instability of the drug-ligand complex. Hence, Steviolbioside was disqualified for further in vitro studies (Figs. 6, 7, 8 and 9).
Fig. 62D Illustration of protein-ligand complex (A) CDK1-Steviolbioside, (B) CDK2-Allopurinol, (C) CDK2-Etravirine, (D) CDK2-Fludarabine, (E) CDK2-Imatinib, (F) CDK2-Losartan, (G) CDK2-Nitrofurantoin.
Fig. 7. Simulation plot of Root Mean Square Deviation showing protein (red) and ligand (blue). (A) CDK1-Steviolbioside, (B) CDK2-Allopurinol, (C) CDK2-Etravirine, (D) CDK2-Fludarabine, (E) CDK2-Imatinib, (F) CDK2-Losartan (G) CDK2-Nitrofurantoin.
Fig. 8. Simulation plot showing protein RMSF (blue), ligand contact (green), and B factor (red). (A) CDK1-Steviolbioside, (B) CDK2-Allopurinol, (C) CDK2-Etravirine, (D) CDK2-Fludarabine, (E) CDK2-Imatinib, (F) CDK2-Losartan (G) CDK2-Nitrofurantoin.
Fig. 9. Illustration of protein-ligand contact map. (A) CDK1-Steviolbioside, (B) CDK2-Allopurinol, (C) CDK2-Etravirine, (D) CDK2-Fludarabine, (E) CDK2-Imatinib, (F) CDK2-Losartan (G) CDK2-Nitrofurantoin.
Out of the candidates that were shortlisted with respect to CDK2 ligand complex, drugs such as Allopurinol, Etravirine, Fludarabine, Imatinib, Losartan and Nitrofurantoin were observed to exhibit favorable stability within the binding pocket when compared to their respective standard Imatinib. These compounds demonstrated minimal fluctuations in the protein backbone and maintained stable interactions with essential residues, particularly in the 80–89 region of the ATP binding pocket of the CDK2 (Figs. 6, 7, 8 and 9). Post-MM/GBSA analysis was conducted for drugs such as Etravirine(− 57.03 Kcal/mol), Fludarabine(− 44.17.06 Kcal/mol), Losartan (− 56.06 Kcal/mol), Imatinib (− 69.49 Kcal/mol), and Nitrofurantoin (− 41.89 Kcal/mol), demonstrating enhanced dynamic results, which were subsequently prioritized for in-vitro cytotoxic assays.
Phase 3: In-vitro analysis
Cytotoxicity assay
The cytotoxicity of the selected repurposable drugs was assessed in Huh-7 cell lines. Herein, Etravirine and Imatinib demonstrated significant cytotoxicity at 36.41µM/ml and 60.37µM/ml, respectively. Conversely, Allopurinol (164.35 µM/ml), Fludarabine (119.94 µM/ml), and Nitrofurantoin (226.75 µM/ml) exhibited moderate cytotoxicity. Losartan displayed a high IC_50_ value of 326.63 µM/ml, indicating low cytotoxicity (Fig. 10).
Fig. 10. Cytotoxic assay of drugs in Huh7 cell lines.Values are expressed as mean ± SD.
Consequently, based on the significant cytotoxicity compared to other drugs, Etravirine, Fludarabine, and Imatinib were considered for further investigations.
CDK-2 assay
Imatinib, Fludarabine, and Etravirine demonstrated substantial cellular CDK2 inhibition at their respective IC_50_ concentrations. Imatinib inhibited CDK2 more effectively than Fludarabine and Etravirine; however, Etravirine showed inhibition analogous to Imatinib as compared to Fludarabine. Nevertheless, further studies were performed for deeper comprehension of the molecular processes underlying these compounds’ anti-cancer efficacy (Fig. 11).
Fig. 11CDK2 inhibitory activity of Etravirine, Fludarabine, and Imatinib in Huh-7 cells. Values are expressed as mean ± SD (n = 3). ap < 0.001 and bp < 0.01 Vs standard Imatinib; *p < 0.001 significant Vs untreated group. Data was analyzed by one-way ANOVA followed by Tukey-Kramer multiple comparison test.
CDK2 and CCNA2 expression analysis
The untreated Huh7 cells showed a relative Log Fold Change (Log FC) value of 1 for the expression of CDK2 and CCNA2. Upon treatment with IC_50_ concentration of selected drugs, there was an overall significant decrease in the expression of both CDK2 and CCNA2. Imatinib, significantly decreased the relative Log FC value of CDK2 and CCNA2 to 0.056 ± 0.01 and 0.07 ± 0.02, respectively. Fludarabine treatment resulted in reduced expression of CDK2 and CCNA2, with a Log FC value of 0.33 ± 0.11 and 0.40 ± 0.08, respectively. Etravirine treatment substantially decreased CDK2 and CCNA2 expression, with a Log FC value of 0.12 ± 0.07 and 0.21 ± 0.14, respectively (Figs. 12 and 13).
Fig. 12. Effect of Imatinib, Fludarabine, and Etravirine on CDK2. Values are expressed as mean ± SD (n = 3). ^a^p<0.001 and ^b^p<0.01 Vs standard Imatinib; *p < 0.001 Vs untreated group. Data was analyzed using one-way ANOVA followed by a Tukey-Kramer multiple comparison test.
Fig. 13. Effect of Etravirine, Fludarabine, and Imatinib on CCNA2. Values are expressed as mean ± SD (n = 3). ^a^p<0.001 and ^b^p<0.01 Vs standard Imatinib; *p < 0.001 Vs untreated group. Data was analyzed using one-way ANOVA followed by a Tukey-Kramer multiple comparison test.
Imatinib showed a noteworthy decrease in the Log FC values of CCNA2 and CDK2, indicating a substantial downregulation of these critical cell cycle regulators. Similarly, Fludarabine and Etravirine treatment, also resulted in decreased expression of CDK2 and CCNA2. These findings emphasized the need for a comprehensive understanding of the cellular responses induced by Imatinib and Etravirine, particularly in modulating the cell cycle dynamics.
Cell cycle analysis
The impact of Etravirine and Imatinib in different phases of cell cycle in Huh-7 cells was analyzed by flow cytometry. At their respective IC50 concentrations, Imatinib and Etravirine-treated cell lines showed cell cycle arrest in 1.06%, and 13.04% of cells in the Sub G0/G1 phase associated with apoptosis when compared to 1.38% observed in untreated. The apoptotic rates in the G0/G1 phase (the growth phase) of cells treated with Imatinib and Etravirine were 41% and 40.66%, respectively, compared to 68.51% in the untreated group. In the S phase (synthetic phase), 16.21% and 7.17% of cells were arrested in the Imatinib and Etravirine-treated groups, respectively, in contrast to 1.76% in the untreated group. In the G2/M phase, 28.35%, 41.73%, and 39.13% of cells were halted in the untreated, Imatinib-treated, and Etravirine-treated groups, respectively (Fig. 14).
Fig. 14. Percentage cell distributed in the different phases of Huh-7 cell cycle upon treatment with Imatinib and Etravirine in comparison to the control (Untreated). Values are expressed as mean ± SD (n = 3). **p < 0.01, ***p < 0.05, #non-significant Vs untreated group. Data was analyzed by one-way ANOVA followed by Tukey-Kramer multiple comparison test.
Discussion
Drug repositioning, a strategy that unveils the repurposing potential of FDA-approved drugs for a new indication, has drawn the interest of pharmaceutical companies and medical investigators, as the denovo drug discovery pipeline often encounters inevitable challenges in terms of high attrition rates alongside modest efficacy and untoward toxicity profile. As the safety profile of the drugs mostly chosen for repurposing is well established, this approach might be a panacea for conditions, especially with potentially fatal consequences, and the existing approved therapeutic agents are extremely toxic. Malignancy disorder is one such condition with unmet medical needs, particularly in the case of cancers with high mortality rates, such as HCC and pancreatic cancer. The invasive nature of the illness and the lack of an effective, individualized treatment strategy demand a heightened focus on the discovery of new drugs or drug combinations with tolerable safety profiles to confront HCC.
It is paramount to comprehend the intricate pathogenic mechanisms that contribute to tumor heterogeneity in order to appraise the pace of cancer progression. Although there are a plethora of research reports on the etiological mediators and cellular-level molecular aberrations in HCC, the role of crucial genes that are differentially expressed and their respective protein interactions with other established key proteins of the pathological cascades of the tumour milieu is however unclear. Hence, a substantial dearth of target-guided drug discovery results in inadequate therapeutic strategies with trivial translational potential.
This study aimed to unlock the repurposable potential of FDA-approved drugs against disease- specific genetic targets governing the pathological pathways of HCC. Herein, transcriptomics microarray datasets were explored to capture the precise genetic landscape that crucially partakes the developmental stages of HCC as a strategy to unveil the potential targets for drug repurposing. At the outset, the DEGs that contribute to the significant progression of HCC were discerned from microarray data comprising normal vs. cirrhosis and cirrhosis vs. HCC by leveraging appropriate bioinformatics tools. Subsequently, the PPI network was constructed using STRING to elucidate the interactive potential of the proteins that are coded by the shortlisted HCC-specific DEGs, along with their intricate molecular mechanisms. The application of the MCODE algorithm at this juncture aided in grouping 86 highly interconnected proteins into 12 clusters. Notably, among 37 proteins in cluster 1, CCNA2, upregulated in HCC, showed the highest interaction with other co- expressed proteins and hence was considered the potential cross-talk gene.
CCNA2, a cell cycle regulator, activates CDK1/CDK2 by forming a functional heterodimeric complex, which is crucial for triggering the cell cycle progression. Overexpression of CCNA2, along with CDK1 and CDK2, is seen in a number of malignancies, including HCC. This finding was confirmed by mRNA expression analysis in GEPIA2, which showed a strong positive correlation of CCNA2 with CDK1 (P value = 1.5e-14) as well as CDK2 (8.9e-16) in HCC. Moreover, CCNA2, CDK1, and CDK2 mRNA expression were significantly higher in HCC than in normal hepatic tissues. Similar to the GO of CCNA2, other high node degree proteins in cluster 1, such as AURKA, AURKB, CCNB1, CDC25, CENPF, FOXM1, and SKP2, were involved in the G2/M transition of the mitotic cell cycle which is on par with KEGG pathway result from Clue Go^11–13^. Dysregulation of these genes promotes tumor growth and metastasis. Furthermore, DEGs (cluster 1) such as AURKB, CCNB1, CDC20, CENPF, NUF2, PBK, TPR, TRIP13, and ZWINT were also involved in cell cycle checkpoint signaling.
Generally, during irreparable DNA damage, the aforementioned checkpoint signal regulators hamper the cell cycle progression, resulting in apoptosis. Cancer-related mutations that manipulate the cell cycle regulators result in unabated cell division, largely by reducing the ability of aberrantly regulated cells to exit the cell cycle. Additionally, Clue Go analysis revealed that CCNA2 and its co-expressed DEGs significantly enriched the P53 signaling pathway, cell cycle, and chemokine signaling pathway. CCNA2 mediates its action by interacting with CDK1 and CDK2; hence, these kinases were chosen as the HCC targets.
A drug library was created to collate the inhibitors that may hinder the complex formation of the kinases with CCNA2, thereby inducing cell cycle arrest. Since both the targets lacked approved standard inhibitors, the drug repository was established by a thorough literature mining to capture literature-derived inhibitors for CDK1 and CDK2. This exposed the tumor-suppressing properties of Dihydroartemisinin by its interaction with CDK1 and was considered standard for creating drug library^14^. Similarly, Imatinib and Bosutinib emerged as notable antagonists of CDK2 and consequently underwent systematic inclusion in the construction of drug repositories for CDK2. Further, based on the concept that drugs with structural and side effect similarities might exhibit action by sharing common therapeutic targets, the drug libraries were created for the above standards. Following this, the drugs from the libraries were screened against their respective targets via molecular docking tailed by molecular dynamics studies.
The molecular docking studies of the Dihydroartemisinin library revealed only Steviolbioside to be a potential drug candidate against CDK1 based on its interaction with the ATP binding pocket, which is comparable with the interactions of ATP-competitive inhibitors. This binding pocket is characterized by a “DFG” motif containing ASP146, which plays a critical role in facilitating phosphorylation reactions by binding with ATP. Even though Steviolbioside showed a substantial interaction with the ASP146 residue, molecular dynamics analysis for this ligand was not promising, as its RMSD with CDK1 displayed a higher degree of fluctuation, indicating the instability of ligand-protein complex.
Similarly, docking results showed that 15 drugs from Imatinib and Bosutinib libraries interacted with CDK2 residues comparable to those of ATP-competitive inhibitors by acting on amino acid residues near the ATP binding site. The interactions in the hinge region (composed of residues 80–84) that link the N- and C-terminal lobes of CDK2 are an integral part of the ATP adenine binding site^15^. Herein, drugs such as Etravirine, Fludarabine, Nitrofurantoin, Irbesartan, Valsartan, Lisinopril, and Allopurinol exhibited interaction with residues 80–84. Also, Furosemide, Enoxaparin, Dobutamine, Nitrofurantoin, Lisinopril, Allopurinol, and Imatinib interacted with ASP 145 in the “DFG motif,” which plays a vital role in kinase activity. Moreover, Etravirine, Enoxaparin, and Valsartan also interacted with ASP86, a critical ATP binding pocket residue, whose mutation may impact ATP binding and, therefore, interfere with CDK2 activity^16^.
A comprehensive molecular dynamics study was performed for a set of 16 drugs. Among these, one drug was sourced from the Dihydroartemisinin library, while the remaining fifteen were depicted from the Imatinib and Bosutinib libraries. Drugs from Imatinib library, such as Losartan, Etravirine, Fludarabine, Nitrofurantoin, Allopurinol, and Imatinib, exhibited better interaction with CDK2 without protein backbone distortion. As a crucial step in bridging computational predictions with biological responses, these drugs were further subjected to the in vitro validation phase in Huh-7 cell lines.
Research indicates that CDK2 plays a pivotal role in regulating the proliferation of adult hepatocytes in response to acute mitogenic signals. Furthermore, CDK2 is crucial for cyclin D1-mediated centrosome overduplication, which impacts to chromosomal instability and supports tumor progression^17^. Additionally, studies have shown that the concurrent overexpression of cyclin E and CDK2 in HCC is associated with enhanced proliferative activity in cancerous hepatocytes^18^. These findings collectively reinforce the potential of CDK2 as a promising therapeutic target for HCC.
Initially, the MTT assay assessed the cytotoxic potential of the shortlisted drugs. Nitrofurantoin, Fludarabine, and Allopurinol at a concentration of 12.5 µM/ml demonstrated cytotoxicity in the Huh-7 cell line comparable to the standard Imatinib. Similarly, at a concentration of 100 µM/ml, there was no distinguished variation in the cytotoxic impact of Etravirine and Imatinib. Etravirine and Fludarabine, which showed significant cytotoxicity in low IC_50_ value, were shortlisted for further studies.
The results of the CDK2 assay revealed a well-pronounced inhibitory potential of Imatinib, and Etravirine when compared to Fludarabine in the Huh-7 cell lines. The expression analysis of CDK2 and CCNA2, and the subsequent cell cycle analysis, threw light on the molecular mechanisms underlying the effects of Imatinib, Fludarabine, and Etravirine on Huh-7 cells.
Further, the untreated Huh-7 cells served as a baseline with a relative Log Fold Change (Log FC) value of 1 for the expression of CDK2 and CCNA2. The treatment with selected drugs based on the IC_50_ led to a significant overall decrease in the expression of both CDK2 and CCNA2. Imatinib at 60.4 µM/ml showed a noteworthy decrease in the Log FC values of CCNA2 and CDK2, indicating a substantial downregulation of these important cell cycle regulators. Similarly, Fludarabine and Etravirine at 120 µM/ml and 36.5 µM/ml, respectively, also resulted in decreased expression of CDK2 and CCNA2. These findings emphasized the need for a comprehensive understanding of the cellular responses induced by Etravirine, particularly in modulating the cell cycle dynamics.
Flow cytometry analysis revealed the effects of Etravirine on distinct stages of the Huh-7 cell cycle. Etravirine at its IC_50_ concentration caused a substantial cell cycle arrest of 13.04% in the Sub G0/G1 phase compared to the untreated group, which exhibited a lower proportion of cellular arrest of 1.38%. In the S phase, Imatinib and Etravirine treatment resulted in a distinguished upsurge in the percentage of apoptosis to 16.21% and 7.17%, respectively, compared to 1.76% in the untreated group suggesting the drugs’ potential to interrupt DNA synthesis. In the G2/M phase associated with mitosis, Imatinib-treated cells exhibited a 41.73% arrest, while Etravirine-treated cells showed a 39.13% arrest. The altered expression levels of target genes and significant perturbation in the finely orchestrated mechanisms governing cell division elucidated the anticancer potential of Imatinib and Etravirine.
Consistent with our findings, Xiao et al. demonstrated the anticancer potential of Imatinib against HCC^19^. Online with our results, Etravirine, a non-nucleoside reverse transcriptase inhibitor primarily indicated for HIV treatment in adults and children, is spotlighted as a possible therapeutic agent against ovarian cancer^20^. Epidemiologic data available indicates a seven-fold rise in the prevalence of HCC in HIV-positive patients with hepatitis compared to HIV-negative controls. Additionally, the risk of HCC is significantly associated with viral infections such as HBV and HCV that result in cirrhosis^21,22^. Thus, Etravirine, identified in the current study, may emerge as a promising candidate as it is proven to influence the various checkpoints of the cell cycle by inhibiting cell cycle regulators, with an additional benefit of established antiviral activity, especially in HCC patients with viral infections. While these findings are encouraging, the transition to clinical applications requires rigorous investigation to ensure Etravitine’s efficacy in a more complex biological system.
Conclusion
This study captured the significant role played by CCNA2 and CDK2 in the HCC cascade. The evidence derived from this study firmly supports the anticancer potential of Etravirine in HCC based on its influence on cell cycle regulation and apoptosis pathways. Further preclinical and clinical research is warranted to confirm our findings, particularly in patients with viral co- infections.
Methodology
Phase 1: Identification of potential targets for HCC and pathway analysis
Omics-based differential gene expression analysis
Gene Expression Omnibus (GEO) database was exploited to retrieve suitable microarray datasets containing differential gene expression data of normal, cirrhosis, and HCC samples with filtering criteria of FDR p-value < 0.05 and log FC > 1. Based on the fixed criteria, GSE25097^23^, GSE6764^24^, GSE98620 (GP14951)^25^ and GSE14323^26^ were selected. The significant overlapping Differentially Expressed Genes (DEGs) between normal vs. cirrhosis and cirrhosis vs. HCC among the four datasets were compiled.
Protein-protein interactions and gene set enrichment analysis
These overlapping significant genes of HCC were fed in the Search Tool for the Retrieval of Interacting Genes/Proteins (STRING) database to identify the PPI interactions, which were further visualized using Cytoscape with proteins as nodes and interactions as edges. The Molecular Complex Detection (MCODE) in the Cytoscape plugin was used to identify the intersecting clusters from the obtained PPI network. Amongst the cross-talk genes, the genes that displayed the highest node degree were predicted as hub genes. Clue Go, a Cytoscape tool, was used to map the shortlisted proteins with physiological and pathological pathways based on Gene Ontology (GO) and KEGG.
Validation of hub genes
The significance of these hub genes was validated based on their impact on survival analysis. Patient survival analysis and correlation analysis employ pearson correlation statistics to validate the hub genes by using GEPIA2, a web server for integrating RNA sequencing data from The Cancer Genome Atlas (TCGA) and the Genotype-Tissue Expression (GTEx) project. Subsequently, a target-guided drug library was constructed for the substantial targets associated with poor survival.
Phase 2: Construction of drug library
A thorough literature search was performed to collate the FDA-approved drugs acting on shortlisted targets. A drug library was created with drugs exhibiting structural and side effect similarities with those of the standard or literature-derived drugs. Herein, the Drug Bank^27^, ChEMBEL^28^, and PubChem databases^29^ were mined to retrieve the drugs with structural similarity based on their Tanimoto index with a cut-off value of 0.5 and 50 percent similarity. Drugs with side effect similarities were captured from LINCS^30^ and SIDER^31,32^ considering the labeled side effects of standard or literature-derived drugs.
Phase 3: In-silico analysis
Screening of drug library against targets
The x-ray crystallographic structure of the target proteins was retrieved from the Protein Data Bank (PDB). The drugs from the drug library were considered as the ligands and screened against the shortlisted targets via molecular docking (Schrodinger drug-design suite). Initially, the drug libraries were subjected to a High Throughput Virtual Screening (HTVS) and then docked in Standard Precision (SP) and Extra Precision (XP) mode. The drug-target complexes were shortlisted based on the interactive patterns exhibited by the drugs within the binding pockets of the targets and the binding free energy calculated by MM-GBSA analysis.
Molecular dynamics
The drugs with high docking scores, better interactions, and binding free energy were further subjected to molecular dynamics via Desmond [Schrödinger Release 2021-2: Desmond Molecular Dynamics System, D. E. Shaw Research, New York, NY, 2021]. A TIP3P solvent model under normal pressure (1 bar) and temperature (300k) ensemble was prepared to develop the molecular dynamics system. The stability of the drug-target complex for 100ns is described in terms of Root- Mean Square Deviation (RMSD), Root-Mean Square Fluctuation (RMSF), and Radius of Gyration (rGyr). The drugs that showed better stability were further investigated by in vitro assays.
Phase 4: In-vitro analysis
Cell line and cell culture
The Huh-7 cell lines were procured from the National Centre for Cell Science (NCCS), Pune, India, and cultured in Dulbecco’s Modified Eagle’s Medium (DMEM) (Cat No: AL111, Himedia) supplemented with 10% Fetal Bovine serum (FBS) and 1% antibiotic-antimycotic solution and incubated at 37°C with an atmosphere of 5% CO2 and 18-20% O2. The cells were maintained through sub-culturing, and those in the exponential growth phase were used for the cytotoxicity assay.
Cytotoxicity assay
Cell suspension of 100μl was seeded onto 96-well plates and various concentrations of repurposable drugs, such as 12.5, 25, 50, 100, and 200 μM/ml, were added, and the cells were incubated for 24 hours at 37°C with 5% CO2. Then, 3-[4,5-dimethylthiazol-2-yl]-2,5 diphenyl tetrazolium bromide (MTT) reagents were added to the whole volume at a final concentration of 0.5mg/mL and re-incubated for 3hours. The absorbance was measured by using a spectrophotometer reader at a wavelength of 570 nm^33^. The drugs that showed substantial cytotoxicity were selected for further studies.
CDK2 inhibitory assay
Enzyme-Linked Immunosorbent Assays (ELISA) assay is used to identify the activity of the protein in the presence of shortlisted repurposable drugs. After treatment with IC50 concentration of drugs, the cells were harvested and centrifuged at 2000 rpm. Subsequently, 100μl of biotin-labeled antibody working solution, 100μl of streptavidin-biotin complex (SABC) solution, and 90μl of TMB substrate were added to the supernatant of lysed cells. Read the absorbance at 450nm in a microplate reader^34^.
Gene expression analysis
The effect of repurposable drugs on the expression of CCNA2 and CDK2 (the shortlisted target from this study) was measured using Reverse transcription polymerase chain reaction (rt-PCR). Cells were cultured in a 6-well plate at a density of 0.5 x 10⁶ cells/ml and were incubated for 24hrs. Then, the cells were exposed to repurposable drugs at their IC50 concentrations, and total RNA was isolated (2μg), then reverse-transcribed to complementary DNA (cDNA) with the IScript cDNA synthesis kit (Cat No.1708890, Bio-Rad, Canada) as per the manufacturer's instruction. The rt-PCR (Quanta Studio3 system, Cat No.272322821, Thermo Fisher Scientific) was carried out in triplicate by using the reaction mixtures comprising 1µL cDNA, 12.5µL SYBR Green Master Mix (2X) (Sensifast SYBR HiRoxkit, Bioline, USA),1µL of each forward and reverse primer (10µM), and 9.5µL of nuclease-free water. Primers used for the study were self-designed using the Primer blast Program developed by NCBI and procured from Eurofins Genomics, Bangalore.
Cell Cycle Analysis
Cells were treated with repurposable drugs at IC50 concentrations and incubated for 24 hours. Cells were collected by trypsinization and fixed with 70% ethanol. Subsequently the cell pellets were rinsed and resuspended with PBS containing 50μg/ml of propidium iodide in the presence of 100 μg/ml RNase. The distribution of cells in different phases of the cell cycle was determined using a Flow Cytometer (BD FACS Calibur, BD Biosciences, USA)^35^.
The reference list from the paper itself. Each links out to its DOI / PubMed record.
- 1Weiss, A. et al. Targeting cyclin-dependent kinases for the treatment of pulmonary arterial hypertension. Nat. Commun.10(1), 2204 (2019).10.1038/s 41467-019-10135-x PMC 652520231101827 · doi ↗ · pubmed ↗
- 2Ly, T. T. G. et al. Inhibitory effect of Etravirine, a Non-nucleoside Reverse transcriptase inhibitor, via Anterior gradient protein 2 Homolog degradation against Ovarian Cancer Metastasis. Int. J. Mol. Sci. ;23(2). (2022).10.3390/ijms 23020944 PMC 877793935055132 · doi ↗ · pubmed ↗
- 3Pubchem Substance and Compound Databases. Nucleic. Acids Res.44(D 1), D 1202–13 (2016).10.1093/nar/gkv 951PMC 470294026400175 · doi ↗ · pubmed ↗