Correction: Ibrutinib, a Bruton’s tyrosine kinase inhibitor, exhibits antitumoral activity and induces autophagy in glioblastoma
Jin Wang, Xiaoyang Liu, Yongzhi Hong, Songtao Wang, Pin Chen, Aihua Gu, Xiaoyuan Guo, Peng Zhao

Abstract
Genes, proteins, chemicals, diseases, species, mutations and cell lines named across the full text — each resolved to its canonical identifier and authoritative record.
Click any figure to enlarge with its caption.
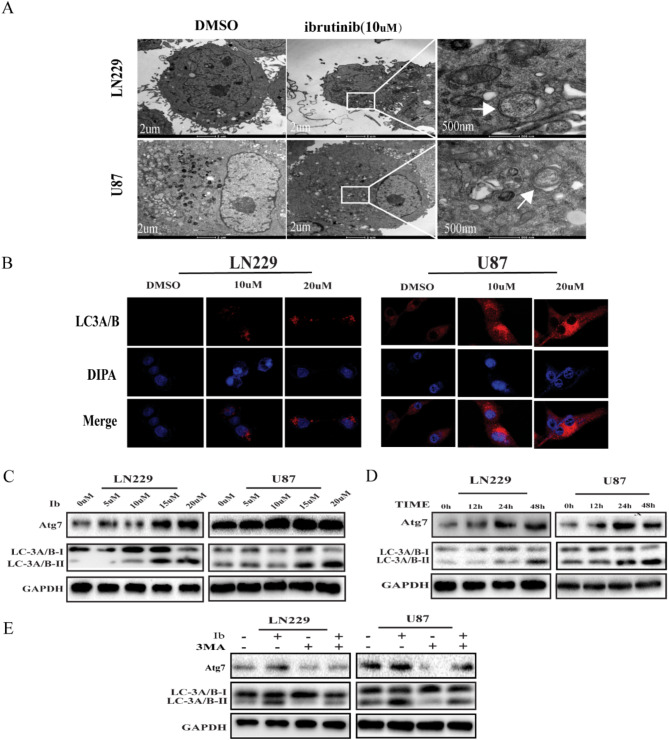 Figure 1
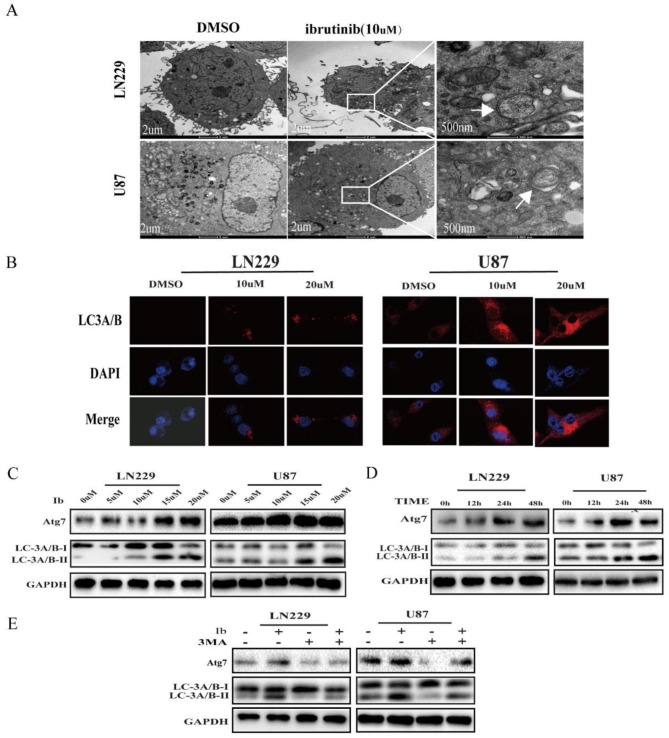 Figure 2
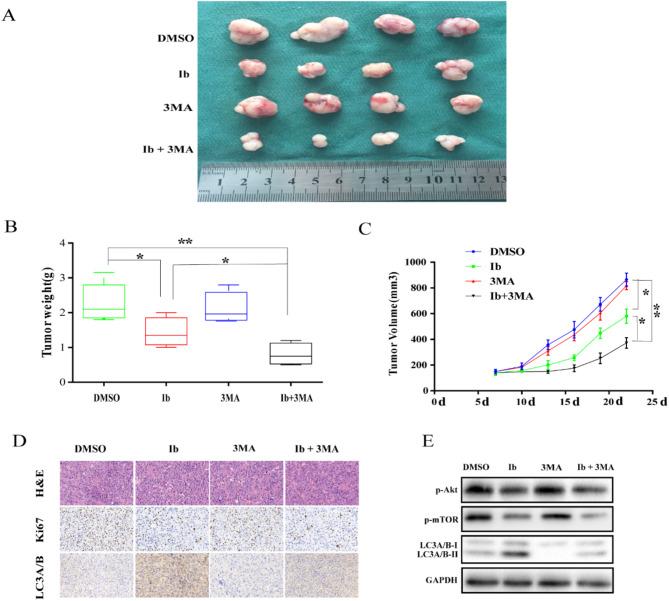 Figure 3
 Figure 4
Peer Reviews
No public reviews on file for this paper yet. If you reviewed it on a platform where reviews are public (OpenReview, ICLR, NeurIPS, ICML), you can paste yours below so the community can read it here.
Videos
No videos yet. Explain this paper in a talk, walkthrough, or lecture? Add one.
Taxonomy
TopicsChronic Lymphocytic Leukemia Research · Galectins and Cancer Biology · Phagocytosis and Immune Regulation
Correction: J Exp Clin Cancer Res 36, 96 (2017)
10.1186/s13046-017-0549-6
Following the publication of the original article [1], the authors identified errors in the images of Figs. 3 and 6, specifically:
- Figure 3b: The nuclear dye should be labeled as DAPI, not DIPA.
- Figure 3b: The positions of the DAPI images for the DMSO group and the 10 µM group have been swapped, and the merged image for the DMSO group is incorrect.
- Figure 6d: The Ki67 IHC image used for the Ib group is incorrect.
The corrected figures are provided below:
The corrections do not affect the overall results, discussion, or conclusion of the article.
Incorrect Fig. 3
Fig. 3. Ibrutinib induces autophagy in GBM cells. (a) TEM revealed autophagosome ultrastructures in the enlarged images (arrows) after a 24-h treatment with 10 µM ibrutinib. (b) Representative images of immunocytochemistry. Red fluorescence indicates the presence of LC-3 protein. (c, d) GBM cells were incubated with different concentrations of ibrutinib for 24 h (c) or with 10 µM ibrutinib for various times (d), and LC3A/B-II, Atg7, and GAPDH levels were assessed by immunoblotting. (e) LC3A/B and Atg7 levels examined by western blot analysis in LN229 and U87 cells after treatment with ibrutinib (10 µM) or DMSO, in the absence or presence of 3MA (2 nM)
Correct Fig. 3
Fig. 3. Ibrutinib induces autophagy in GBM cells. (a) TEM revealed autophagosome ultrastructures in the enlarged images (arrows) after a 24-h treatment with 10 µM ibrutinib. (b) Representative images of immunocytochemistry. Red fluorescence indicates the presence of LC-3 protein. (c, d) GBM cells were incubated with different concentrations of ibrutinib for 24 h (c) or with 10 µM ibrutinib for various times (d), and LC3A/B-II, Atg7, and GAPDH levels were assessed by immunoblotting. (e) LC3A/B and Atg7 levels examined by western blot analysis in LN229 and U87 cells after treatment with ibrutinib (10 µM) or DMSO, in the absence or presence of 3MA (2 nM)
Incorrect Fig. 6
Fig. 63MA treatment enhances antitumor efficacy of ibrutinib in U87 xenograft model. Mice were sacrificed 22 days after the indicated treatments.The tumors were isolated (a), and tumor weight (c) and volume (d) were measured; *p < 0.05, **p < 0.01. (e) Analysis of tumors from each group by H&E staining and immunohistochemical detection of LC3A/B and Ki67. (f) Western blot analysis of p-Akt, p-mTOR, mTOR, LC3A/B, and GAPDH levels in isolated tumors
Correct Fig. 6
Fig. 63MA treatment enhances antitumor efficacy of ibrutinib in U87 xenograft model. Mice were sacrificed 22 days after the indicated treatments.The tumors were isolated (a), and tumor weight (c) and volume (d) were measured; *p < 0.05, **p < 0.01. (e) Analysis of tumors from each group by H&E staining and immunohistochemical detection of LC3A/B and Ki67. (f) Western blot analysis of p-Akt, p-mTOR, mTOR, LC3A/B, and GAPDH levels in isolated tumors