Medicaid and Medicare Utilization of Direct-Acting Antiviral Medications for Patients With Hepatitis C
Xiaohan Ying, Alexander Zhao, Nicole Ng, Russell Rosenblatt, Catherine Lucero, Arun B. Jesudian

Abstract
Genes, proteins, chemicals, diseases, species, mutations and cell lines named across the full text — each resolved to its canonical identifier and authoritative record.
Click any figure to enlarge with its caption.
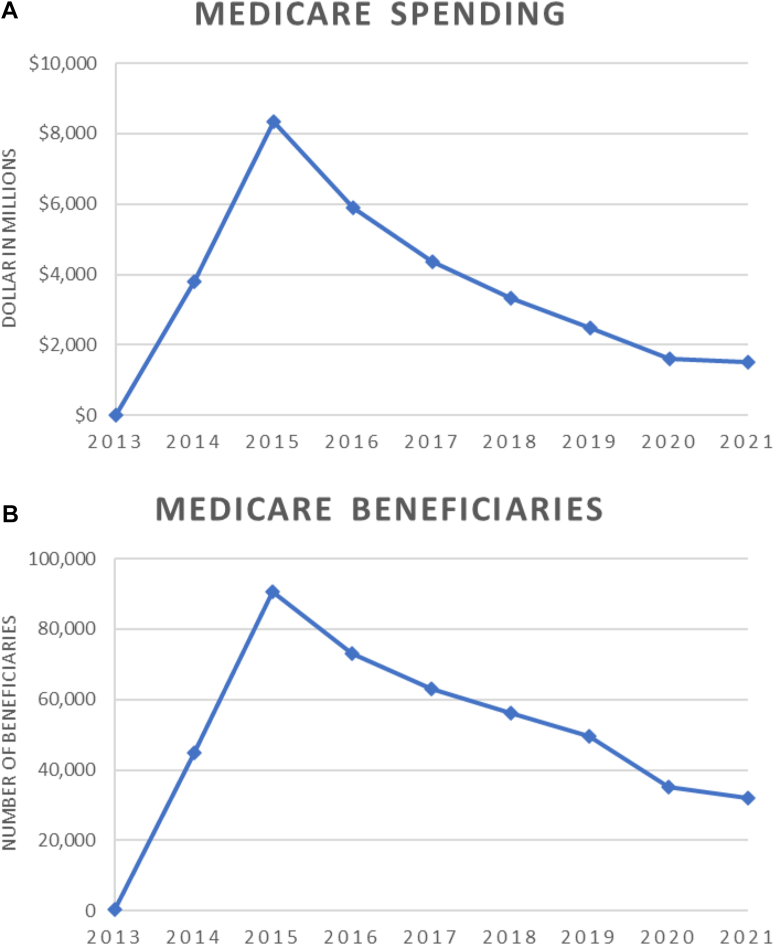 Figure 1
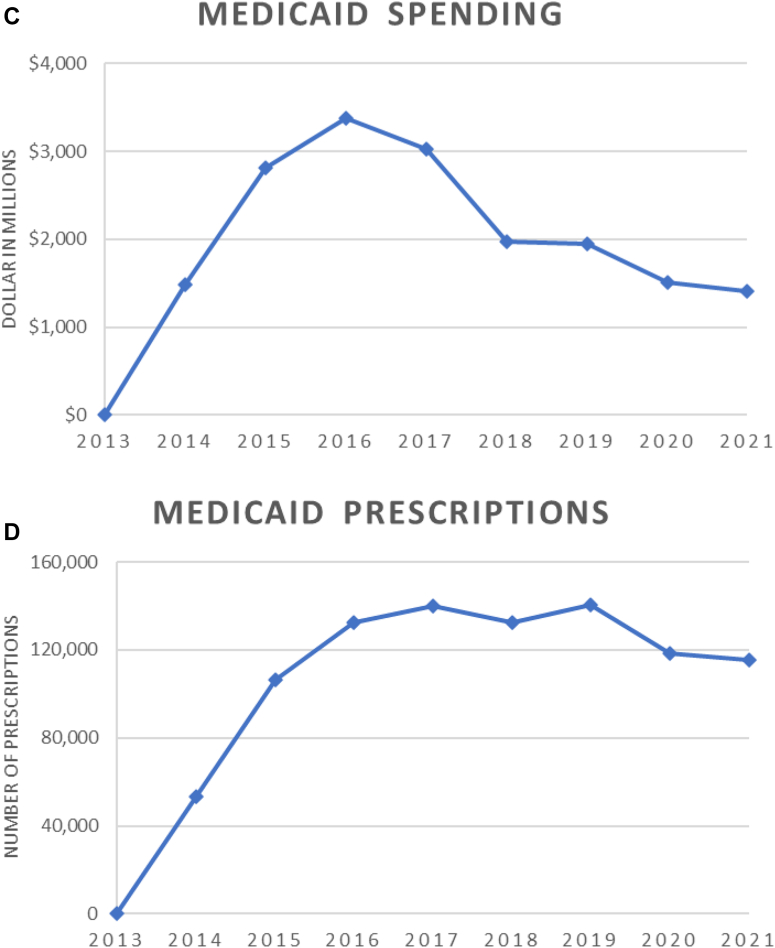 Figure 2
Peer Reviews
No public reviews on file for this paper yet. If you reviewed it on a platform where reviews are public (OpenReview, ICLR, NeurIPS, ICML), you can paste yours below so the community can read it here.
Videos
No videos yet. Explain this paper in a talk, walkthrough, or lecture? Add one.
Taxonomy
TopicsHepatitis C virus research · Liver Disease Diagnosis and Treatment · Hepatitis B Virus Studies
Hepatitis C virus (HCV) infection is among the leading causes of liver disease and mortality, with over 2 million people in the United States currently infected.1 The approval of direct-acting antivirals (DAAs) has revolutionized its treatment, with estimated cure rates of 97%–99% combined with a superior safety profile compared to previous treatments.2^,^3
However, adoption of DAA therapy for HCV has been limited by cost, as much as $84,000 for a full treatment.4 This has therefore impaired access to HCV treatment for many infected individuals and caused significant economic strain on the US health-care system.5^,^6 In 2019, generic versions of sofosbuvir-velpatasvir (Epclusa) and ledipasvir-sofosbuvir (Harvoni) were approved by the Food and Drug Administration. In this study, we aim to analyze Medicaid and Medicare Part D utilization and spending on oral HCV medications, and to estimate cost savings associated with the approval of generic DAAs.
In this cross-sectional study, we used publicly available Medicaid and Medicare Part D databases7^,^8 (2013–2021) to determine the number of 30-day prescriptions and annual spending on DAAs for HCV. Cost per prescription was calculated by dividing annual spending on a specific DAA by the number of 30-day prescriptions. Microsoft Excel (Microsoft, Version 2023) was used for data analysis. JoinPoint Regression Program (version 4.9.1.0; National Cancer Institute, Bethesda, MD) was used for annual percent change (APC) and trends analysis. Cost savings were estimated by multiplying per-prescription savings by the number of 30-day fills for each generic medication.
Eight medications were included in our study: Solvaldi, Harvoni, Epclusa, Zepatir, Mavyret, Vosevi, generic ledipasvir-sofosbuvir, and generic sofosbuvir-velpatasvir. Estimated per-day pricing as well as average wholesale price using UpToDate are included in Table A1.
Between 2013 and 2021, total Medicare spending on DAAs was 17.5 billion was spent on Harvoni (55.9%), followed by Sovaldi (17.9%) and Epclusa (16.1%). In 2021 alone however, Epclusa accounted for 62% of total spending, followed by Mavyret (17.2%) and Harvoni (9.5%). Annual spending increased dramatically between 2013 and 2015, followed by steady decline in the ensuing years (2013–2015: APC 1,789, 95% confidence interval [CI]: 1258–2492, P < .001; 2015–2021: APC −32.4, 95% CI: −36 to −29, P < .001). Figure A.FigureTrends in medicare and medicaid spending and utilization on DAA medications, 2013–2021. (A) Medicare spending on DAA medications. (B) Medicare beneficiaries receiving DAA medications. (C) Medicaid spending on DAA medications. (D) Medicaid prescriptions of DAA medications.
Over the same time period, ∼1.2 million total prescriptions accounting for almost 450,000 Medicare beneficiaries were covered by Medicare; with ∼200,000 people (47.1%) receiving Harvoni, 77,000 (17.4%) receiving Epclusa, and 61,000 (13.8%) receiving Sovaldi. In 2021, 44.5% of patients took Epclusa, followed by Mavyret (30.6%) and generic sofosbuvir-velpatasvir (14.8%). Similar trends were observed in terms of number of beneficiaries receiving DAAs (2013–2015: APC 1,033, 95% CI: 763–1387, P < .001; 2015–2021: APC −21.9, 95% CI: −25.4 to −18.2, P < .001). Figure B.
Between 2013 and 2021, Medicaid spent 6.1 billion was on Harvoni (33.2%), followed by Mavyret (22.2%) and Epclusa (16.5%). Additionally, 336,000 prescriptions (31.9%) were of Mavyret, followed by Harvoni (21.2%) and generic sofosbuvir-velpatasvir (16.5%). In 2021, 48.5% of the spending was on Mavyret covering 44.3% of total prescriptions, and 28.5% of spending was on generic sofosbuvir-velpatasvir covering 43.0% of total prescriptions. Similar trends were observed for total spending and number of prescriptions when compared to Medicare. Figure C and D.
Generic versions of Harvoni (ledipasvir-sofosbuvir) and Epclusa (sofosbuvir-velpatasvir) were both approved by the Food and Drug Administration in 2019. Between 2019 and 2021, generic ledipasvir-sofosbuvir accounted for 5% and 18% of Medicare and Medicaid spending on all ledipasvir-sofosbuvir equivalent (Harvoni, generic), respectively, and covered 12.2% of Medicare prescriptions and 35.4% of Medicaid prescriptions (Table).TableMedicare and Medicaid Spending/Utilization of Direct-Acting Antiviral Medications for HCV, 2013–2021MedicareSpending (-7029255174514314131821132--9401015937--749058--71539260--51971---2614---5095148347436624741510 in millions)201320142015201620172018201920202021TotalHarvoni (ledipasvir-sofosbuvir)95221131642622635.5%Sovaldi (sofosbuvir)138660132265415.1%Epclusa (sofosbuvir-velpatasvir)-342491389295716.8%Vosevi (sofosbuvir-velpatasvir-voxilaprevir)--70542601.5%Mavyret (Glecaprevir-Pibrentasvir)--1026652346319.7%Zepatier (Grazoprevir)-22273910165.8%Ledipasvir-sofosbuvir---13380.2%Sofosbuvir-velpatasvir---3499365.3%Total148133751978151017,548100.0%Total prescriptions201320142015201620172018201920202021TotalHarvoni (ledipasvir-sofosbuvir)303979,85980,34044,35211,28341421396874225,28523.6%Sovaldi (sofosbuvir)14450,37727,22325,1691493133747367104,75311.0%Epclusa (sofosbuvir-velpatasvir)15,16142,96723,65624,95517,10711,437135,28314.2%Vosevi (sofosbuvir-velpatasvir-voxilaprevir)1054347026332337217711,6711.2%Mavyret (glecaprevir-pibrentasvir)973890,59681,44051,54951,500284,82329.9%Zepatier (grazoprevir)14,36341,992447318312123118765,9696.9%Ledipasvir-sofosbuvir10711140107332840.3%Sofosbuvir-velpatasvir27,11245,54450,115122,77112.9%Total14453,416107,082135,033141,596133,611143,258121,269118,430953,839100.0%
Similarly, generic sofosbuvir-velpatasvir accounted for 8.2% and 44.4% of Medicare and Medicaid spending on all sofosbuvir-velpatasvir equivalent (Epclusa, generic), respectively, and covered 22.2% of Medicare prescriptions and 69.9% of Medicaid prescriptions.
The introduction of generic medications is estimated to have saved Medicare ∼1.5 billion. Lastly, we estimate that if Medicare were to only utilize generic medications, it could save an additional $1.5 billion over the course of 3 years.
Since the approval of the first DAAs in 2013, Medicare and Medicaid have spent almost $50 billion on HCV medications. Despite their considerable upfront cost, DAA therapies remain cost effective by reducing mortality and morbidity attributed to advanced liver disease.7 However, studies have found that patients often do not receive timely HCV treatment following diagnosis, a phenomenon frequently related to delayed or denied insurance authorization and prohibitive costs associated with copayments and deductibles.8
We estimated that generic DAAs, while still relatively underutilized, saved Medicare ∼$1 billion between 2019 and 2021. As the Centers for Disease Control and Prevention aims to eliminate viral hepatitis as a public health threat by 2030, it is crucial to address the underutilization of generic DAA as a means of increasing access to safe and effective HCV therapy.9^,^10 Different stakeholders (policy makers, prescribers, patients, payors, etc.) must be involved to increase generic medication utilization. For example, 19 states mandate generic substitutions while the other 31 states allow pharmacists to perform generic substitutions.11 Expansion of generic substitution would likely increase utilization of generic medication and further reduce spending in the US.
This study has several limitations. First, spending was calculated from Medicare and Medicaid claims data, and does not reflect rebates, coupons, or out-of-pocket costs. Our results are therefore an overestimation of the total Medicare and Medicaid spending on HCV medications, as well as the potential cost savings associated with the use of generic medications. Medicaid has statutory 23.1% rebate for branded and 13% rebate for generic medications, as well as state negotiated rebates; Medicare reported an average of 17.5% rebate for branded medications. Some studies have found that Medicaid rebate accounted for over 50% of its total drug spending.12 However, it is not possible to determine actual net spending for HCV drugs as rebate data are proprietary and not publicly available.
In conclusion, Medicare and Medicaid have spent almost $50 billion between 2013 and 2021 on DAAs. Compared to Medicaid, Medicare has underutilized generic DAAs since their approval in 2019. Initiatives to increase generic medication adoption are needed to optimize the number HCV patients treated in a cost-effective manner. Additional studies are warranted to better understand prescription and insurance coverage of generic and branded DAAs, as well as out-of-pocket impacts for patients.
The reference list from the paper itself. Each links out to its DOI / PubMed record.
- 1Rosenberg E.S.JAMA Netw Open 182018 e 18637110.1001/jamanetworkopen.2018.6371 PMC 632437330646319 · doi ↗ · pubmed ↗
- 2Afdhal N.N Engl J Med 370202014188918982472523910.1056/NEJ Moa 1402454 · doi ↗ · pubmed ↗
- 3Nguyen V.H.JAMA Netw Open 5122022 e 224542410.1001/jamanetworkopen.2022.45424 PMC 985633036477481 · doi ↗ · pubmed ↗
- 4Auty S.G.J Health Polit Policy Law 47620226917083586753110.1215/03616878-10041121 PMC 9789167 · doi ↗ · pubmed ↗
- 5Wester C.MMWR Morb Mortal Wkly Rep 7220237167203738455110.15585/mmwr.mm 7226 a 3PMC 10328490 · doi ↗ · pubmed ↗
- 6Kapadia S.N.JAMA Netw Open 682023 e 232732610.1001/jamanetworkopen.2023.27326 PMC 1040377637540513 · doi ↗ · pubmed ↗
- 7The Center for Medicare and Medicaid Services Medicare Part D prescribers – by geography and drughttps://data.cms.gov/provider-summary-by-type-of-service/medicare-part-d-prescribers/medicare-part-d-prescribers-by-geography-and-drug 2021
- 8The Center for Medicare and Medicaid Services Medicaid state drug utilization datahttps://www.medicaid.gov/medicaid/prescription-drugs/state-drug-utilization-data/index.html 2023