Magnetization Transfer Ratio in the Typically Developing Pediatric Spinal Cord: Normative Data and Age Correlation
Sara Naghizadeh Kashani, Iswarya Vel, Zahra Sadeghi Adl, Shiva Shahrampour, Devon Middleton, Mahdi Alizadeh, Laura Krisa, Scott Faro, Slimane Tounekti, Julien Cohen‐Adad, Feroze B. Mohamed

TL;DR
This study provides normative data on magnetization transfer ratios in the spinal cords of healthy children and shows how these values change with age and sex.
Contribution
The study introduces automated atlas-based MTR measurements for the pediatric cervical spinal cord and reports age and sex correlations.
Findings
MTR values showed significant sex differences in whole white matter and lateral corticospinal tracts.
MTR values at C5 correlated positively with age after correcting for multiple comparisons.
A decreasing trend in MTR values was observed across spinal cord levels in whole white matter.
Abstract
This study presents automated atlas‐based magnetization transfer (MT) measurements of the typically developing pediatric cervical spinal cord (SC). We report normative MT ratio (MTR) values from the whole cervical cord white matter (WM) and WM tracts, examining variations with age, sex, height, and weight. MT scans of 33 healthy females (mean age = 12.8) and 22 males (mean age = 13.09) were acquired from the cervical SC (C2–C7) using a 3.0 T MRI. Data were processed using the SC Toolbox, segmented, and registered to the PAM50 template. Affine and non‐rigid transformations co‐registered the PAM50 WM atlas to subject‐specific space. MTRs were measured for the specific WM tracts (left and right dorsal fasciculus gracilis, dorsal fasciculus cuneatus, and lateral corticospinal tracts [LCST]) and the whole WM. Descriptive statistics, correlation analysis, and unpaired t‐tests (p < 0.05)…
Genes, proteins, chemicals, diseases, species, mutations and cell lines named across the full text — each resolved to its canonical identifier and authoritative record.
Click any figure to enlarge with its caption.
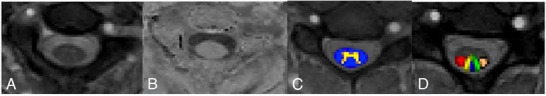 FIGURE 1
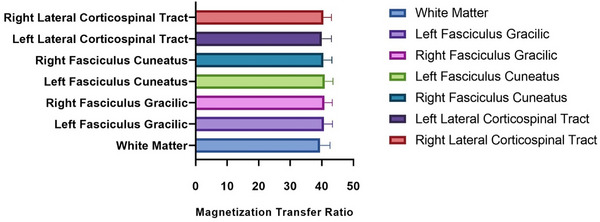 FIGURE 2
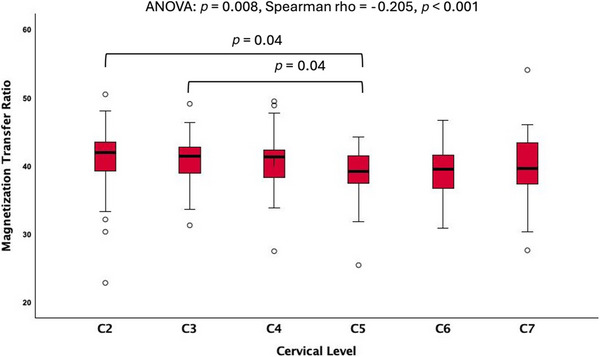 FIGURE 3
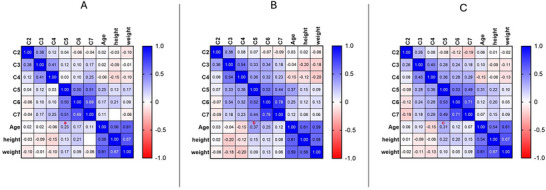 FIGURE 4
| Spinal cord regions | Mean MTR ± standard deviation | Coefficient of variation (%) | 90% Confidence interval |
|---|---|---|---|
| White matter | 40.06 ± 2.5 | 6.2 | 2.3%, 15.1% |
| Left fasciculus gracilis | 39.79 ± 2.7 | 6.8 | 3.1%, 21% |
| Right fasciculus gracilis | 40.81 ± 2.5 | 6.1 | 2.8%, 22.6% |
| Left fasciculus cuneatus | 40.95 ± 2.6 | 6.3 | 2.4%, 23% |
| Right fasciculus cuneatus | 40.53 ± 2.6 | 6.4 | 3.2%, 18% |
| Left lateral corticospinal | 40.02 ± 1.6 | 4 | 2.7%, 17.3% |
| Right lateral corticospinal | 40.51 ± 2.5 | 6.1 | 3.4%, 20.6% |
| TRACTS | Age |
|---|---|
| Left fasciculus gracilis |
|
| Right fasciculus gracilis |
|
| Left fasciculus cuneatus |
|
| Right fasciculus cuneatus |
|
| Left lateral corticospinal |
|
| Right lateral corticospinal |
|
- —National Institute of Neurological Disorders and Stroke (NINDS)
- —National Institutes of Health (NIH)
Peer Reviews
No public reviews on file for this paper yet. If you reviewed it on a platform where reviews are public (OpenReview, ICLR, NeurIPS, ICML), you can paste yours below so the community can read it here.
Videos
No videos yet. Explain this paper in a talk, walkthrough, or lecture? Add one.
Taxonomy
TopicsAdvanced Neuroimaging Techniques and Applications · Spinal Dysraphism and Malformations · Advanced MRI Techniques and Applications
Introduction
1
Magnetization transfer (MT) imaging is a well‐established neuroimaging technique that has been used to detect tissue microstructural damage, specifically white matter (WM) tract integrity [1]. MT contrast relies on the interaction of hydrogen protons associated with macromolecules (such as lipids found in the myelin sheets), providing an indirect measurement of myelin content [2, 3]. This technique has been widely applied in demyelination disorders such as multiple sclerosis, cervical spondylotic myelopathy, and SC injury not only to detect changes in myelin but also to track disease progression and treatment effects [4, 5]. Furthermore, MT measurements have contributed to understanding the pathophysiology of neurological disorders [6, 7]. The application of this method is not limited to adults. MT has shown promising results in the pediatric population with neurological disorders such as medulloblastoma, hypoxic‐ischemic brain injuries, and epilepsy, all focusing on the brain [8, 9, 10]. In spinal cord (SC) imaging, particularly for adults, there are established normative MT values for whole cord and tract‐based evaluations, demonstrating the variability of the results based on age, sex, SC length, weight, and height [11]. However, limited work has been done to investigate normative values in pediatrics.
Despite the progress of MT imaging (MTI), there are obstacles to applying this technique in a clinical field, due to the broad range of normative values limiting its reliability [11]. Providing accurate normative values is especially important for pediatric population, due to the complex process of SC development, triggering particular conversions in its microstructural properties relevant to age [12].
Prior research has demonstrated the utility of MTR values in elucidating the myelination process across various brain ROIs throughout pediatric development [5, 13]. However, to the best of our knowledge, there are no studies investigating tract‐based or cross‐sectional MT ratio (MTR) changes of SC across various age groups of pediatrics, highlighting the necessity for establishing such values within this demographic [5, 14, 15].
The current study aims to measure the MTR values across the cervical levels and distinct spinal tracts among children aged 6–17, and report the normative MTR values for the pediatric population. This research also evaluates the correlation of these measures with age and sex, aiming to investigate any differences in pediatric SC maturation phases [16].
Methods
2
Study Design and Subjects
2.1
Fifty‐five typically developing (TD) children including a group of 33 females (mean age, 12.84 ± 2.8 years) and 22 males (mean age, 13.90 ± 2.1 years) were included in data analysis. This study was a cross‐sectional study conducted as part of a larger project, which involved recruiting children. Institutional review board approved informed consent from the child's legal guardian and written informed assent from the children, were obtained. Children included in this study had no past medical history of SC injuries, pathologies, or any neurological medical diagnosis, all being assessed by performing a screening questionnaire and a brief evaluation of their motor function.
MR Imaging Acquisitions
2.2
This study was conducted on a 3 Tesla Prisma MR scanner (Siemens Healthineers, Erlangen, Germany). Neck elements (4‐channel) of the 20‐channel head/neck coil and 24‐channel spine matrix coil were used. The imaging procedure followed established methods previously employed by one of the authors in the adult population (J.C.‐A.), ensuring consistency and comparability with previous studies. MTI was performed using a fast low‐angle shot sequence acquired in the axial plane parallel to the SC with parameters: field of view of 230 mm, acquisition matrix of 256 × 256, voxel size of 0.9 × 0.9 × 5 mm^3^, repetition time (TR) of 35 ms, echo time (TE) of 3.1 ms and 22 slices. The total MTI time was 4.24 min. Structural three‐dimensional (3D) T1‐weighted (W) and T2‐W scans were also performed for each subject for anatomic localization and template registration. 3D T2 (sampling perfection with application optimized contrast) images were acquired in the sagittal plane with parameters: field of view of 256 mm, acquisition matrix 320 × 320, slice thickness of 0.8 mm, 64 slices per slab, voxel size of 0.8 × 0.8 × 0.8 mm^3^, TR of 1500 ms, TE of 120 ms.
Image‐Analysis Techniques
2.3
MR images were analyzed using the SC Toolbox (V6.2, Montreal, Canada, https://spinalcordtoolbox.com/stable/index.html) [5, 6]. The pipeline used in this study for MT analysis and SC segmentation has been established and described elsewhere [11, 15, 17]. In brief, initially, MT data were first segmented using the structural T2‐W. To ensure high accuracy in segmentation, fiducials/landmarks were utilized. Specifically, landmarks were placed at the C2 and C5 levels manually to aid in automated segmentation. When necessary, manual segmentation was also employed after quality control of the segmentations, overseen by board‐certified neuroradiologist, with over 30 years of experience. This approach addressed and corrected any inconsistencies, optimizing the overall quality of the segmentations [6]. Next, the data were registered to the PAM50 template to align and spatially normalize individual data into a standard space for group comparison [15].
A sequence of flexible deformations was utilized to estimate affine transformations between the MT image and the template. These collective transformations allowed for the alignment of the PAM50 WM atlas to the unique anatomical space of each subject [15]. MTR values were extracted from specific WM tracts within the region of interest in the cervical cord, including the left and right dorsal fasciculus gracilis, dorsal fasciculus cuneatus, and lateral corticospinal tracts (LCST) tract (Figure 1).
(A) MT1 (acquired with MT saturation pulses) image, (B) MTR image, (C) white matter/gray matter segmentation on T2‐weighted images, the blue area demonstrates white matter, and the yellow part shows the gray matter, (D) white matter atlas overlaid on the MT image. The red area on the right shows the right lateral corticospinal tract, the yellow, blue, and green areas represent dorsal columns, and on the left, the bright pink shows the left lateral corticospinal tract.
Statistical Analysis
2.4
To assess the normative MTR values, the average and standard deviation (SD) of the MTR values were calculated according to sex, age, and vertebral level in each SC tract and the entire WM. An unpaired t‐test was performed for each tract to compare MTR values between the male and female participants. The differences in the MTR values across rostro caudal levels were evaluated with analysis of variance (ANOVA) for each tract and the whole WM. Subsequently, Spearman coefficients were employed to evaluate statistically significant differences between the mean MTR values and the vertebral levels, aiming to identify any associations. In addition, the coefficient of variation (CV) was computed using descriptive statistics to directly compare the variability of MTR values between different WM tracts using this formula:
where σ is the population SD and μ is the population mean MTR values. The CV for each tract was classified as low, if it was less than 5%, moderate if it was between 5% and 10%, and high if it was greater than 10% [18].
Finally, Spearman correlation analysis was performed for each tract and the whole WM to investigate the relationship between age, height, and weight with MTRs, and level‐based analysis was performed for the whole WM, motor and sensory tracts separately. All statistical analysis was performed using Prism GraphPad (V.9.4.1, GraphPad software, LLC, Boston, MA, USA, https://www.graphpad.com/features) and SPSS (V.29, IBM SPSS software, Armonk, New York, USA, https://www.ibm.com/spss).
Results
3
Tract‐Based MTR Normative Values
3.1
MTR values were extracted from C2 to C7, separately for each SC tract. Figure 2 demonstrates the distribution of average MTR values in the SC tracts across subjects. The MTR CV for each tract showed moderate intersubject variability for most tracts and low variability for LCST. Table 1 shows the normative MTR values for different WM regions along with the CV measures.
Magnetization transfer ratio normative values average across the entire cervical spinal cord white matter (WM) and three selected bilateral WM tracts. No significant differences were found across regions (p > 0.05).
MTR Values by Rostro Caudal Level
3.2
ANOVA analysis found significant differences (p = 0.008) in MTR values across different rostro–caudal levels of the whole WM in the cervical SC, particularly between the C2/C3, and C5 levels (p = 0.04) (Figure 3). However, the differences in the MTR values from rostral to caudal cervical spine for distinct WM tracts were not significantly different (p > 0.05). Spearman coefficient analysis of the whole WM showed decreasing MTR values from rostral to caudal vertebral levels (Spearman's rho = −0.205, p < 0.001) (Figure 3).
Magnetization transfer ratio (MTR) versus vertebral level for the whole cervical white matter. Showing significantly different values of MTR across levels (p < 0.05). ANOVA, analysis of variance.
MTR Variation with Demographics
3.3
MTR values were statistically different between females and males, with females showing higher MTR values in the CST by 37% (p = 0.03, t = 2.15) and in the entire WM by 33% (p = 0.04, t = 2.04) compared to males. No significant age differences were found between groups (*p *> 0.05). Correlation analysis showed an increasing however not statistically significant pattern of MTR values with age in all studied tracts (Table 2). Level‐based analysis showed an increasing trend of MTR values with age, with a significant positive correlation at C5 for the whole WM (p false discovery rate = 0.04, r = 0.3) (Figure 4). Height and weight showed no significant correlation with the MTR values.
Correlation matrix of the whole white matter (WM) (A) motor tracts (B) and sensory tract's (C) magnetization transfer ratio (MTR) values with age, height and weight at each vertebral level. After applying false discovery rate (FDR) correction, the only significant correlation was found between age and MTR of the whole WM at C5 level representing as “a” in red (p‐FDR = 0.04), however, C5 showed consistent maximum correlation with age in all three regions of interest (a, b, and c).
Discussion
4
In this study, we measured the normative MTR values in the cervical SC of 55 TD children from various WM tracts and evaluating age and sex‐related differences. To the best of our knowledge, this study is the first to report the normative MTR values and demonstrate age and sex‐related differences of WM tracts in the cervical SC of the pediatric population. Previous studies have examined normative tract‐based diffusion imaging analysis metrics, such as fractional anisotropy (FA) and mean diffusivity (MD), which are well‐known diffusion tensor imaging (DTI) metrics used to explore the WM of the CNS in both adults and pediatric populations [19, 20]. In pediatrics, they reported an increase in FA and a decrease in MD with age throughout the SC. These changes are likely due to maturation processes, including an increase in axonal membranes and myelin density, leading to larger fiber tract diameters and resulting in increased FA. In addition, the decrease in MD is associated with a reduction in extracellular space and water content, reflecting myelination as the SC matures [17]. Furthermore, imaging metrics such as MT have been employed to assess the maturation of WM tracts in the brain, revealing decreasing values with age in adult populations, with significantly lower values after the third decade of life, along with notable differences between hemispheres and tract‐based diffusion analysis outcomes in the brain [21, 22]. However, in the pediatric population, MTR measures have shown a positive correlation between age and WM tracts of the brain, like the DTI metrics, peaking at 6 years old [22, 23]. Similar investigations on the SC revealed a declining trend in MT values with age in adults, with a mean age of 47.1 ± 15.3 [11]. Our findings showed an increasing trend in MTR values in the cervical SC with age, which aligns with previous reports and may reflect ongoing myelination processes in the pediatric population. Previous studies indicated that myelination occurs in the first 2–3 years of life and continues until early adulthood, peaking in the third decade of life before declining [24, 25].
We also performed level‐based correlation analysis with age, height, and weight for the whole WM, motor, and sensory tracts, showing a positive trend from C5 to C7, which was maximally correlated with age at the C5 level. This may be attributed to the C5 level being more susceptible to changes during the development of the cervical spine, potentially making it a critical area for detecting age‐related variations in younger individuals. Similar results revealed a negative correlation between the cross‐sectional area of the cervical SC and age in adults, particularly at the C5/C6 intervertebral level [26]. In addition, we investigated differences in MTR values between males and females, revealing significantly higher values in the whole WM and CST for females. Previous studies evaluating sex differences in the myelination process and cross‐sectional evaluation of the SC suggested that variations in spine or brain size and the regional distributions of gray matter (GM) and WM between males and females are predominantly associated with disparities in WM volume [27–29, 30]. Tract‐based DTI analysis of the brain in adolescents has shown significantly lower MD and higher FA in the CST bilaterally in females, reflecting greater WM density in the brain CST compared to males, which is consistent with our results in the tract‐based SC analysis [31, 32].
The concept of age‐ and sex‐related dissimilarities might be helpful to understanding the central nervous system's developmental processes and is essential for distinguishing between normal and atypical variations [33, 34]. Moreover, clarifying the connection between MTR and age in children's SC lays the foundation for creating more accurate standard databases similar to MTR normative values in adults, which have already has proven to be helpful in detecting SC pathologies [35, 36, 37].
To establish tract‐based normative MTR values, accurate segmentation of SC is a key step [38]. In this study, we successfully segmented the WM and GM, followed by the segmentation of WM tracts, as shown in Figure 1. The low to moderate CV values across different tracts demonstrate moderate intersubject variability presented in Table 1, which is consistent with previous studies, demonstrating segmentation approaches in SC imaging for adults [39, 40, 41]. These normative values could serve as a valuable reference for future studies, providing a foundation for assessing SC pathologies [42, 43, 44, 45].
To investigate the effects of anatomical variability across the SC in each vertebral level, we performed descriptive statistical MTR measures across the cervical vertebral levels for each tract. Prior studies have indicated that different vertebral levels exhibit unique structural characteristics that might impact the MTR metrics [46, 47]. Our findings, depicted in Figure 3, illustrate a decline in rostral–caudal MTR patterns within the cervical spine's WM. However, when evaluating tracts across vertebral levels, a linear pattern emerged, with no significant differences observed in MTR values.
Previous studies investigating the distribution of diffusion metrics along the entire SC in adults have reported a peak in FA and MT values at the C2 and C7 levels, along with a monotonic variation showing decreasing FA and MTR values and increasing MD values from rostral (C2) to caudal levels (C7). These findings are consistent with our observations in the pediatric population [11, 17]. The volume of WM progressively diminishes toward the caudal direction due to the reduced presence of axons within the long ascending and descending pathways as they traverse more caudal segments of the SC [48]. Furthermore, in the upper cervical cord, both the right‐to‐left diameter of the SC and the area of the central GM, are smaller compared to the lower cervical cord [49]. The observed rostro–caudal decrease in MTR values in this study may be attributed to a combination of factors, including changes in axonal density, myelination, WM volume, and structural differences along the rostro–caudal axis.
The small size of the SC in pediatric subjects makes the segmentation of the WM challenging and potentially could have contributed to the higher intersubject variability. The limited age range and small sample size may also have amplified these challenges. Future studies with larger, multicenter cohorts and the use of advanced machine learning techniques for segmentation could help overcome these limitations.
In conclusion, this study offers a comprehensive examination of SC MT properties, encompassing segmentation, normative values, sex differences, and age‐related changes in the pediatric population. These findings contribute to our understanding of SC microstructure and its variations across pediatric population. The results might have implications for future clinical practice, highlighting the importance of considering gender and age in SC evaluations.
Conflicts of Interest
The authors declare no conflicts of interest.
The reference list from the paper itself. Each links out to its DOI / PubMed record.
- 1A. R. Martin , B. De Leener , J. Cohen‐Adad , et al., “A Novel MRI Biomarker of Spinal Cord White Matter Injury: T 2*‐Weighted White Matter to Gray Matter Signal Intensity Ratio,” American Journal of Neuroradiology 38 (2017): 1266–1273.28428212 10.3174/ajnr.A 5162 PMC 7960075 · doi ↗ · pubmed ↗
- 2W. Kucharczyk , P. M. Macdonald , G. J. Stanisz , and R. M. Henkelman , “Relaxivity and Magnetization Transfer of White Matter Lipids at MR Imaging: Importance of Cerebrosides and p H,” Radiology 192, no. 2 (1994): 521–529.8029426 10.1148/radiology.192.2.8029426 · doi ↗ · pubmed ↗
- 3G. B. Pike , N. De Stefano , S. Narayanan , et al., “Multiple Sclerosis: Magnetization Transfer MR Imaging of White Matter Before Lesion Appearance on T 2‐Weighted Images,” Radiology 215, no. 3 (2000): 824–830.10831705 10.1148/radiology.215.3.r 00jn 02824 · doi ↗ · pubmed ↗
- 4J. Cohen‐Adad , M. M. El Mendili , S. Lehéricy , et al., “Demyelination and Degeneration in the Injured Human Spinal Cord Detected With Diffusion and Magnetization Transfer MRI,” Neuro Image 55, no. 3 (2011): 1024–1033.21232610 10.1016/j.neuroimage.2010.11.089 · doi ↗ · pubmed ↗
- 5B. De Leener , V. S. Fonov , D. L. Collins , V. Callot , N. Stikov , and J. Cohen‐Adad , “PAM 50: Unbiased Multimodal Template of the Brainstem and Spinal Cord Aligned with the ICBM 152 Space,” Neuro Image 165 (2018): 170–179.29061527 10.1016/j.neuroimage.2017.10.041 · doi ↗ · pubmed ↗
- 6B. De Leener , S. Lévy , S. M. Dupont , et al., “SCT: Spinal Cord Toolbox, an Open‐Source Software for Processing Spinal Cord MRI Data,” Neuro Image 145 (2017): 24–43.27720818 10.1016/j.neuroimage.2016.10.009 · doi ↗ · pubmed ↗
- 7A. R. Martin , I. Aleksanderek , J. Cohen‐Adad , et al., “Translating State‐of‐the‐Art Spinal Cord MRI Techniques to Clinical Use: A Systematic Review of Clinical Studies Utilizing DTI, MT, MWF, MRS, and f MRI,” Neuro Image: Clinical 10 (2015): 192–238.26862478 10.1016/j.nicl.2015.11.019PMC 4708075 · doi ↗ · pubmed ↗
- 8R. Della Nave , A. Magaudda , R. Michelucci , et al., “Whole‐Brain Histogram and Voxel‐Based Analyses of Apparent Diffusion Coefficient and Magnetization Transfer Ratio in Celiac Disease, Epilepsy, and Cerebral Calcifications Syndrome,” American Journal of Neuroradiology 28, no. 3 (2007): 479–485.17353316 PMC 7977847 · pubmed ↗