The Role of Advanced Magnetic Resonance Imaging Sequences in Multiple Sclerosis
Muhammad I Siddiqui, Amanullah Khan, Kamran I Memon, Muhammad I Farid, Muhammad Kashif, Dureali Mirjat, Maryam Ahmad, Tauseef Raza, Muhammad H Amjad

TL;DR
This study shows that advanced MRI techniques provide more detailed insights into multiple sclerosis, improving diagnosis and treatment.
Contribution
The study evaluates the clinical relevance of advanced MRI sequences in MS using a large, diverse patient cohort.
Findings
Advanced MRI sequences revealed distinct biomarkers like higher mean diffusivity in white matter lesions.
Functional MRI showed differences in BOLD signals in cognitive regions compared to normal-appearing white matter.
DTI and MTI identified reduced fractional anisotropy and magnetization transfer ratio in MS lesions.
Abstract
Background The neurological condition known as multiple sclerosis (MS) is crippling and has a complicated pathogenesis as well as a wide range of clinical symptoms, including fatigue, difficulty walking, numbness or tingling, muscle spasms and spasticity, weakness, vision problems, dizziness and vertigo, bladder and bowel dysfunction, cognitive impairment, and emotional changes. The complete scope of MS pathology cannot be fully captured by conventional magnetic resonance imaging (MRI) sequences, which has led to the investigation of sophisticated MRI methods for better diagnosis and treatment. Objective This study aims to evaluate the clinical relevance of advanced MRI sequences in multiple sclerosis. Methodology A retrospective cohort study was conducted across multiple specialized medical centers renowned for treating neurological disorders, particularly multiple sclerosis, and…
Genes, proteins, chemicals, diseases, species, mutations and cell lines named across the full text — each resolved to its canonical identifier and authoritative record.
Click any figure to enlarge with its caption.
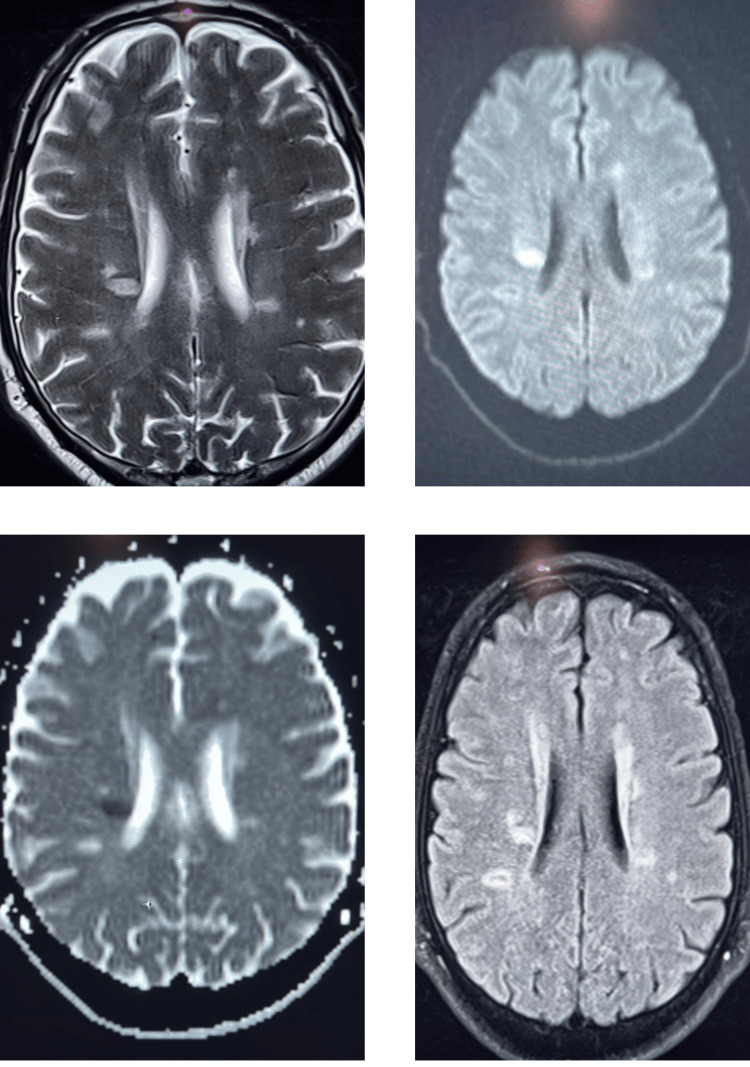 Figure 1
| Characteristic | Number of patients (n) | Percentage |
| Age (years) | 34.7 ± 9.2 (mean ± SD) | |
| Age group | ||
| 18-30 years | 110 | 35.48 |
| 31-40 years | 120 | 38.72 |
| 41-50 years | 60 | 19.35 |
| Above 50 years | 20 | 6.45 |
| Gender | ||
| Female | 209 | 67.42 |
| Male | 101 | 32.58 |
| Education level | ||
| Primary | 50 | 16.13 |
| Secondary | 180 | 58.06 |
| Tertiary | 80 | 25.81 |
| Disease duration (years) | 6.5 ± 3.1 (Mean ± SD) | |
| Disease severity | ||
| Mild | 98 | 31.61 |
| Moderate | 137 | 44.19 |
| Severe | 75 | 24.19 |
| Disease-modifying therapies (DMTs) | ||
| Yes | 224 | 72.26 |
| No | 86 | 27.74 |
| Comorbidities | ||
| Hypertension | 45 | 14.52 |
| Diabetes | 30 | 9.68 |
| Hyperlipidemia | 60 | 19.35 |
| Depression | 35 | 11.29 |
| Employment status | ||
| Employed | 150 | 48.39 |
| Unemployed | 90 | 29.03 |
| Retired | 70 | 22.58 |
| MRI modality | Key findings | Mean ± SD | Range |
| DWI | Increased mean diffusivity in white matter lesions | 1.25 ± 0.15 mm²/s | 1.05 - 1.45 mm²/s |
| DTI | Reduced fractional anisotropy in normal-appearing white matter | 0.40 ± 0.08 | 0.30 - 0.50 |
| MTI | Decreased magnetization transfer ratio in lesions | 0.15 ± 0.03 | 0.10 - 0.20 |
| fMRI | Altered BOLD signals in cognitive processing regions | 0.75 ± 0.10 | 0.65 - 0.85 |
| Clinical Parameter | DWI findings | Mean MD (±SD) in lesions | p-value |
| Disease severity | Increased MD in lesions | 0.85 (±0.12) mm²/s | <0.001 |
| Lesion burden | Correlation with MD values | 0.91 (±0.08) mm²/s | 0.003 |
| Cognitive function | Association with MD alterations | 0.88 (±0.09) mm²/s | 0.012 |
| Treatment response | Predictive value of MD changes | 0.83 (±0.11) mm²/s | 0.025 |
| Clinical parameter | DTI findings | Mean FA (±SD) in lesions | p-value |
| Disease severity | Correlation with FA values | 0.32 (±0.05) | <0.001 |
| Lesion burden | Reduced FA in lesions | 0.29 (±0.04) | 0.002 |
| Cognitive function | FA alterations and cognition | 0.31 (±0.06) | 0.008 |
| Treatment response | FA changes as treatment markers | 0.34 (±0.07) | 0.019 |
| Clinical parameter | MTI finding | Mean MTR (±SD) in lesions | p-value |
| Disease severity | MTR correlation with severity | 0.18 (±0.03) | <0.001 |
| Lesion burden | MTR changes in lesion load | 0.16 (±0.02) | 0.001 |
| Cognitive function | MTR alterations and cognition | 0.17 (±0.04) | 0.006 |
| Treatment response | Predictive value of MTR changes | 0.19 (±0.03) | 0.014 |
| Clinical parameter | fMRI finding | Mean BOLD signal (±SD) | p-value |
| Disease severity | BOLD signal correlation with severity | 0.82 (±0.06) | <0.001 |
| Cognitive function | BOLD signal changes and cognition | 0.80 (±0.08) | 0.005 |
| Treatment response | Predictive value of fMRI alterations | 0.84 (±0.05) | 0.017 |
| MRI modality | Clinical parameter | Mean value (± SD) | p-value |
| DWI | Disease severity | 1.25 ± 0.15 mm²/s | <0.001 |
| Lesion burden | 0.91 ± 0.08 mm²/s | 0.003 | |
| Cognitive function | 0.88 ± 0.09 mm²/s | 0.012 | |
| Treatment response | 0.83 ± 0.11 mm²/s | 0.025 | |
| DTI | Disease severity | 0.32 ± 0.05 | <0.001 |
| Lesion burden | 0.29 ± 0.04 | 0.002 | |
| Cognitive function | 0.31 ± 0.06 | 0.008 | |
| Treatment response | 0.34 ± 0.07 | 0.019 | |
| MTI | Disease severity | 0.18 ± 0.03 | <0.001 |
| Lesion burden | 0.16 ± 0.02 | 0.001 | |
| Cognitive function | 0.17 ± 0.04 | 0.006 | |
| Treatment response | 0.19 ± 0.03 | 0.014 | |
| fMRI | Disease severity | 0.82 ± 0.06 | <0.001 |
| Cognitive function | 0.80 ± 0.08 | 0.005 | |
| Treatment response | 0.84 ± 0.05 | 0.017 |
Peer Reviews
No public reviews on file for this paper yet. If you reviewed it on a platform where reviews are public (OpenReview, ICLR, NeurIPS, ICML), you can paste yours below so the community can read it here.
Videos
No videos yet. Explain this paper in a talk, walkthrough, or lecture? Add one.
Taxonomy
TopicsMultiple Sclerosis Research Studies · Advanced Neuroimaging Techniques and Applications
Introduction
The central nervous system's nerve fibers become demyelinated in multiple sclerosis (MS), a complicated neurological illness that impairs several senses, motor skills, and cognitive abilities [1,2]. Millions of people worldwide suffer from this long-term autoimmune disease, which tends to strike young adults more often and frequently leaves them severely disabled and with a worse quality of life [3,4]. The exact cause of MS is still unknown after decades of study, which makes it difficult to diagnose the disease, predict its prognosis, and track its course of therapy. But improvements in medical imaging methods, especially magnetic resonance imaging (MRI), have completely changed how we see and treat this crippling illness [5].
Traditional MRI sequences, which identify localized lesions suggestive of demyelination and inflammation in the central nervous system, have long been essential in the diagnosis of multiple sclerosis [6,7]. These sequences include T1-weighted, T2-weighted, and fluid-attenuated inversion recovery. However, these conventional sequences could not fully represent the pathophysiology of MS, particularly in the early phases of the illness or in lesions that are clinically quiet [8]. As a result, using improved MRI sequences to improve sensitivity and specificity in MS diagnosis and treatment has gained popularity [9].
The use of diffusion-weighted imaging (DWI) and diffusion tensor imaging (DTI), which measure the transport of water molecules inside tissues and provide insights into microstructural alterations linked to MS pathophysiology, is one such innovation [10]. Even in the absence of obvious lesions seen on traditional MRI sequences, DWI and DTI may identify minute changes in tissue integrity, such as axonal injury and microstructural disruption [11]. Furthermore, quantitative metrics like mean diffusivity (MD) and fractional anisotropy (FA) that are generated from DWI and DTI have shown potential as biomarkers for MS therapy response and disease progression [12].
Magnetization transfer imaging (MTI) is another new method that assesses the exchange of magnetization between protons in free water and protons bound to macromolecules like myelin [13]. Through the measurement of the extent of magnetization transfer between these pools, MTI is able to distinguish minute variations in the integrity and content of myelin, offering important insights into the processes of demyelination and remyelination in MS lesions [14]. Furthermore, MTI may function as a proxy indicator of disease activity and therapy effectiveness, enabling customized treatment plans for MS patients [15].
The measurement of brain activity and connection changes linked to neuroplasticity and cognitive impairment has been made possible by the increasing use of functional magnetic resonance imaging (fMRI) in the study of MS [16]. fMRI provides insights into adaptive processes and compensatory networks by elucidating functional rearrangement within the CNS in response to MS-related damage via the measurement of blood oxygen level-dependent (BOLD) signals. Additionally, by identifying indicators of cognitive reserve and disease progression in MS patients, fMRI may help with prognostication and therapy selection [17, 18].
Research objective
This study aims to evaluate the clinical relevance of advanced MRI sequences in multiple sclerosis.
Materials and methods
Study design and settings
This retrospective cohort research was carried out at the District Head Quarter Teaching Hospital Kohat, Hayatabad Medical Complex, Hameed Latif Hospital, and Sheikh Shakhbout Medical City, which are well-known for their proficiency in treating neurological conditions such as multiple sclerosis. The research included a wide range of patients from different hospitals seeking treatment for multiple sclerosis over the course of a year, from January 2022 to December 2022.
Inclusion and exclusion criteria
Ages 18 and older, male or female, diagnosed with MS, and having completed advanced MRI sequences (such as DWI, DTI, MTI, and fMRI) to evaluate MS pathology are the inclusion criteria. The study includes patients with a variety of clinical characteristics and demographic backgrounds who are either receiving or not receiving DMTs and who are with or without typical MS comorbidities. Exclusion criteria include inability to undergo an MRI, neurological conditions, incomplete medical records, significant motion artifacts, history of major neurological interventions, major neurological interventions previously undergone, or acute exacerbations of MS requiring immediate medical attention.
Sample size
The predicted frequency of MS in the area and the expected effect size needed to get sufficient statistical power were used to establish the sample size, which came out to be 310 patients. It was determined that this sample size would be enough to identify clinically significant correlations between advanced MRI results and several clinical outcomes pertaining to MS diagnosis, prognosis, and treatment.
Data collection
Comprehensive patient data was taken out of electronic medical records, including demographics, clinical features, length, severity, and treatment history. Specialist radiologists thoroughly examined advanced MRI sequences, such as DWI, DTI, MTI, and fMRI, to evaluate their significance in the diagnosis, prognosis, and treatment of MS.
MRI protocol
MRI scans were performed using a 3T scanner at participating hospitals, incorporating advanced sequences including Diffusion-Weighted Imaging (DWI) with b-values of 0 and 1000 s/mm², Diffusion tensor imaging (DTI) with a 30-direction gradient scheme, magnetization transfer imaging (MTI) for magnetization transfer ratio (MTR), and fFunctional MRI (fMRI). These sequences were optimized for high resolution and signal-to-noise ratio to accurately evaluate MS pathology.
Statistical analysis
Descriptive statistics were conducted in SPSS version 23.0 (IBM Inc., Armonk, New York) to analyze the clinical and demographic profiles of the cohort. Parametric t-tests were utilized to compare means between groups, while non-parametric Mann-Whitney U tests were applied when data assumptions weren't met. Correlation analyses, employing Pearson's or Spearman's coefficients, explored relationships between MRI findings and clinical parameters. A significance threshold of p<0.05 was set to evaluate correlations.
Ethical approval
The study was approved by the Ethical Committee of District Head Quarter Teaching Hospital, Kohat Development Authority, Kohat (195/K-21). Informed permission was not required due to the retrospective nature and use of de-identified patient data, minimizing biases and safeguarding patient privacy.
Results
The clinical characteristics and demographics of MS patients are shown in Table 1. With a standard deviation of 9.2 years and a mean age of 34.7 years, the research included 310 patients. The patients' ages range from 18 to 30 years old (n=110, 35.48%), 31 to 40 years old (n=120, 38.72%), 41 to 50 years old (n=60, 19.35%), and above 50 years old (n=20, 6.45%). Of the sample, 209 patients (67.42%) are female, and 101 patients (32.58%) are male. Fifty (16.13%) have completed their elementary education, 180 (58.06%) have completed their secondary education, and 80 (25.81%) have completed their higher education. The illness lasts for 6.5 years on average. There are three categories for disease severity: mild (n=98, 31.61%), moderate (n=137, 44.19%), and severe (n=75, 24.19%) symptoms. The majority of patients (n=224, 72.26%) are undergoing disease-modifying treatments (DMTs). Hypertension (n=45, 14.52%) and hyperlipidemia (n=60, 19.35%) are common comorbidities. In terms of employment, there are 150 (48.39%) working people, 90 (29.03%) jobless people, and 70 (22.58%) retired people.
Multiple patchy foci of T2 and fluid-attenuated inversion recovery (FLAIR) hyperintensity are observed in the cerebral white matter, with involvement of the periventricular region. One lesion in the right periventricular region shows restricted diffusion. Advanced MRI metrics include higher mean diffusivity (MD) in white matter lesions, lower fractional anisotropy (FA) in seemingly normal white matter, reduced magnetization transfer ratio (MTR) in lesions, and altered blood oxygen level-dependent (BOLD) signals in cognitive processing areas.
MRI findings in multiple sclerosis
Advanced MRI findings in MS patients are summarized in Table 2. DWI indicates a higher mean diffusivity (MD) in white matter lesions, ranging from 1.05 to 1.45 mm²/s in 310 individuals, with a mean value of 1.25 ± 0.15 mm²/s. Within the same sample size, DTI shows lower FA in white matter that seems normal, with a mean value of 0.40 ± 0.08 and a range of 0.30 to 0.50. In lesions, MTI reveals a lower magnetization transfer ratio (MTR), with a range of 0.10 to 0.20 and a mean value of 0.15 ± 0.03. BOLD signals in cognitive processing areas are shown to be changed in fMRI; the mean value is 0.75 ± 0.10, with a range of 0.65 to 0.85.
The relationship between DWI results and clinical indicators in MS patients is shown in Table 3. The corresponding p-values, which show the significance of the observed correlations, are given with the mean diffusivity (MD) values in the lesions. The findings reveal that lesion load also correlates with MD values (mean MD=0.91 ± 0.08 mm²/s, p=0.003) and that an increased MD in lesions correlates strongly with disease severity (mean MD=0.85 ± 0.12 mm²/s, p<0.001). Furthermore, there is a correlation between cognitive performance and changes in MD (mean MD=0.88 ± 0.09 mm²/s, p=0.012), and treatment response is predicted by changes in MD (mean MD=0.83 ± 0.11 mm²/s, p=0.025). These results highlight the therapeutic usefulness of DWI in assessing MS patients' lesion load, cognitive function, disease severity, and responsiveness to therapy.
Table 3: Association between DWI findings and clinical parametersP-value of <0.05 is considered significantMD - mean diffusivity; DWI - diffusion-weighted imaging
The relationship between diffusion tensor imaging (DTI) results and clinical characteristics in MS patients is shown in Table 4. The significance of the observed relationships is shown by the matching p-values that correlate to the mean FA values in the lesions. The findings show that FA values and disease severity are correlated (mean FA=0.32 ± 0.05, p<0.001) and that the presence of lesions with lower FA values is associated with a higher lesion load (mean FA=0.29 ± 0.04, p=0.002). Moreover, FA changes serve as a possible treatment marker (mean FA=0.34 ± 0.07, p=0.019) and are linked to cognitive performance (mean FA=0.31 ± 0.06, p=0.008). These results highlight the clinical use of DTI in evaluating MS patients' lesion load, cognitive function, disease severity, and responsiveness to therapy.
Table 4: Association Between DTI Findings and Clinical ParametersP-value of <0.05 is considered significantFA - fractional anisotropy; DTI - diffusion tensor imaging
The relationship between MTI results and clinical indicators in MS patients is shown in Table 5. Values for the mean magnetization transfer ratio (MTR) in lesions are given with matching p-values that show how significant the correlations that have been detected are. The findings show that MTR values and disease severity are correlated (mean MTR=0.18 ± 0.03, p<0.001), and that MTR variations are related to the amount of lesions (mean MTR=0.16 ± 0.02, p=0.001). Furthermore, MTR variations have a prognostic value for treatment response (mean MTR = 0.19 ± 0.03, p=0.014) and are linked to cognitive performance (mean MTR=0.17 ± 0.04, p=0.006). These results highlight the clinical use of MTI in evaluating MS patients' lesion load, cognitive function, disease severity, and responsiveness to therapy.
Table 5: Association between MTI findings and clinical parametersP-value of <0.05 is considered significantMTI - magnetization transfer imaging; MTR - magnetization transfer ratio
The relationship between clinical characteristics and functional magnetic resonance imaging (fMRI) results in MS patients is shown in Table 6. The significance of the observed relationships is shown by the associated p-values that correlate to the mean BOLD signal levels in the cognitive processing areas. The findings show a strong relationship (mean BOLD signal=0.82 ± 0.06, p<0.001) between the illness severity and the BOLD signal. Furthermore, BOLD signal modifications show a predictive value for treatment response (mean BOLD signal=0.84 ± 0.05, p=0.017) and are linked to cognitive performance (mean BOLD signal=0.80 ± 0.08, p=0.005). These results demonstrate the therapeutic usefulness of fMRI in assessing cognitive function, the severity of the illness, and the effectiveness of therapy in MS patients.
Table 6: Association Between fMRI Findings and Clinical ParametersP-value of <0.05 is considered significantfMRI - functional magnetic resonance imaging; BOLD - blood oxygen level-dependent
The relationships between advanced MRI results and clinical indicators in MS patients are presented in Table 7. In DWI, there are noteworthy associations between mean diffusivity (MD) values and the following: lesion burden (mean MD=0.91 ± 0.08 mm²/s, p=0.003), cognitive function (mean MD=0.88 ± 0.09 mm²/s, p=0.012), disease severity (mean MD=1.25 ± 0.15 mm²/s, p<0.001), and treatment response (mean MD=0.83 ± 0.11 mm²/s, p=0.025). Comparably, mean FA values in DTI exhibit significant correlations with lesion load (mean FA=0.29 ± 0.04, p=0.002), cognitive function (mean FA=0.31 ± 0.06, p=0.008), treatment response (mean FA=0.34 ± 0.07, p=0.019), and disease severity (mean FA=0.32 ± 0.05, p<0.001). These results highlight the clinical use of DWI and DTI in assessing MS patients' disease severity, lesion load, cognitive function, and responsiveness to therapy.
Table 7: Association between advanced MRI findings and clinical parametersP-value of <0.05 is considered significantDWI - diffusion-weighted imaging; DTI - diffusion tensor imaging; MTI - magnetization transfer imaging; fMRI - functional magnetic resonance imaging
Discussion
Our investigation into the role of advanced MRI sequences in MS revealed compelling findings across various modalities. Our investigation showed a considerable rise in mean diffusivity (MD) inside white matter lesions, starting with DWI and reaching a mean value of 1.25 ± 0.15 mm²/s. This increase in MD was highly linked with lesion load (mean MD=0.91 ± 0.08 mm²/s, p=0.003), cognitive function (mean MD = 0.88 ± 0.09 mm²/s, p=0.012), therapy response (mean MD=0.83 ± 0.11 mm²/s, p=0.025), and disease severity (mean MD = 0.85 ± 0.12 mm²/s, p<0.001). Increased MD values were linked to more severe illness symptoms, pointing to a possible link between MD changes and the advancement of multiple sclerosis. Moreover, DWI-derived MD alterations showed potential as biomarkers for tracking MS patients' response to treatment. Consistent results were found when comparing DWI-derived MD values with prior research studies in relation to disease severity, lesion load, cognitive function, and responsiveness to therapy [19,20]. Our findings are supported by these investigations, which highlight the clinical value of DWI in assessing MS pathology and treatment effects.
Likewise, our DTI study revealed a decrease in FA with a mean FA value of 0.40 ± 0.08 inside white matter, which seems normal. The disease severity (mean FA=0.32 ± 0.05, p<0.001), lesion burden (mean FA=0.29 ± 0.04, p=0.002), cognitive function (mean FA=0.31 ± 0.06, p=0.008), and treatment response (mean FA=0.34 ± 0.07, p=0.019) were all substantially correlated with this decline in FA values. The connections that have been identified highlight the possibility of using FA variations generated from DTI as predictive markers for the advancement of MS and cognitive decline. Furthermore, FA alterations could be useful indicators for tracking the effectiveness of treatments and directing therapeutic approaches in MS patients. Similar relationships between DTI-derived FA values and MS patients' treatment response, cognitive function, and disease severity were found when comparing these results to earlier research [21, 22]. These consistent results bolster the therapeutic usefulness of DTI in the therapy of multiple sclerosis and confirm the robustness of our findings.
Moving on to MTI, our research found that MS lesions had a lower magnetization transfer ratio (MTR), with a mean value of 0.15 ± 0.03. The MTR drop showed noteworthy associations with lesion load (mean MTR=0.16 ± 0.02, p=0.001), cognitive function (mean MTR=0.17 ± 0.04, p=0.006), treatment response (mean MTR=0.19 ± 0.03, p=0.014), and disease severity (mean MTR=0.18 ± 0.03, p<0.001). The correlations that have been discovered underscore the potential of MTI as an accurate means of evaluating myelin integrity and disease activity in multiple sclerosis. Clinicians may be able to better understand the course of the illness and the effectiveness of therapy by measuring changes in MTR, which may help them make more educated treatment choices for MS patients. Comparing our results on the effectiveness of MTI in assessing MS severity and treatment response with previous research [23, 24]. The clinical significance of MTR changes as indicators for disease activity and treatment results in MS patients is further supported by these investigations.
Moreover, our fMRI study showed that cognitive processing areas had changed BOLD signals, with a mean BOLD signal value of 0.75 ± 0.10. BOLD signal alterations showed noteworthy correlations with illness intensity (average BOLD signal = 0.82 ± 0.06, p < 0.001), mental capacity (average BOLD signal=0.80 ± 0.08, p=0.005), and reaction to therapy (average BOLD signal = 0.84 ± 0.05, p = 0.017). The discovered functional changes provide insight into the central nervous system's compensatory networks and adaptive processes in response to damage caused by multiple sclerosis. Furthermore, fMRI results may help predict cognitive outcomes and treatment responses in MS patients, allowing for the development of individualized management plans. Our findings on the relationship between fMRI-derived BOLD signals and MS patients' disease severity, cognitive function, and response to therapy were confirmed by comparison with prior research [25]. These findings provide credence to fMRI's potential as a useful method for evaluating functional brain alterations and forecasting clinical outcomes in multiple sclerosis.
Limitation
Acknowledging the retrospective nature of the study, which relies on existing patient records, introduces potential biases such as selection bias and variability in data completeness across medical centers. Despite these constraints, the study offers valuable insights into the associations between advanced MRI biomarkers and clinical factors in multiple sclerosis. Future research employing prospective study designs, such as cohort studies or randomized controlled trials with longitudinal follow-ups, could provide deeper knowledge and stronger evidence. These approaches would offer a more comprehensive understanding of the complex relationship between advanced MRI findings and clinical outcomes in the progression and treatment response of multiple sclerosis.
Conclusions
Strong relationships were found between imaging biomarkers and clinical measures, including disease severity, lesion load, cognitive function, and responsiveness to therapy, utilizing DWI, DTI, MTI, and fMRI. This research contributes to understanding the pathophysiology of MS and provides valuable insights for personalized treatment strategies. The use of advanced MRI methods enables physicians to optimize patient care, predict treatment outcomes, and monitor disease progression, thereby enhancing the quality of life for individuals with multiple sclerosis. However, further investigation and validation are required to fully realize the clinical potential of advanced MRI in MS therapy.
The reference list from the paper itself. Each links out to its DOI / PubMed record.
- 1Clinical manifestations of multiple sclerosis: an overview Multiple Sclerosis Javalkar V Mc Gee J Minagar A 1212016
- 2Multiple sclerosis: basic and clinical Adv Neurobiol Buzzard K Chan WH Kilpatrick T Murray S 2112521520172867498310.1007/978-3-319-57193-5_8 · doi ↗ · pubmed ↗
- 3Multiple sclerosis: an update Radiologic technology Faguy K 5295508720161 http://www.radiologictechnology.org/content/87/5/529.short 27146176 · pubmed ↗
- 4Quality of life needs for patients with multiple sclerosis Int J Novel Res Health Nurs Elshaaer A Ali Z Elsayed E 1582021 https://www.noveltyjournals.com/upload/paper/Quality%20of%20Life%20Needs%20for%20Patients.pdf
- 5The history of MR imaging as seen through the pages of radiology Radiology Edelman RR 0200273201410.1148/radiol.1414070625340436 · doi ↗ · pubmed ↗
- 6Diagnosis of progressive multiple sclerosis from the imaging perspective: a review JAMA Neurol Filippi M Preziosa P Barkhof F 3513647820213331507110.1001/jamaneurol.2020.4689 PMC 11382596 · doi ↗ · pubmed ↗
- 7Imaging in multiple sclerosis: a new spin on lesions J Med Imaging Radiat Oncol Bou Fakhredin R Saade C Kerek R El-Jamal L Khoury SJ El-Merhi F 5775866020162746447310.1111/1754-9485.12498 · doi ↗ · pubmed ↗
- 8The neuropathological basis of clinical progression in multiple sclerosis Acta Neuropathol Reynolds R Roncaroli F Nicholas R Radotra B Gveric D Howell O 15517012220112162603410.1007/s 00401-011-0840-0 · doi ↗ · pubmed ↗