Horizontal analysis and longitudinal cohort study of chronic renal failure correlates and cerebral small vessel disease relationship using peak width of skeletonized mean diffusivity
Dan Wang, Zheng Sun, Yuehua Li

TL;DR
This study explores how a brain MRI biomarker called PSMD relates to kidney function decline in patients with chronic renal failure.
Contribution
The paper introduces PSMD as a novel MRI biomarker to assess the relationship between cerebral small vessel disease and chronic renal failure progression.
Findings
PSMD increased significantly in progressive chronic renal failure patients over time.
PSMD showed a strong correlation with estimated glomerular filtration rate (eGFR).
Changes in PSMD (ΔPSMD) improved classification of progressive versus stable chronic renal failure groups.
Abstract
Peak width of skeletonized mean diffusivity (PSMD) is an MRI-based biomarker that may reflect white matter lesions (WML). PSMD is based on skeletonization of MR DTI data and histogram analysis. Both chronic renal failure (CRF) and WML may be affected by multisystemic small-vessel disorder. We aimed to explore the relationship between PSMD and estimated glomerular filtration rate (eGFR). Fifty followed-up CRF patients matched for age, sex, hypertension and smoking status were enrolled and classified into a progressive group (n = 16) and stable group (n = 34) based on eGFR levels. Longitudinal and horizontal differences of PSMD were compared between the progressive and stable groups at the initial and follow-up time points. Pearson’s correlation was used for correlation of eGFR with PSMD and WML (per Fazekas scale score). ROC was used to measure the sensitivity of PSMD and WML score to…
Genes, proteins, chemicals, diseases, species, mutations and cell lines named across the full text — each resolved to its canonical identifier and authoritative record.
Click any figure to enlarge with its caption.
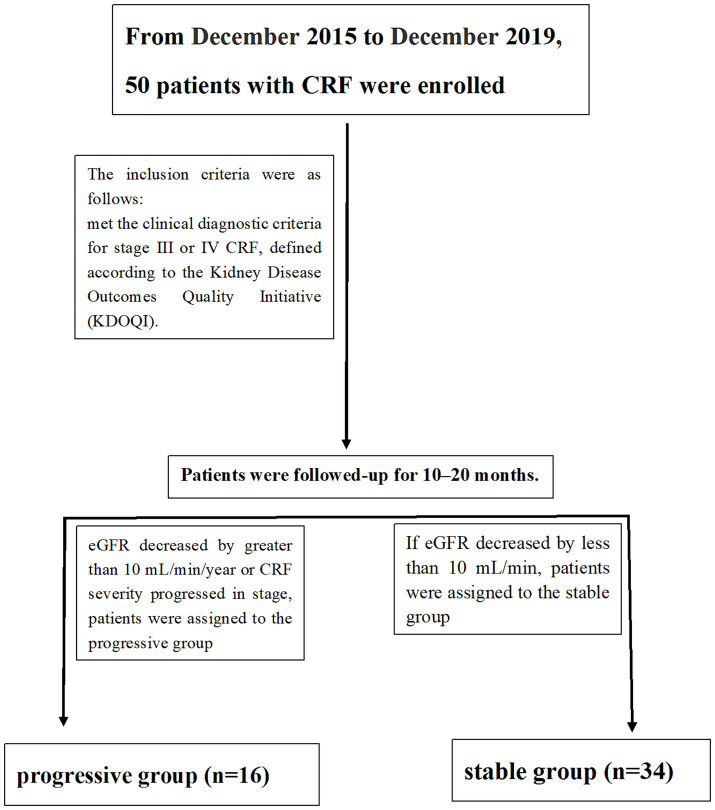 Figure 1
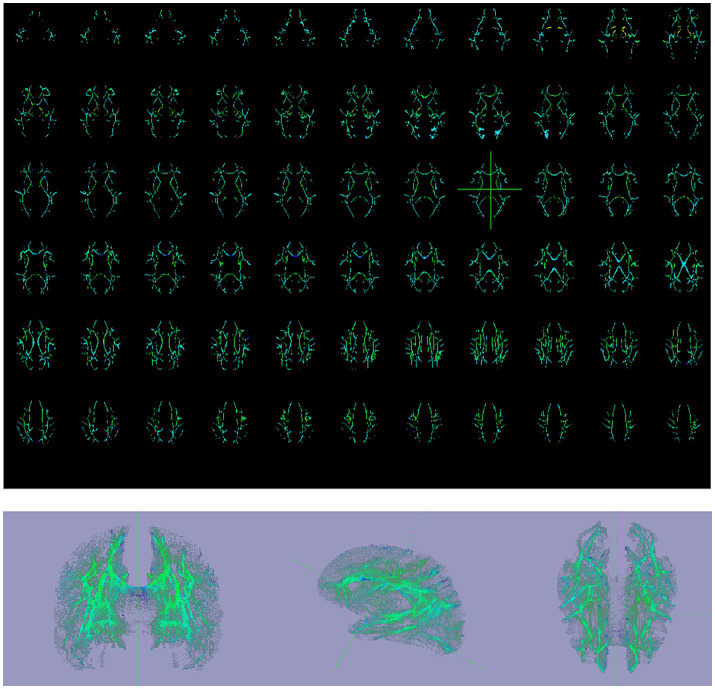 Figure 2
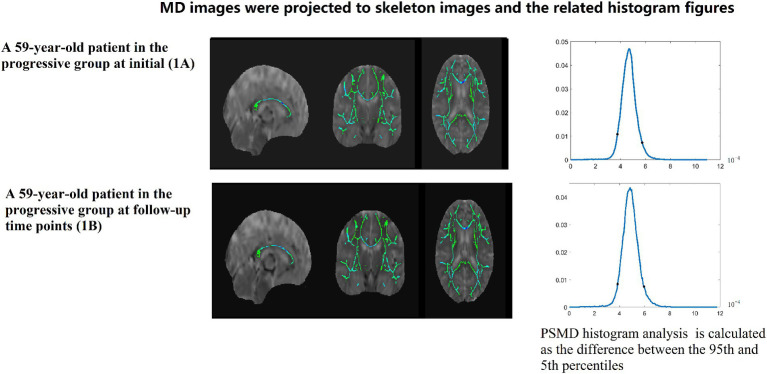 Figure 3
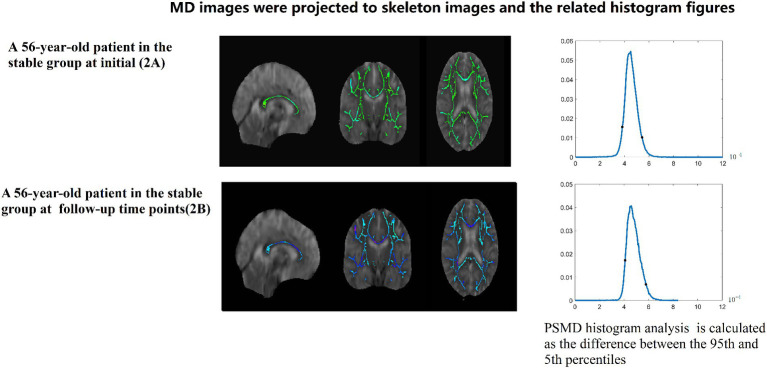 Figure 4
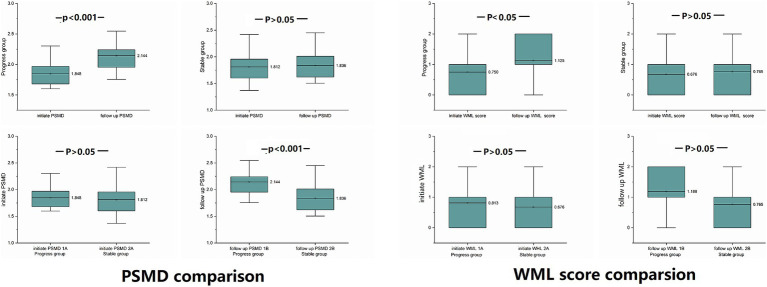 Figure 5
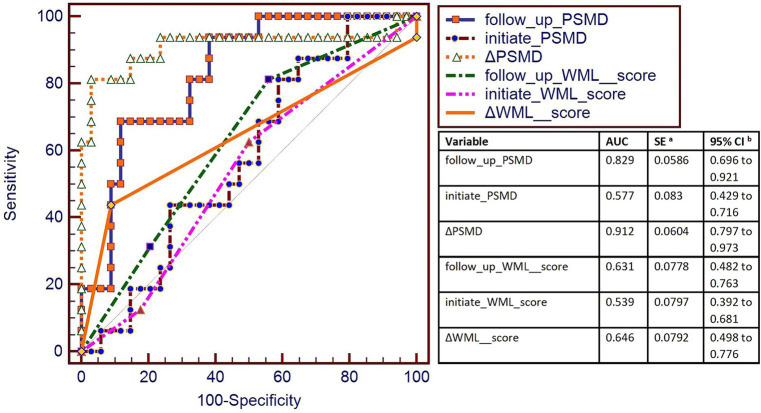 Figure 6
| Progressive group | Stable group | Comparisons between two groups ( | |
|---|---|---|---|
| Number ( | 16 | 34 | |
| Age (years) | 52.35 ± 6.99 | 54.46 ± 8.73 | |
| Sex (male/female) | 11/5 | 19/15 | 0.39 |
| Proportion who are smokers (y/n) | 7/9 | 12/22 | 0.57 |
| Hypertension (%) | 4 (25%) | 8 (23.53%) | 0.91 |
| Diabetes (type 2) | 4 (25%) | 9 (26.47%) | 0.91 |
| Total cholesterol (TC) (mmol/L) | 4.87 + 0.93 | 5.29 + 0.97 | 0.15 |
| Triglycerides (TG) | 1.43 + 0.45 | 1.51 + 0.47 | 0.56 |
| Fasting blood glucose (FBG) | 5.41 + 0.48 | 5.63 + 0.45 | 0.13 |
| Urine erythrocytes | 2.44 + 1.46 | 1.65 + 1.5 | 0.09 |
| Urine protein | |||
| <0.2 g/L | |||
| 0.2 g to 1.0 g/L | |||
| 1.0 to 2.0 g/L | |||
| 2.0 to 4.0 g/L | |||
| >4.0 g/L | |||
| eGFR | |||
| Initial eGFR | 35.868 + 10.086 | 37.253 + 11.865 | |
| Follow-up eGFR | 23.28 + 8.10 | 36.95 + 11.05 | |
| Horizontal comparisons between initial and follow up groups | * | ||
| Initial CKF stage | |||
| Stage III | 11 | 21 | |
| Stage IV | 5 | 13 | |
| CKF stage at follow-up | |||
| Stage III | 3 | 21 | |
| Stage IV | 13 | 13 | |
| Number | eGFR | ΔeGFR | PSMD | ΔPSMD | WML Fazekas scores | ΔWML Fazekas scores | |||||||
|---|---|---|---|---|---|---|---|---|---|---|---|---|---|
| Mean | SD | Mean | SD | Mean | SD | Mean | SD | Mean | SD | Mean | SD | ||
| Group 1A | 16 | 35.868 | 10.086 | −10.092 | 8.948 | 1.848 | 0.208 | 0.296 | 0.22 | 0.75 | 0.683 | 0.25 | 0.577 |
| Group 1B | 16 | 23.28 | 8.10 | 2.144 | 0.223 | 1.125 | 0.719 | ||||||
| Comparison 1A vs. 1B | <0.001* | <0.001* | 0.029 | ||||||||||
| Group 2A | 34 | 37.253 | 11.865 | −0.302 | 7.132 | 1.812 | 0.259 | 0.024 | 0.091 | 0.676 | 0.768 | 0.088 | 0.288 |
| Group 2B | 34 | 36.95 | 11.05 | 1.836 | 0.255 | 0.765 | 0.781 | ||||||
| Comparison 2A vs. 2B | 0.807 | 0.13 | 0.083 | ||||||||||
| Comparison group1 vs. group 2 | <0.001* | <0.001* | 0.032 | ||||||||||
| Number | eGFR | PSMD | WML Fazekas scores | ||||
|---|---|---|---|---|---|---|---|
| Mean | SD | Mean | SD | Mean | SD | ||
| Group 1A | 16 | 35.868 | 10.086 | 1.848 | 0.208 | 0.813 | 0.655 |
| Group 2A | 34 | 37.253 | 11.865 | 1.812 | 0.259 | 0.676 | 0.768 |
| Comparison between group 1A vs. 2A | 0.403 | 0.487 | 0.611 | ||||
| 0.689 | 0.629 | 0.544 | |||||
| Group 1B | 16 | 23.28 | 8.10 | 2.144 | 0.223 | 1.188 | 0.655 |
| Group 2B | 34 | 36.95 | 11.05 | 1.836 | 0.255 | 0.765 | 0.781 |
| Comparison between group 1B vs. 2B | 19.492 | 16.749 | 2.408 | ||||
| <0.001* | <0.001* | 0.127 | |||||
| Correlation coefficients | Initial GFR | Initial PSMD | Initial WML Fazekas scores | Follow-up PSMD | Follow-up WML Fazekas scores | ΔWML Fazekas scores score | ΔPSMD |
|---|---|---|---|---|---|---|---|
| Initial eGFR | Pearson corr. | −0.405 | −0.223 | ||||
| 0.004* | 0.119 | ||||||
| Follow-up eGFR | Pearson corr. | −0.445 | −0.352 | ||||
| 0.001* | 0.012* | ||||||
| ΔeGFR | Pearson corr. | −0.225 | −0.438 | ||||
| 0.117 | 0.001* |
- —National Natural Science Foundation of China10.13039/501100001809
- —Shanghai Medical Rising Star Talent Fund; Shanghai Science and Technology Innovation Action Plan
Peer Reviews
No public reviews on file for this paper yet. If you reviewed it on a platform where reviews are public (OpenReview, ICLR, NeurIPS, ICML), you can paste yours below so the community can read it here.
Videos
No videos yet. Explain this paper in a talk, walkthrough, or lecture? Add one.
Taxonomy
TopicsAcute Ischemic Stroke Management · MRI in cancer diagnosis · Neurological Disease Mechanisms and Treatments
Highlights
PSMD is based on skeletonization of MR DTI data and histogram analysis.CRF and WML may be affected by multisystemic small-vessel disorder.To explore the relationship between PSMD and eGFR.
Introduction
Chronic renal failure is often accompanied by nervous system pathology. The earliest chronic renal failure (CRF)-associated lesion occurring in the nervous system is damage to small blood vessels including small arteries, arterioles, capillaries, and small veins (1). These vessels have poor collateral anastomoses, causing increased ischemic susceptibility to the deep white matter of the central nervous system. White matter lesion (WML) is a part of cerebral small vessel disease (CSVD) (2–5).
The correlation between CRF and WML is mainly because of similar hemodynamics, and anatomical and functional features of the kidney and brain (4). Therefore, CRF-associated pathological changes in small vessels of the kidneys may also exist in the small arteries of the brain (6).
Recently, Baykara et al. (7–9) used a new imaging marker called the peak width of skeletonized mean diffusivity (PSMD) in the brain to assess CSVD. PSMD is based on DTI, white matter tract skeletonization, and histogram analysis (7). Skeletonization focuses the analysis of mean diffusivity (MD) on the main fiber tracts, thereby largely eliminating CSF contamination (7). Whole-brain histogram analysis is particularly appropriate when dealing with diffuse diseases and when quantifying total disease burden. In some studies, PSMD appears to be robust and promising for studies on WML in large populations (8, 10, 11).
PSMD has been provided to be related to cerebral small vessel diseases, especially sensitive to small vessel-related white matter abnormalities. However, despite the common nature and high prevalence of cerebrovascular disease in patients with renal failure, the potential application of PSMD in renal failure has scarcely been investigated.
In this study, we used PSMD to explore the progression of WML in CRF based on MR diffusion images, and the relationship of cerebral WML and CRF.
Materials and methods
Participants
This retrospective analysis, conducted between December 2015 and December 2019, involved a cohort of 50 patients diagnosed with chronic renal failure (CRF) primarily caused by glomerulonephritis, hypertension, and diabetes et al., leading to chronic kidney dysfunction. The inclusion criteria were based on the clinical diagnostic guidelines outlined by the Kidney Disease Outcomes Quality Initiative (KDOQI), requiring patients to meet the criteria for stage III or IV CRF. CRF is characterized by prolonged renal damage lasting for more than 3 months, along with various causes of chronic kidney dysfunction. These causes may manifest as abnormal blood or urine components, abnormal imaging results, or a persistent decrease in estimated glomerular filtration rate (eGFR) below 60 mL/min/1.73 m^2^ for more than 3 months.
The patients were followed up for a duration of 10 to 20 months. Those who exhibited a decline in eGFR greater than 10 mL/min/year or showed progression in CRF severity were classified into the progressive group (12). Conversely, patients with a decline in eGFR less than 10 mL/min were categorized into the stable group (Flow chart and data is showed in Figure 1 and Table 1).
Flow chart.
MR examination
All participants underwent MR examinations from December 2015 to December 2019. A 3 T MR scanner (MAGNETOM Verio, Siemens Healthcare, Erlangen, Germany) with a 32-channel head coil was used. The imaging sequences included conventional MR sequences (T1- and T2-weighted image) and diffusion tensor images (DTI). Protocols were as follows: DTI was performed for six b-values (0, 50, 500, 1,000, 1,500, 2,000, and 2,500 s/mm^2^) and 30 directions: FOV, 230 mm; TR/TE, 5100/109 ms; voxel size, 1.8 × 1.8 × 3 mm^3^; slice thickness, 3 mm; and number of slices: 32, DTI sequence takes 10 min 38 s.
Processing of PSMD
PSMD calculations include skeletonization of MR DTI data and histogram analysis Baykara et al. (7–9). (1) Preprocessing algorithms: include removing non-brain tissue and eddy current correction. (2) Skeletonization of MR DTI data: FA images of participants were registered to the FMRIB 1-mm standard space. Then, the FA data of each subject was projected onto the skeleton. According to the generated mapping matrix, the MD is projected onto the skeleton. Finally, the threshold was further set to reduce the influence of CSF on the MD skeleton. (3) Histogram analysis: PSMD is calculated as the difference between the 95th and 5th percentiles of the MD skeleton histogram analysis. All steps from (1) to (3) automatic calculation processes of PSMD follows the program described by Baykara et al. (7–9)1 (Data is showed in Figures 2–4).
Initial MR examination, PSMD skeletonization images, and 3D PSMD skeletonization images of a 59-year-old patient in the progressive group. (1) PSMD skeletonization images were calculated, axial skeleton images of MD from top to base of the skull and 3D PSMD skeleton image. (2) 3D PSMD skeletonization images in axial, sagittal, and coronal orientations.
A 59-year-old patient in the progressive group at initial (1A) and follow-up time points (1B). MD images were projected to skeleton images and the related histogram figures. PSMD histogram analysis of the MD data is calculated as the difference between the 95th and 5th percentiles.
A 56-year-old patient in the stable group at initial (2A) and follow-up (2B) time points. MD images were projected to skeleton images and the related histogram figures. PSMD histogram analysis of the MD data is calculated as the difference between the 95th and 5th percentiles.
Image analysis: WML Fazekas scale evaluation
One neuroradiologist with 9 years of experience was highly trained before reviewing images and recording WML locations and ratings.
A WML was defined as a signal abnormality of variable size in the white matter consisting of hyperintensity on FLAIR without cavitation and decreased signal on T1-weighted images, according to previous studies (2). Fazekas scale (0–3 points) was used as follows: grade 0 (normal), grade 1 (spot lesion), grade 2 (fusion lesion), and grade 3 (large fusion lesion) (13).
Statistics
After passing the variance equality test, paired sample t-tests were used to compare the longitudinal differences in WML score and PSMD within the two groups (the comparison is the difference between initial and follow-up time for the progressive group and stable group). p < 0.05 was statistically significant. Two-sample t-test of WML and PSMD was used to compare the horizontal difference between the two groups at two time points (initial and follow-up). Covariance analysis was used to remove the influence of different follow-up time. Further, the ΔPSMD difference was also compared by covariance analysis, as was ΔWML (WML changes of follow-up and initial time point).
Pearson’s correlation was used for correlation of eGFR with PSMD and WML, and Pearson’s correlation was also used for correlation of ΔGFR with ΔPSMD and ΔWML.
AUC curves were plotted to explore which parameter is better for the classification of progressive group and stable group.
We conducted the statistical analysis using SPSS VERSION 27 software.
Results
Participants
In all, 50 patients with CRF were enrolled and classified into a progressive group (n = 16) and stable group (n = 34). There was no significant difference between the two groups with respect to age, sex, hypertension, diabetes, and smoking status. Covariance analysis was used to compare data between groups without the influence of follow-up time.
PSMD
Longitudinal comparison at different time points in the same group
In the progressive group, PSMD at the follow-up time point was significantly higher than PSMD at the initial time point (p < 0.001). There is no significant difference between two time points of the stable group (p = 0.130) (Data is showed in Figure 5).
PSMD and WML differences were compared between the progressive and stable groups at the same time point, and comparison within groups at the initial and follow-up time points: at the follow-up time point, PSMD of the progressive group was significantly higher than at the initial time point (p < 0.001), and PSMD of the progressive group was significantly higher than that of the stable group (p < 0.001).
Horizontal comparison between the two groups at same time points
At the follow-up time point, the PSMD of progressive group was significantly higher than the PSMD of stable group (p < 0.001).
At the initial time point, there was no significant difference between the two groups (p = 0.629) (Data is showed in Figure 5).
ΔPSMD (PSMD changes of follow-up time point and the initial time point)
The PSMD of the progressive group showed significantly higher increase than the stable group (p < 0.001).
WML
Only WMLs in the progressive group were exacerbated, there was no significant difference between the two groups at the same time point.
Longitudinal comparison at different time points in the same group
WMLs in the progressive group were exacerbated at follow-up compared to the initial exam (p = 0.029).
There was no significant difference between the initial time point and follow-up time point of the stable group (p = 0.083) (Data is showed in Figure 5 and Table 2).
Horizontal comparison between the two groups at the same time points
At two time points, there was no significant difference between the two groups either at the initial time point (p = 0.544) or at the follow-up time point (p = 0.127) (Data is showed in Figure 5 and Table 3).
ΔWML (WML changes to follow-up time point and initial time point)
ΔWML of progressive group significantly higher than stable group (p = 0.032).
Pearson’s correlation for eGFR with PSMD and WML
Initial PSMD with initial eGFR, follow-up PSMD with follow-up eGFR, PSMD with ÄGFR all significantly correlated respectively (Pearson correlation coefficients were −0.405, −0.445, and −0.438, respectively). Follow-up WML was significantly correlated to follow-up eGFR (Pearson correlation coefficient was 0.352) (Data is showed in Table 4).
AUC curve results
The highest AUC is ΔPSMD (0.912), the second-highest AUC is follow-up PSMD (0.829) (Data is showed in Figure 6).
AUC was used to measure the sensitivity of PSMD and WML score to changes in eGFR. The highest AUC was of ΔPSMD (0.912), and the second-highest AUC was of the follow-up PSMD (0.829). AUC curve showed that ΔPSMD (PSMD changes of follow-up time point and the initial time point) and follow-up PSMD were better for the classification of progressive group and stable group.
Discussion
This is a study about using PSMD to study the relationship between renal failure and cerebral small vessel disease. Results of this study supported the stability of PSMD as an MR biomarker for cerebrovascular disease, especially sensitive to small vessel-related white matter abnormalities. This study found out that with deterioration of renal function, as reflected by decreased eGFR, the PSMD increases more in the progressive group than the stable group. PSMD is a more sensitive biomarker than WML score. These observations suggest that PSMD increased with CRF progressed.
PSMD has been proved to be a sensitive biomarker for small vessel disease (14–19). DTI images are more sensitive than conventional MRI T1W, T2W, and FLAIR images in detecting white matter changes. Histograms of MR parameter values measured in the whole brain are increasingly being used to characterize subtle disease that affects large parts of the brain. Based of DTI, PSMD uses MD skeletonization and histogram analysis, so it is advantageous in assessing the effect of CRF of cerebral small vessel white matter lesions (1). Studies have shown that histogram peak height measures were associated with cognitive function and CSVD (20).
Chronic renal failure and PSMD and white matter lesions
Kidney hemodynamics are similar to that of brain, as both of their vascular beds have very low resistance and are sensitive to fluctuations in blood pressure. Moreover, it is widely accepted that chronic renal insufficiency is an independent risk factor for cerebrovascular disease (4, 21).
In this study, PSMD results support previous studies that PSMD is sensitive to small vessel-related white matter abnormalities (9). PSMD showed higher AUC than WML Fazekas scale scores, indicating that PSMD is a more sensitive MR biomarker to detect white matter lesion. Additionally, at the follow-up time point, PSMD detected worse white matter lesion in the progressive than stable group. eGFR is a reliable indicator of renal function, and is commonly used clinically to assess and monitor kidney function.
Relationship of PSMD and renal function
The results of the this study are consistent with these conclusions, specifically that declining renal function, the greater the degree of white matter degeneration, the higher the PSMD value (4, 20, 21).
The clinical application of PSMD
CSVD is increasingly recognized as a significant contributor to vascular cognitive disorders, including mild cognitive impairment and vascular dementia. The early detection of CSVD is pivotal for initiating targeted interventions that may include pharmacological treatments, lifestyle modifications, and cognitive training. These interventions are essential for mitigating the progression of cognitive impairment. Moreover, to deepen the understanding of the linkages between CSVD and CKD and explore novel diagnostic and therapeutic modalities. Collectively, these efforts contribute to the advancement of patient care and the overall improvement of clinical outcomes in the management of CKD and CSVD.
Conclusion
This study is a first attempt to try to explore the progression of WML in CRF with PSMD. Previously, PSMD technology was rarely used to study the situation of cerebral small vessel disease in renal failure patients. This study revealed two important findings. Firstly, this study certificated that PSMD is closely related to eGFR and CRF. This study expands the understanding of the link between cerebral small vessel disease and renal failure. Secondly, there is bold speculation that when white matter lesions progress, renal function in patients with CRF may correspondingly decline. Conversely, when CRF declines, CSVD may also progress and is require more careful attention of physicians and patients. But imitated to the numbers of participants and follow-up time, these speculations require further validation in future large-sampled studies.
The reference list from the paper itself. Each links out to its DOI / PubMed record.
- 1Arba F Quinn T Hankey GJ Ali M Lees KR Inzitari D. Cerebral small vessel disease, medial temporal lobe atrophy and cognitive status in patients with ischaemic stroke and transient ischaemic attack. Eur J Neurol. (2017) 24:276–82. doi: 10.1111/ene.13191, PMID: 27862654 · doi ↗ · pubmed ↗
- 2Doubal FN Mac Lullich AM Ferguson KJ Dennis MS Wardlaw JM. Enlarged perivascular spaces on MRI are a feature of cerebral small vessel disease. Stroke. (2010) 41:450–4. doi: 10.1161/STROKEAHA.109.56491420056930 · doi ↗ · pubmed ↗
- 3Wardlaw JM Smith C Dichgans M. Small vessel disease: mechanisms and clinical implications. Lancet Neurol. (2019) 18:684–96. doi: 10.1016/S 1474-4422(19)30079-131097385 · doi ↗ · pubmed ↗
- 4Wardlaw JM Smith EE Biessels GJ Cordonnier C Fazekas F Frayne R. Neuroimaging standards for research into small vessel disease and its contribution to ageing and neurodegeneration. Lancet Neurol. (2013) 12:822–38. doi: 10.1016/S 1474-4422(13)70124-8, PMID: 23867200 PMC 3714437 · doi ↗ · pubmed ↗
- 5Vogels SC Emmelot-Vonk MH Verhaar HJ Koek HL. The association of chronic kidney disease with brain lesions on MRI or CT: a systematic review. Maturitas. (2012) 71:331–6. doi: 10.1016/j.maturitas.2012.01.00822318093 · doi ↗ · pubmed ↗
- 6Mogi M Horiuchi M. Clinical interaction between brain and kidney in small vessel disease. Cardiol Res Pract. (2011) 2011:306189. doi: 10.4061/2011/30618921274446 PMC 3025374 · doi ↗ · pubmed ↗
- 7Baykara E Gesierich B Adam R Tuladhar AM Biesbroek JM Koek HL. A novel imaging marker for small vessel disease based on skeletonization of white matter tracts and diffusion histograms. Ann Neurol. (2016) 80:581–92. doi: 10.1002/ana.24758, PMID: 27518166 · doi ↗ · pubmed ↗
- 8Beaudet G Tsuchida A Petit L Tzourio C Caspers S Schreiber J. Age-related changes of peak width skeletonized mean diffusivity (PSMD) across the adult lifespan: a multi-cohort study. Front Psychiatry. (2020) 11:342. doi: 10.3389/fpsyt.2020.0034232425831 PMC 7212692 · doi ↗ · pubmed ↗