Single-cell transcriptomics reveals the cellular identity of a novel progenitor population crucial for murine neural tube closure
Zihao Deng, Marina R. Carpinelli, Tariq Butt, Graham W. Magor, Peinan Zhao, Kevin R. Gillinder, Andrew C. Perkins, Stephen M. Jane

TL;DR
Single-cell analysis identifies a new progenitor cell population critical for mouse neural tube closure and spina bifida prevention.
Contribution
Discovery of a novel progenitor population defined by co-expression of Grhl3, Tfap2a, and Tfap2c essential for neural tube closure.
Findings
Co-expression of Grhl3, Tfap2a, and Tfap2c defines a novel progenitor population in surface ectoderm crucial for neural tube closure.
Deletion of Grhl3 in this population or Tfap2c in Grhl3-expressing cells causes spina bifida in mice.
Findings highlight the importance of a specific neural plate border cell cohort in early neurulation.
Abstract
Neural tube closure in vertebrates is achieved through a highly dynamic and coordinated series of morphogenic events involving neuroepithelium, surface ectoderm, and neural plate border. Failure of this process in the caudal region causes spina bifida. Grainyhead-like 3 (GRHL3) is an indispensable transcription factor for neural tube closure as constitutive inactivation of the Grhl3 gene in mice leads to fully penetrant spina bifida. Here, through single-cell transcriptomics we show that at E8.5, the time-point preceding mouse neural tube closure, co-expression of Grhl3, Tfap2a, and Tfap2c defines a previously unrecognised progenitor population of surface ectoderm integral for neural tube closure. Deletion of Grhl3 expression in this cell population using a Tfap2a-Cre transgene recapitulates the spina bifida observed in Grhl3-null animals. Moreover, conditional inactivation of Tfap2c…
Genes, proteins, chemicals, diseases, species, mutations and cell lines named across the full text — each resolved to its canonical identifier and authoritative record.
Click any figure to enlarge with its caption.
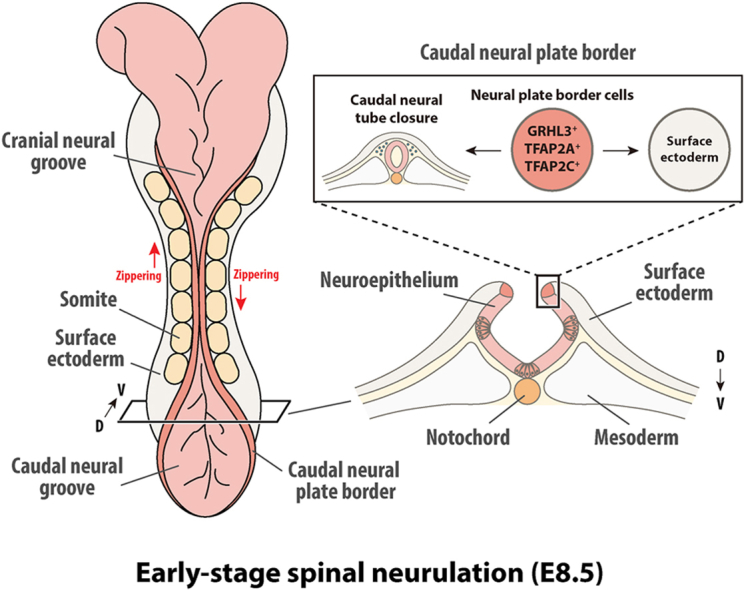 Figure 1
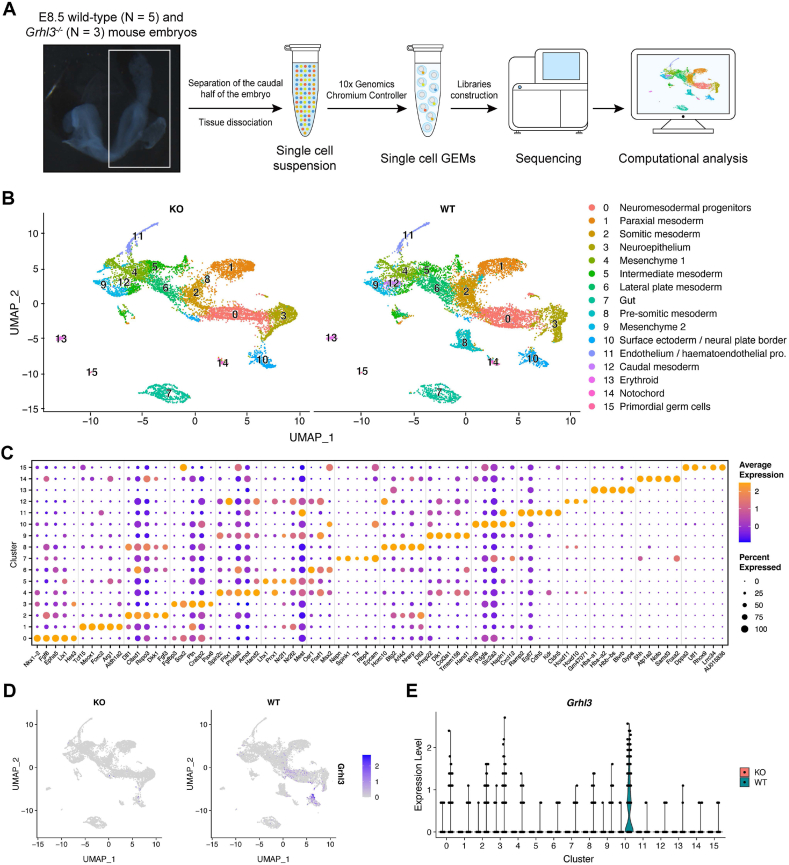 Figure 2
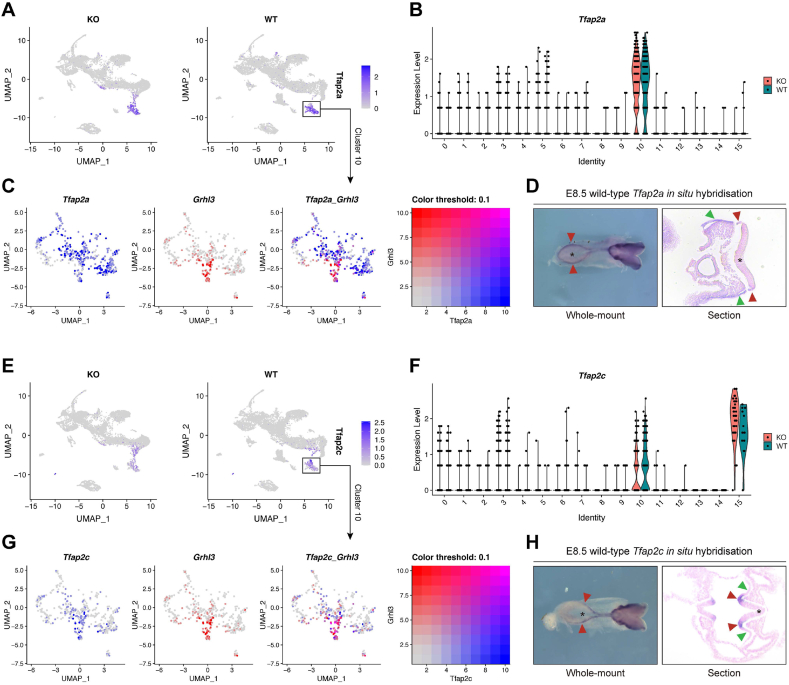 Figure 3
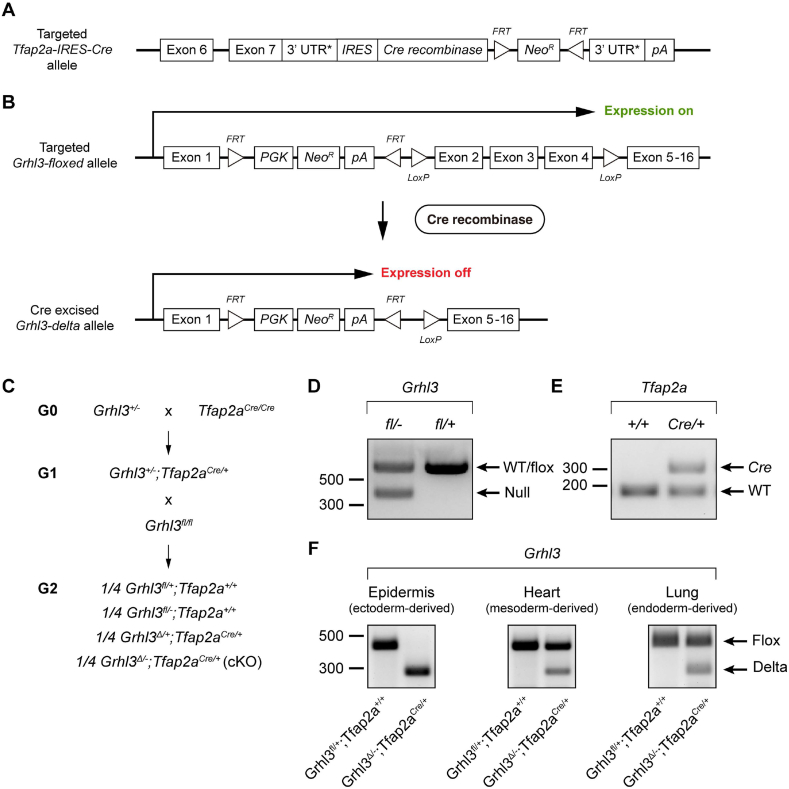 Figure 4
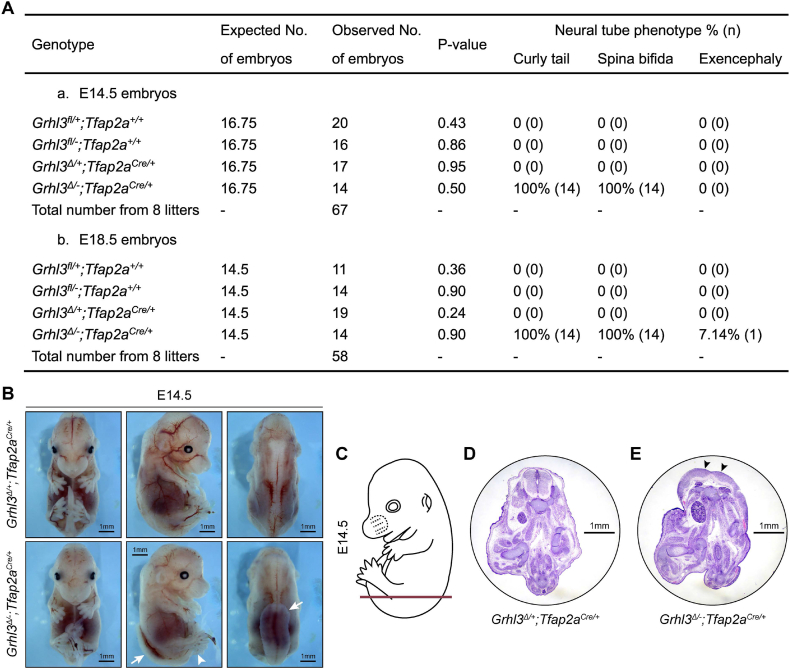 Figure 5
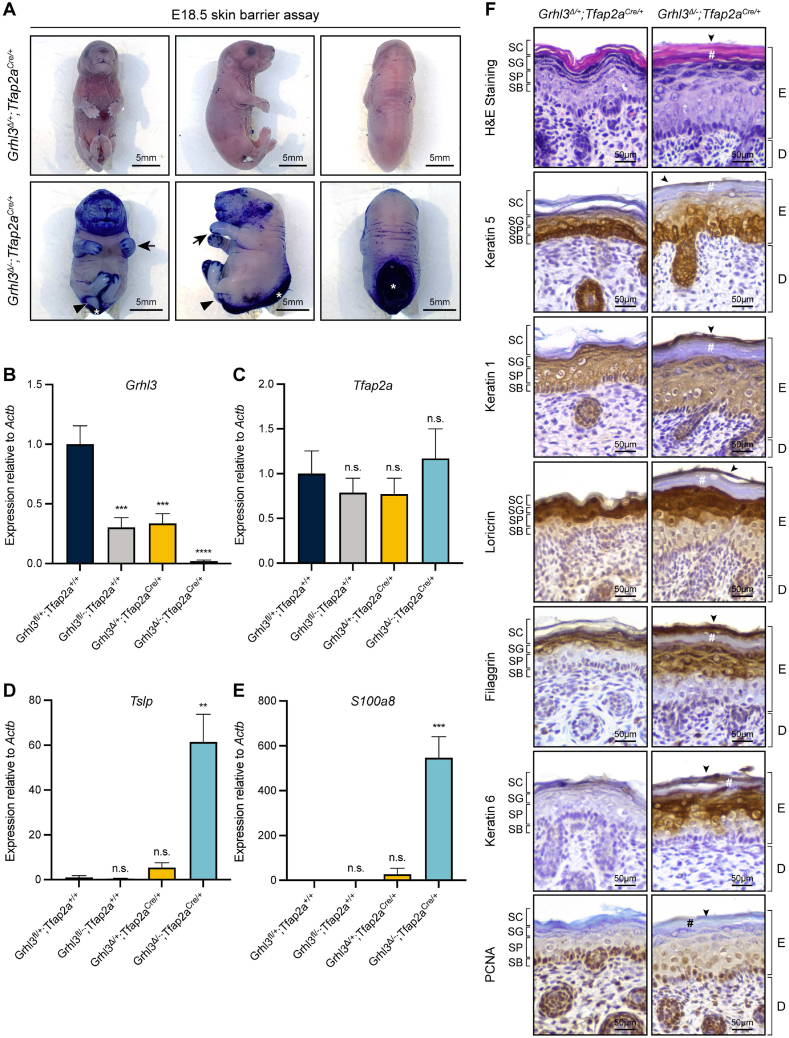 Figure 6
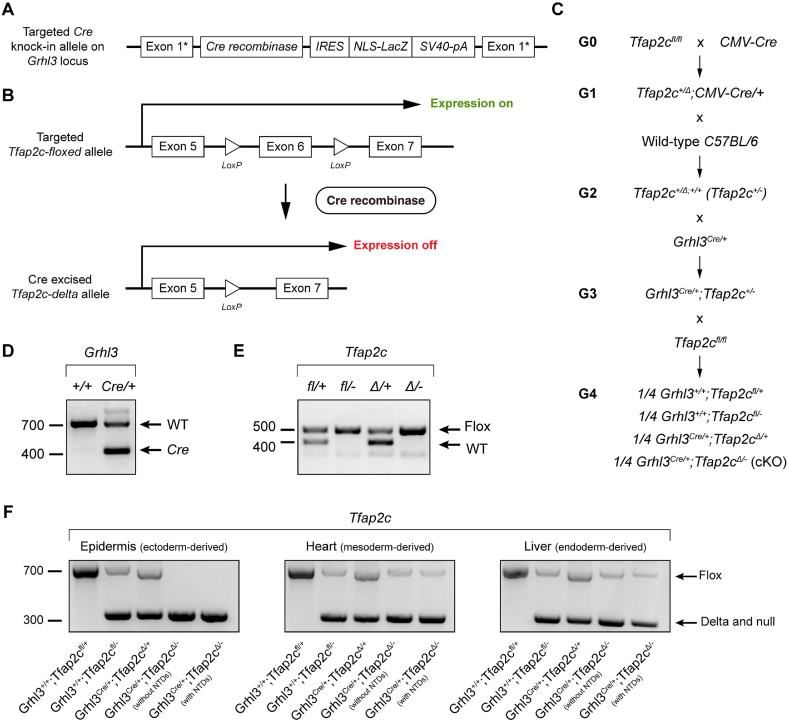 Figure 7
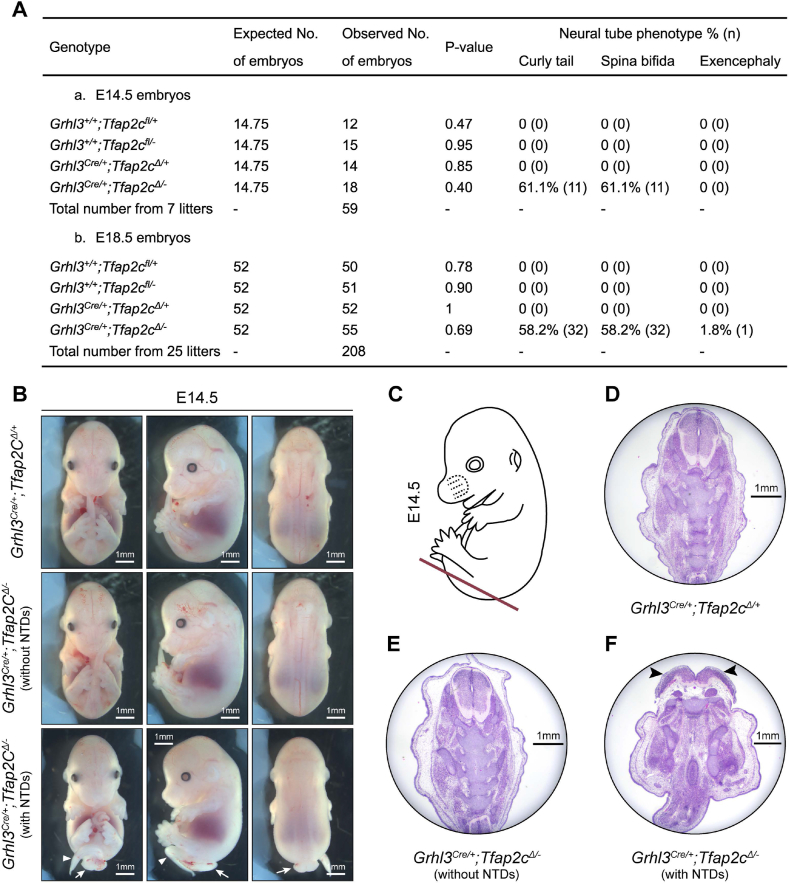 Figure 8
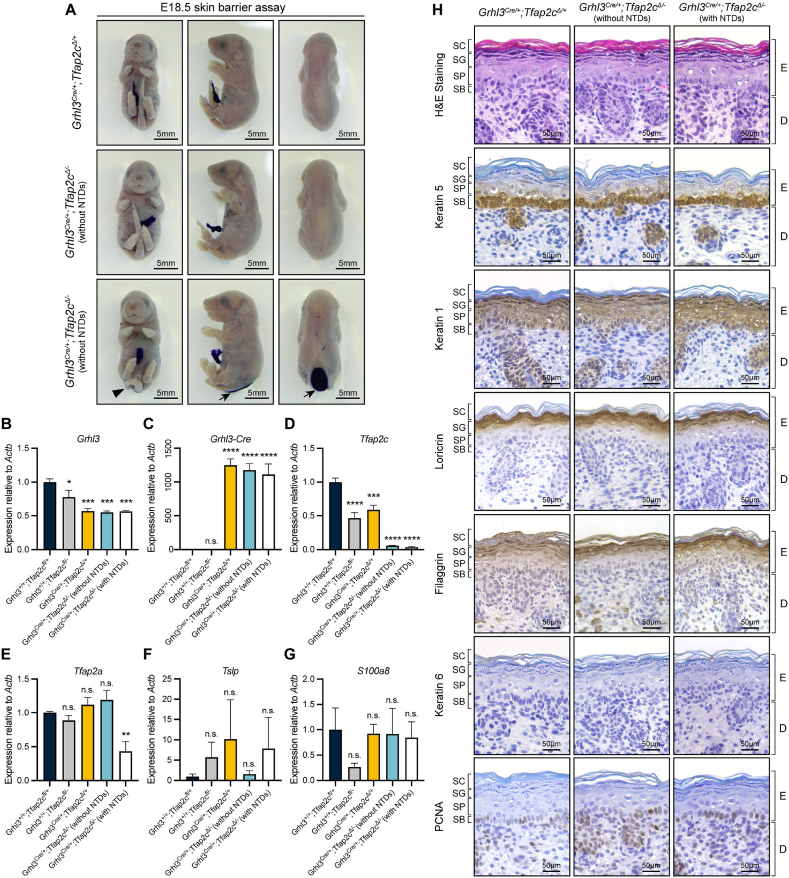 Figure 9
Peer Reviews
No public reviews on file for this paper yet. If you reviewed it on a platform where reviews are public (OpenReview, ICLR, NeurIPS, ICML), you can paste yours below so the community can read it here.
Videos
No videos yet. Explain this paper in a talk, walkthrough, or lecture? Add one.
Taxonomy
TopicsSingle-cell and spatial transcriptomics · Congenital heart defects research · Neurogenesis and neuroplasticity mechanisms
Introduction
1
Neural tube defects (NTDs) are a group of severe congenital malformations of the central nervous system that arise from neural tube dysmorphogenesis [1]. Open NTDs manifest as exposure of the spinal cord or brain due to failure in neural tube closure, a process in which the neural plate forms a closed tubular structure to provide a morphological scaffold for the development of the central nervous system [2]. Neural tube closure-related open NTDs are classified into three subtypes: anencephaly (failure of neural plate closure at the cranial region), spina bifida (failure of neural plate closure at the spinal region) and craniorachischisis (where the entire tube largely remains open along the cranial-caudal axis) [[3], [4], [5]]. Occurring between day 22 and 26 post-fertilisation in human and between embryonic day (E) 8.5 to E10.0 in mouse, neural tube closure is a critical developmental milestone in early embryogenesis [1,6]. Neural tube closure is achieved through a highly dynamic and coordinated series of morphogenic events in which a pair of apposed epithelial sheets progressively join together by ‘zippering’ along the cranial-caudal axis to create a hollow tubular structure [6]. This complex developmental process involves drastic cellular and molecular changes in neuroepithelium, the adjacent surface ectoderm and the interface of these two tissues, which is commonly referred to as the neural plate border.
Grainyhead-like 3 (GRHL3), a member of the family of GRHL transcription factors, is among one of the most crucial genes required for neural tube closure in both mouse and human [7,8]. Constitutive inactivation of its expression in murine embryogenesis leads to failures in dorsolateral hinge points formation and subsequently in caudal neural tube closure, resulting in fully penetrant thoraco-lumbo-sacral spina bifida. Additionally, Grhl3-null mice display occasional exencephaly, the embryonic precursor of anencephaly, soft-tissue syndactyly due to abnormal periderm morphogenesis, and a short longitudinal embryonic axis due to defects in the planar cell polarity pathway [7,[9], [10], [11]]. Grhl3-null mice die soon after birth of excessive transepidermal water loss due to defective skin barrier formation and show impaired keratinocyte differentiation and disrupted epidermal architecture [9,12]. Moreover, the curly tail (ct) mouse strain, an extensively utilised classical model of NTDs for more than five decades, carries a hypomorphic allele of Grhl3 and displays incompletely penetrant caudal NTDs [7,13,14]. In humans, mutations in GRHL3 have been identified as a major predisposing factor for developing spina bifida with several de novo and inherited variants in GRHL3 reported in patients with NTDs [15,16].
Despite the identification of GRHL3 as an indispensable factor for neural tube closure, the molecular mechanisms by which GRHL3 induces this complex morphogenic process remains largely enigmatic. At E8.5, the developmental time-point preceding murine neural tube closure, Grhl3 is highly and predominantly expressed along the caudal neural plate border, with expression expanding to the entire surface ectoderm by E10.5 [7,17,18]. In addition, Grhl3 is expressed at a low level in the node-streak border (NSB) and caudo-lateral epiblast (CLE) regions, where neuromesodermal progenitors (NMPs) are found, and at low levels in the neuroepithelium at E8.5 [19]. Between E9.0-E9.5, Grhl3 is expressed mosaically in neuroepithelium of the open posterior neuropore [13,19,20], and at E10.0-E10.5, expression is undetectable in neuroepithelium, but emerges within the hindgut endoderm [13,19]. De Castro et al. [19] have explored which of these Grhl3 expression sites are critical for neural tube closure by specifically inactivating Grhl3 expression in hindgut endoderm using the Sox17-Cre, in neuroepithelium and NMPs using the Nkx1-2-Cre, and in all these sites using both drivers. Only embryos with Grhl3 expression inactivated in hindgut endoderm showed mild caudal NTDs with incomplete penetrance due to excessive caudal curvature [19]. Although this finding indicates that hindgut endoderm-specific Grhl3 function is required for spinal neurulation, Grhl3 is not expressed at this site until E10.0, suggesting that the early stage of neural tube morphogenesis must require Grhl3-expression elsewhere. Given that at E8.5, Grhl3 expression is largely confined to the neural plate border territory [18], it is conceivable that loss of Grhl3 expression at this site may underpin Grhl3-null caudal NTDs. This is in keeping with recent studies showing that loss of Grhl3 expression is correlated with the loss of lamellipodia and other cellular structures in neural plate border cells that are critical for caudal neural tube closure [7,21,22].
The importance of the neural plate border cell population has also been defined in tissue explant studies in chicken. Selective removal of the neural plate border cells from explant chick neural plates in vitro, prevented neural plate folding and tube closure, despite successful midline longitudinal furrowing of the plate. However, if the neural plate border was left intact, even with the adjacent surface ectoderm removed, the neural plate folded and closed normally [[23], [24], [25]], indicating that the small cohort of neural plate border cells where Grhl3 is expressed at E8.5 provides sufficient inductive and mechanical contributions for complete neural tube closure. In keeping with this, Jaffe and Niswander [21] showed that Grhl3-null mice did not display any patterning and integrity defect in surface ectoderm during spinal neurulation. In contrast, other studies have suggested that abnormal surface ectoderm development, coupled with altered mechanical properties underpin Grhl3-null NTDs [17,19,26], leaving significant uncertainty as to the critical population for Grhl3-induced neural tube closure.
To address this, we have now employed single-cell RNA sequencing (scRNA-seq) to investigate the transcriptomic profiles of specific cell populations in wild-type (WT) and Grhl3-null mouse embryos at E8.5 (the 6-7-somite stage). We found that Grhl3 is co-expressed with transcription factor genes Tfap2a and Tfap2c in the neural plate border territory. RNA velocity analysis predicted that the neural plate border cell cohort marked by the co-expression of Grhl3, Tfap2a, and Tfap2c is a novel progenitor population of surface ectoderm. Deletion of a conditional allele of Grhl3 using a mouse line expressing Cre recombinase expressed from Tfap2a regulatory elements recapitulated the spina bifida observed in constitutive Grhl3-null animals. Moreover, conditional inactivation of Tfap2c expression in Grhl3-expressing neural plate border cells also caused caudal neural tube defects, demonstrating a clear de-association between neurulation and surface ectoderm development. These findings suggest that at the initiation of neural tube closure, Grhl3-expressing neural plate border cells are neither committed surface ectoderm nor neuroepithelial/neural crest cells, but a previously unidentified progenitor population that plays a necessary and sufficient inductive role in the early-stage spinal neurulation.
Results
2
Single-cell transcriptomics profiling of E8.5 mouse embryo
2.1
To examine the transcriptomic profiles of cell populations crucial for neural tube closure, we harvested E8.5 (the 6-7-somite stage) WT and Grhl3-null mouse embryos to generate single cell suspensions from the caudal half of these embryos for droplet-based scRNA-seq (Fig. 1A). At the sequencing depth of 400 million reads per library, we captured 24,239 cells with the average depth of 74,836 reads and 5537 genes detected per cell. After stringent quality control and filtering using Seurat, the final scRNA-seq dataset contained 20,196 cells. Unsupervised clustering identified 16 major cell types with distinct gene expression profiles that were projected onto Uniform Manifold Approximation and Projection (UMAP, Fig. 1B). Each cluster was evaluated and annotated based on a set of differentially expressed genes (DEGs) that are known to mark the specific cell population (Fig. 1C and Table S1) [27]. These 16 clusters encompass cell populations originating from all three germ layers and their major derivatives, including six mesoderm populations, two ectoderm clusters and the endoderm derived gut tube (Fig. 1B). This indicates normal germ layer specification in both WT and Grhl3-null embryos, in keeping with the unaffected embryonic patterning in the null animals [12]. Of note, the scRNA-seq also identified a cluster of NMPs (Cluster 0), a progenitor population that contributes to both ectodermal and mesodermal lineages post gastrulation [28]. Next, we sought to delineate the specific Grhl3-expressing cellular populations at this stage by interrogating its expression pattern in the WT dataset. In keeping with the prior expression analyses [18,19], Grhl3 is predominantly expressed in the surface ectoderm and neural plate border population (Cluster 10), and at a much lower level in NMPs (Cluster 0) and neuroepithelium (Cluster 3) at E8.5 (Fig. 1D–E).Fig. 1. Single-cell RNA sequencing delineates diverse cell types in the caudal half of E8.5 mouse embryo. (A) Schematic diagram showing the workflow of scRNA-seq analysis on the caudal half of E8.5 wild-type (N = 5) and Grhl3^−/−^ (N = 3) embryos. (B) UMAP mapping of 20,196 cells from the scRNA-seq after quality control and filtering with unbiased clustering distinguished 16 cellular clusters. (C) Dot plot displaying expression profiles of top 5 differentially expressed genes from each cluster. The marker genes shared by multiple clusters are omitted from the plot. The size of a dot reflects the percentage of cells in a cluster that express the gene; the colour of a dot represents expression level of the gene. (D) UMAP showing the expression distribution and level of Grhl3. (E) Violin plot showing the expression distribution and level of Grhl3.Fig. 1
Single-cell transcriptomics reveals novel cell signatures of Grhl3-expressing cells
2.2
To further examine the cellular identity of the minute cohort of Grhl3-expressing neural plate border cells seen in Fig. 1D, we identified genes that are co-expressed with Grhl3 in this cohort at E8.5. Firstly, we performed a gene co-expression correlation analysis on Grhl3 in Cluster 10 (surface ectoderm and neural plate border) only. In total, 18 top associated co-expression genes were identified, of which 16 genes showed positive correlations while two genes showed negative correlations with Grhl3 expression in Cluster 10 (Fig. S1A). Importantly, we noted that some of these genes are known to play important roles in neural tube closure, including Cldn3 [29], F2rl1 [30], Gadd45a [31], Dlx5 [32], Bmp5 [33], Pax3 [34,35], and Epha4 [36]. Interestingly, we also saw several genes in this list, including Tfap2c [37], Sox2 [38], Dlx5 [39], Bmp5 [40], Pax3 [41], and Epha4 [42], that are required for the development of neural crest cells. These findings illustrate that the Grhl3-expressing cell population in Cluster 10 resides within a region that shows remarkable developmental complexity and multipotency.
Of the 18 top co-expression genes, one gene, Tfap2c, is a well-characterised gene that demarcates the neural plate border domain at this stage, in keeping with its indispensable role in neural crest induction [43]. In a mouse model, constitutive inactivation of Tfap2c expression led to early embryonic lethality between E7.5 and E8.5 due to defective extra-embryonic membrane and placenta development [44], while specific inactivation of Tfap2c expression in Sox2-expressing cells caused a low penetrant curly tail phenotype [45], suggesting that apart from neural crest development, Tfap2c may also play a role in neural tube closure. Of note, its duplicated paralog gene, Tfap2a, is also a gene that marks the neural plate border territory during neurulation [46]. The transcription factors encoded by these two paralogs are both required for early neural crest specification from neural plate border territory as shown in chicken, zebrafish, and Xenopus studies [37,[47], [48], [49]]. Interestingly, in contrast to Tfap2c-null animals, Tfap2a-null mouse embryos exhibited a profound exencephaly phenotype with curly tail [50,51]. Moreover, a recent study has shown that Grhl3 and Tfap2a genetically interact to induce neural tube closure in mouse, as loss of one allele of both genes is sufficient to cause both cranial and caudal NTDs [51].
We therefore examined the overall and Cluster 10-specific expression patterns of Tfap2a and Tfap2c in our scRNA-seq dataset. Our UMAP mapping clearly delineated the largely confined Tfap2a expression in Cluster 10 (Fig. 2A–B). Apart from a cohort of cells that co-express Grhl3 and Tfap2a, however, there are additional cells that do not express Grhl3 but also reside in this cluster and express Tfap2a (Fig. 2C). This is explained by our WISH showing Tfap2a expression was not only present in the neural plate border, but also widely distributed in surface ectoderm (Fig. 2D), whereas Grhl3 is not at this timepoint [18]. Although Tfap2c is also expressed in primordial germ cells at this stage (Cluster 15, Fig. 2E–F), Tfap2c expression is largely co-localised with Grhl3 expression in Cluster 10 (Fig. 2G). Most importantly, as opposed to Tfap2a which displays more widespread expression at E8.5, the Tfap2c expression domain is confined to the neural plate border territory, and no Tfap2c expression was detected in surface ectoderm (Fig. 2G–H). This expression pattern highly mirrors Grhl3 expression in neural plate border at E8.5 [18]. Of note, the expression pattern and level of both Tfap2a and Tfap2c are normal in Grhl3-null embryos (Fig. 2B and F).Fig. 2Grhl3 is co-expressed with the classic hallmark genes of neural plate border, Tfap2a and Tfap2c, at E8.5. (A) UMAP showing the expression distribution and level of Tfap2a. (B) Violin plot showing the expression distribution and level of Tfap2a. (C) UMAP mappings of Cluster 10 only showing the co-expression of Grhl3 with Tfap2a. (D) Whole-mount in situ hybridisation confirming the expression pattern of Tfap2a in E8.5 wild-type mouse embryo. Red triangles, neural plate border; green triangles, surface ectoderm; asterisk, neuroepithelium. (E) UMAP showing the expression distribution and level of Tfap2c. (F) Violin plot showing the expression distribution and level of Tfap2c. (G) UMAP mappings of Cluster 10 only showing the co-expression of Grhl3 with Tfap2c. (H) Whole-mount in situ hybridisation confirming the expression pattern of Tfap2c in E8.5 wild-type mouse embryo. Red triangles, neural plate border; green triangles, surface ectoderm; asterisk, neuroepithelium.Fig. 2
Co-expression of Grhl3, Tfap2a, and Tfap2c defines a previously unrecognised cell population
2.3
Given our finding of the co-expression of Grhl3, Tfap2a, and Tfap2c, and the fact that Tfap2a and Tfap2c are critical genes for neural crest specification from neural plate border, we next examined the expression patterns of several genes involved in neurulation and/or in neural crest development. Notably, our scRNA-seq showed that at E8.5, although Grhl3-expressing neural plate border cells express surface ectoderm progenitor markers Krt8, Pdgfa, Epcam, and Wnt6, they express neither committed surface ectoderm markers Krt5 and Trp63 nor neuroepithelium markers Fgfbp2 and Nkx6-1 (Fig. S1B). However intriguingly, these cells express the characteristic markers of neural crest progenitors and early neural crest genes Sox2, Pax3, Pax7, and Tfap2b (Figs. S1A–B) but not the neural crest cell specifiers Sox9 and Snai2 (Fig. S1B). This finding is surprising as the Grhl3-null animals exhibit normal neural crest development [7,9]. These findings suggest that Grhl3 expression distinguishes a unique neural plate border cell population from committed surface ectoderm, neuroepithelium and neural crest identities, but defines a previously unrecognised population critical for neural tube closure.
To further examine this novel cell population marked by the co-expression of Grhl3, Tfap2a and Tfap2c, we applied RNA velocity analysis to our scRNA-seq dataset to dissect the gene-specific transcriptional and cellular dynamics within this cell cohort [52]. RNA velocity analysis measures the relative abundance of un-spliced nascent RNA and spliced mature RNA and uses this information to predict the differentiation dynamics of cells. In WT surface ectoderm and the neural plate border cluster, Velocyto identified a clear root of differentiation (Figs. S2A–B), which contributed to the surface ectoderm and neural plate border populations. In Grhl3-null embryos, it is apparent that this normal differentiation program has been significantly compromised, as evidenced by the ambiguous differentiation trajectories (Figs. S2A–B). Intriguingly, without Grhl3 expression, the neural plate border cell cohort lost its neural plate border configuration and shifted its identity towards surface ectoderm (Figs. S2B–C). We next assessed the splicing patterns of Grhl3, Tfap2a, and Tfap2c transcripts in the surface ectoderm and neural plate border cluster by plotting the un-spliced residuals of each gene (Fig. S2D). In WT cells more un-spliced Grhl3, Tfap2a, and Tfap2c transcripts are located within or in the vicinity of the identified differentiation origin, whereas no similar significant pattern was identified in the constitutive null population (Fig. S2D). These RNA velocity estimates are also supported by the Monocle 3 analysis, which showed a differentiation trajectory from the Grhl3-expressing neural plate border cells to the surface ectoderm lineage (Fig. S3) [53]. Together, these predictions suggest that the neural plate border cell cohort marked by Grhl3, Tfap2a, and Tfap2c expression is a novel progenitor population of surface ectoderm.
Loss of GRHL3 in Tfap2a-expressing cells recapitulates all Grhl3-null defects
2.4
At E8.5, the time of the initiation of neurulation in mouse, Grhl3 and Tfap2a display overlapping expression only in the neural plate border domain (Fig. 2C–D). We therefore used Tafp2a as a driver of the Cre recombinase gene expression to conditionally inactivate Grhl3 in the neural plate border cell population. To achieve this, we crossed the Grhl3^+/−^ mice to a line in which the Cre recombinase gene has been integrated into the 3′UTR of the endogenous Tfap2a locus (Tfap2a^Cre/Cre^, Fig. 3A and C) [54]. This Tfap2a-Cre cassette also contains an IRES and is inserted upstream of the endogenous Tfap2a poly-adenylation signal, allowing the Cre recombinase gene to be expressed through Tfap2a regulatory elements with normal endogenous gene function unaffected (Fig. 3A) [54]. Previous lineage analysis has demonstrated that during neurulation, Tfap2a-Cre activity also occurs in ectoderm, especially in the pharyngeal arch ectoderm [54]. This cross generated a line heterozygous for both Grhl3 and Tfap2a-Cre (Grhl3^+/−^;Tfap2a^Cre/+^), which was then crossed to a Grhl3^fl/fl^ line to generate Cre-heterozygotes carrying one Grhl3 floxed allele with either a WT Grhl3 allele or a Grhl3-null allele (Fig. 3B–E). With the presence of the Cre recombinase, the floxed Grhl3 region which contains exon 2–4 was excised, generating a Grhl3 delta allele in Cre-positive mice (Grhl3^Δ/+^;Tfap2a^Cre/+^ and Grhl3^Δ/-^;Tfap2a^Cre/+^, Fig. 3B–E). Analysis of genomic DNA from tissues derived from each germ layer indicated that a complete deletion of exons 2–4 of Grhl3 was only observed in surface ectoderm (Fig. 3F).Fig. 3. Generation of Grhl3^flox^;Tfap2a^Cre^ mouse model. (A) Schematic diagram showing the gene-targeting strategy for making the Tfap2a-IRES-Cre allele. The IRES-Cre cassette was inserted into the 3′UTR of Tfap2a locus. (B) When the Tfap2a-Cre is expressed, the LoxP-flanked Grhl3 region, which contains exon 2 to exon 4, will be deleted. (C) Schematic diagram showing the breeding strategy for generating Grhl3^flox^;Tfap2a^Cre^ embryos. G0 Grhl3 heterozygotes were crossed to Tfap2a^Cre/Cre^ mice to generate G1 double heterozygotes, which were then crossed to Grhl3^fl/fl^ mice to generate offspring with four different genotypes. (D) PCR genotyping of wild-type/floxed allele and null allele of Grhl3 locus. (E) PCR genotyping of Tfap2a-Cre allele and wild-type Tfap2a allele. (F) PCR products of floxed allele and delta allele of Grhl3 locus amplified from a representative organ or tissue derived from each of the three germ layers.Fig. 3
In E14.5 and E18.5, embryos with all possible genotypes (Grhl3^fl/+^;Tfap2a^+/+^, Grhl3^fl/-^;Tfap2a^+/+^, Grhl3^Δ/+^;Tfap2a^Cre/+^, and Grhl3^Δ/-^;Tfap2a^Cre/+^) were present in a normal Mendelian ratio, indicating an absence of early embryonic lethality (Fig. 4A). To assess the outcome of neural tube morphogenesis in Grhl3^Δ/-^;Tfap2a^Cre/+^ conditional knockout (cKO) animals, we firstly harvested embryos at E14.5 to examine their gross phenotype. As expected, Grhl3^Δ/-^;Tfap2a^Cre/+^ cKO embryos showed a complete penetrance of curly tail and thoraco-lumbo-sacral spina bifida, mirroring the NTDs observed in Grhl3-null embryos [7,9]. In contrast, Grhl3^Δ/+^;Tfap2a^Cre/+^ control embryos had normal neural tube closure (Fig. 4B). Transverse sectioning of Grhl3^Δ/-^;Tfap2a^Cre/+^ cKO embryos at the low thoracic and lumbosacral region showed a convex caudal neural plate (Fig. 4C–E), which also phenocopied the malformed neural plate observed in constitutive Grhl3-null embryos [7]. Grhl3^Δ/-^;Tfap2a^Cre/+^ cKO animals also showed a low frequency of exencephaly, again mirroring the constitutive knockout (Fig. 4A) [7]. Together with the genomic DNA analysis showing a complete deletion of the floxed Grhl3 region only in surface ectoderm, these observations suggest that the expression of Grhl3 at other sites (and in particular the hindgut endoderm) was not critical for early-stage spinal neurulation (Fig. 3F). To further characterise the spina bifida lesion observed in the Grhl3^Δ/-^;Tfap2a^Cre/+^ cKO animals, we harvested Grhl3^Δ/-^;Tfap2a^Cre/+^ cKO embryos at E18.5 to generate full-body skeletal preparations. The Grhl3^Δ/-^;Tfap2a^Cre/+^ cKO embryos mimicked constitutive Grhl3-null animals, showing striking abnormalities in the vertebral column, with the first splayed vertebral pedicle (SVP) observed between the eighth to the tenth thoracic vertebrae (T8 to T10) coupled with severe kyphosis (Figure S4A-B and E). Together, these findings indicate that inactivation of Grhl3 expression in Tfap2a-expressing cells is sufficient to induce spinal NTDs of equivalent severity to those seen in embryos with constitutive knock-out of Grhl3.Fig. 4. Specific inactivation of Grhl3 expression in Tfap2a-expressing cells is sufficient to induce spinal neural tube defects. (A) Expected and observed numbers of embryos carrying corresponding genotypes from the cross of Grhl3^+/−^;Tfap2a^Cre/+^ and Grhl3^fl/fl^ mice at E14.5 and E18.5, and the penetrance of neural tube defects in these embryos. The expected numbers of embryos were calculated based on the expected frequency of each genotype using the total number of collected embryos at each timepoint. A one sample χ2 test was used to compare the expected and observed number of embryos. (B) The gross appearances of E14.5 Grhl3^flox^;Tfap2a^Cre^ embryos. The Grhl3^Δ/-^;Tfap2a^Cre/+^ cKO embryos showed curly tail (white arrowhead) and thoraco-lumbo-sacral spina bifida (white arrows). (C) Schematic illustration showing the lower spinal position of transverse sectioning of E14.5 embryos in (D–E). (D) Transverse sectioning of Grhl3^Δ/+^;Tfap2a^Cre/+^ control embryos at the lower spinal region showing a closed neural tube. (E) Transverse sectioning of Grhl3^Δ/-^;Tfap2a^Cre/+^ cKO embryos at the lower spinal region showing a convex neural plate (black arrowheads).Fig. 4
Given that Tfap2a expression at E8.5 is not restricted to the territory of neural plate border, but is also highly expressed throughout the surface ectoderm (Fig. 2C–D), we examined whether the Grhl3^flox^;Tfap2a^Cre^ embryos exhibited defective epidermal development similar to the Grhl3-null animals. Grhl3^Δ/-^;Tfap2a^Cre/+^ embryos harvested at E18.5 demonstrated severely compromised skin barrier function, as assessed by external toluidine blue dye penetration [55], mimicking the profound skin barrier defect as seen in Grhl3-null animals (Fig. 5A) [7,9]. Apart from the impaired skin barrier and NTDs, Grhl3^Δ/-^;Tfap2a^Cre/+^ cKO embryos further phenocopied the Grhl3-null animals, showing a round body shape with a short craniocaudal axis, soft-tissue syndactyly and swollen limbs (Fig. 5A and S5A) [9,11,12,20]. Given these striking phenotypic similarities observed in the cKO animals, we isolated epidermis samples from E18.5 embryonic skin to evaluate mRNA expression levels of multiples epidermal genes. Consistent with the disrupted barrier formation, the expression level of Grhl3 was reduced to a minimum (Fig. 5B) in Grhl3^Δ/-^;Tfap2a^Cre/+^ cKO epidermis, while the mRNA abundances of two markers for impaired epidermal integrity, Tslp and S100a8, were remarkably increased compared with the Grhl3^fl/+^;Tfap2a^+/+^ animals (Fig. 5D–E). The expression of Tfap2a was unaffected in Grhl3^Δ/-^;Tfap2a^Cre/+^ cKO embryos (Fig. 5C).Fig. 5. Specific inactivation of Grhl3 expression in Tfap2a-expressing cells also leads to other Grhl3-null defects. (A) Skin barrier assay on E18.5 Grhl3^flox^;Tfap2a^Cre^ embryos. The Grhl3^Δ/+^;Tfap2a^Cre/+^ control embryos (N = 4) showed a fully formed epidermal barrier while the Grhl3^Δ/-^;Tfap2a^Cre/+^ cKO embryos (N = 6) exhibited a severe skin barrier defect as evident by the penetration of toluidine blue dye into skin. Black triangles, curly tail; black arrows, limb abnormalities; white asterisks, spina bifida. (B–E) Q-RT-PCR analyses on E18.5 epidermis showing the expression levels of Grhl3, Tfap2a, Tslp and S100a8. Bar graphs presented as mean ± standard error of mean. A one-way ANOVA test following by a Dunnett's multiple comparison test between Grhl3^fl/+^;Tfap2a^+/+^ embryos and other genotypes were used for data analysis. ** = P-value <0.01, *** = P-value <0.001, **** = P-value <0.0001. n.s., not significant. (F) Hematoxylin and eosin staining and immunohistology analysis of E18.5 Grhl3^Δ/+^;Tfap2a^Cre/+^ control and Grhl3^Δ/-^;Tfap2a^Cre/+^ cKO skin. N = 4. Black arrowheads, the extra tissue structure on the outermost layer of the epidermis; number signs, compacted stratum corneum layer. SC, stratum corneum; SG, stratum granulosum; SP, stratum spinosum; SB, stratum basale; E, epidermis; D, dermis.Fig. 5
We next examined the architecture of epidermis from Grhl3^Δ/+^;Tfap2a^Cre/+^ control and Grhl3^Δ/-^;Tfap2a^Cre/+^ cKO animals at E18.5 using hematoxylin and eosin (H&E) staining and immunohistochemistry (IHC) analyses with various cell differentiation and proliferation markers. Strikingly, the Grhl3^Δ/-^;Tfap2a^Cre/+^ cKO epidermis was markedly thickened compared with that of Grhl3^Δ/+^;Tfap2a^Cre/+^ control embryos, mimicking the Grhl3-null epidermis (Fig. 5F) [9,12,56]. Similar to the abnormal epidermis observed in Grhl3-null mice, this thickening was coupled with a compacted stratum corneum (SC) layer and largely expanded stratum granulosum (SG) and stratum spinosum (SP) layers. The Grhl3^Δ/-^;Tfap2a^Cre/+^ cKO epidermis also showed an extra tissue structure attached to the SC layer on the surface of the skin, due to defective periderm desquamation caused by loss of GRHL3 [11]. Consistent with the abnormal epidermal architecture, IHC analysis showed that the expression domain of keratin (K) 5, an epidermal basal marker, was significantly expanded in the Grhl3^Δ/-^;Tfap2a^Cre/+^ cKO skin compared with the control (Fig. 5F). Similar abnormalities were observed with the suprabasal marker K1 and the terminal differentiation markers loricrin and filaggrin in the Grhl3^Δ/-^;Tfap2a^Cre/+^ cKO epidermis (Fig. 5F). Moreover, the epidermal stress and repair marker, K6, was highly upregulated in the Grhl3^Δ/-^;Tfap2a^Cre/+^ cKO epidermis while virtually absent in the Grhl3^Δ/+^;Tfap2a^Cre/+^ control skin (Fig. 5F). Examination of the proliferation marker, PCNA, showed a significantly increased positivity with expansion of PCNA-positive cells into the suprabasal layers of the Grhl3^Δ/-^;Tfap2a^Cre/+^ cKO epidermis, indicating basal keratinocyte hyperproliferation (Fig. 5F). These epidermal abnormalities phenocopied the constitutive Grhl3-null skin [9,12,56], indicating that inactivation of Grhl3 in Tfap2a-exrpessing cells is also sufficient to perturb epidermal development.
Loss of TFAP2C in Grhl3-expressing cells causes neural tube defects
2.5
As Tfap2a expression overlaps with Grhl3 expression in the surface ectoderm and epidermis during skin development [18,57], it is not surprising that loss of Grhl3 expression in Tfap2a-positive cells recapitulated the constitutive Grhl3-null skin barrier defect. In view of this, we thought to use a more locally restricted driver to inactivate Grhl3 specifically in neural plate border cells. As opposed to Tfap2a, which is far more prevalent at E8.5, Tfap2c expression is confined to the E8.5 neural plate border but not the surface ectoderm, which mirrors Grhl3 expression pattern identically (Fig. 2G–H). Unfortunately, during mouse embryo development, the expression of Tfap2c also occurs early in developing oocytes, with a rapid decline immediately post fertilisation to be replaced by zygotic transcripts at the morula stage [58]. This suggested that using Tfap2c as a driver for Cre recombinase gene expression, would likely generate a constitutive Grhl3 knockout, and we confirmed this by generating a Tfap2c-Cre mouse intercrossed with our Grhl3^flox^ line (Figure S4B and S6-S8).
As neither the Tfap2a-Cre nor the Tfap2c-Cre specifically confined deletion of Grhl3 to the neural plate border cells, we pivoted in our approach and decided to target Tfap2c expression in these cells using a Grhl3-Cre driver. Our reasoning focused on the fact that Grhl3 and Tfap2c expression overlaps in the minute neural plate border cell cohort at E8.5 and that disruption of either might induce NTD. To achieve this, we crossed the Tfap2c^fl/fl^ line to a CMV-Cre strain and then backcrossed the double heterozygous offspring to WT C57BL*/6* mice to constitutively delete one allele of Tfap2c (Fig. 6C). Grhl3^Cre/+^ mice were then crossed to this Tfap2c^+/−^ line to generate double heterozygotes (Grhl3^Cre/+^;Tfap2c^+/−^). None of these animals exhibited NTD. The double heterozygous mice were crossed to the Tfap2c^fl/fl^ line to produce offspring that are either WT or heterozygous for Grhl3-Cre and carry one Tfap2c floxed allele with either a WT Tfap2c allele or a Tfap2c-null allele (Fig. 6A–E). When the Grhl3-Cre is expressed, the floxed Tfap2c exon 6 will be deleted in the Grhl3^Cre/+^;Tfap2c^Δ/+^ control and Grhl3^Cre/+^;Tfap2c^Δ/-^ cKO mice (Fig. 6A–E) [58]. Of note, and different from the Tfap2a- and Tfap2c-Cre, the Cre recombinase gene was inserted into the exon 1 of Grhl3, rendering the Grhl3-Cre allele a null allele (Fig. 6A) [9,30]. Examination of the pattern of Grhl3-Cre-mediated Tfap2c excision across three germ layers in the cKO embryos showed that a complete deletion of Tfap2c floxed region only occurred in the ectoderm-derived epidermis, while mesoderm-derived heart and endoderm-derived liver retained a large fraction of undeleted flox Tfap2c alleles (Fig. 6F). At both E14.5 and E18.5, embryos with all four genotypes (Grhl3^+/+^;Tfap2c^fl/+^, Grhl3^+/+^;Tfap2c^fl/-^, Grhl3^Cre/+^;Tfap2c^Δ/+^, and Grhl3^Cre/+^;Tfap2c^Δ/-^) were present in a normal Mendelian ratio, indicating that the conditional knock-out of Tfap2c did not cause embryonic lethality (Fig. 7A).Fig. 6. Generation of Grhl3^Cre^;Tfap2c^flox^ mouse model. (A) Schematic diagram showing the gene-targeting strategy for making the Grhl3-Cre allele. The Cre recombinase gene was inserted into the exon 1 of Grhl3 locus. (B) With the expression of Grhl3-Cre, the floxed Tfap2c exon 6 will be deleted. (C) Schematic diagram showing the breeding strategy for generating Grhl3^Cre^;Tfap2c^flox^ embryos. G0 homozygous Tfap2c^flox^ mice were crossed to the CMV-Cre strain to generate the G1 Tfap2c^Δ/+^;CMBV-Cre/+ line. This line was then then crossed to wild-type C57BL/7 mice to generate Tfap2c^+/−^ offspring. Further cross of the Tfap2c^+/−^ mice to the Grhl3^Cre/+^ line generated double heterozygous mice, which were timed mated with Tfap2c^fl/fl^ mice to produce embryos with four different genotypes. (D) PCR genotyping of the wild-type and Cre allele of Grhl3 locus. (E) PCR genotyping of the wild-type and floxed allele of Tfap2c locus. (F) PCR products of floxed allele and delta allele of Tfap2c locus amplified from a representative organ or tissue derived from each of the three germ layers.Fig. 6. Fig. 7Specific inactivation of Tfap2c expression in Grhl3-expressing cells induces partially penetrate spinal neural tube defects with reduced severity. (A) Expected and observed numbers of embryos carrying corresponding genotypes from the cross of Grhl3^Cre/+^;Tfap2c^+/−^ and Tfap2c^fl/fl^ mice at E14.5 and E18.5, and the penetrance of neural tube defects in these embryos. The expected numbers of embryos were calculated based on the expected frequency of each genotype using the total number of collected embryos at each timepoint. A one sample χ2 test was used to compare the expected and observed number of embryos. (B) The gross appearances of E14.5 Grhl3^Cre^;Tfap2c^flox^ embryos. The Grhl3^Cre/+^;Tfap2c^Δ/-^ cKO embryos only displayed partially penetrate curly tail (white triangles) and low lumbo-sacral spina bifida (white arrows). (C) Schematic illustration showing the lower spinal position of transverse sectioning of E14.5 embryos in (D–E). (D) Transverse sectioning of Grhl3 Cre/+;Tfap2cΔ/+ control embryos at the lower spinal region showing a closed neural tube. (E) Transverse sectioning of Grhl3^Cre/+^;Tfap2c^Δ/-^ cKO embryos without neural tube defects at the lower spinal region showing a closed neural tube. (F) Transverse sectioning of Grhl3^Cre/+^;Tfap2c^Δ/-^ cKO embryos with neural tube defects at the lower spinal region showing a convex neural plate (black arrowheads).Fig. 7
Importantly, no NTDs were observed in the Grhl3^Cre/+^;Tfap2c^Δ/+^ control animals, while around 60 % of Grhl3^Cre/+^;Tfap2c^Δ/-^ cKO embryos had curly tail and spina bifida at both E14.5 and E18.5 (Fig. 7A). Interestingly, the spina bifida in these animals showed a reduced severity as evidenced by the low lumbo-sacral lesion (Fig. 7, Fig. 8A), whereas in Grhl3-null, Grhl3^Δ/-^;Tfap2a^Cre/+^ cKO and Grhl3^Δ/-^;Tfap2c^Cre/+^ cKO mice, the lesion normally extends rostrally into the thoracic region. This is consistent with the transverse sectioning at E14.5 showing a malformed convex neural plate at the low lumbo-sacral region of the Grhl3^Cre/+^;Tfap2c^Δ/-^ cKO embryos with caudal NTDs (Fig. 7C and F). The cKO mice without NTDs displayed a normal closed neural tube identical to the Grhl3^Cre/+^;Tfap2a^Δ/+^ control embryos (Fig. 7C–E). The full-body skeletal preparations on E18.5 Grhl3^Cre/+^;Tfap2c^Δ/-^ cKO embryos with NTDs showed that consistent with their gross appearance, the lesion of spina bifida was significantly lower compared with that of Grhl3-null, Grhl3^Δ/-^;Tfap2a^Cre/+^ cKO and Grhl3^Δ/-^;Tfap2c^Cre/+^ cKO mice, with the first SVP identified at T12 or T13 (Figs. S4D–E). Moreover, we did not observe a strong kyphosis phenotype in Grhl3^Cre/+^;Tfap2c^Δ/-^ cKO embryos with NTDs (Fig. S4D). The vertebral phenotype of the Grhl3^Cre/+^;Tfap2c^Δ/-^ cKO embryos without NTDs did not differ from the controls (Fig. S4D). These findings indicate that loss of Tfap2c expression in the Grhl3-expressing neural plate border cell population is sufficient to induce caudal NTDs with reduced severity and penetrance to those observed in Grhl3-null, Grhl3^Δ/-^;Tfap2a^Cre/+^ cKO and Grhl3^Δ/-^;Tfap2c^Cre/+^ cKO animals.Fig. 8. Specific inactivation of Tfap2c expression in Grhl3-expressing cells does not induce classical Grhl3-null phenotypes. (A) Skin barrier assay on E18.5 Grhl3^Cre^;Tfap2c^flox^ embryos showing a fully acquired epidermal barrier in both Grhl3^Cre/+^;Tfap2c^Δ/+^ control (N = 4) and Grhl3^Cre/+^;Tfap2c^Δ/-^ cKO animals (N = 5). Black triangles, curly tail; black arrows, spina bifida. (B–G) Q-RT-PCR analyses on E18.5 epidermis showing mRNA abundance of Grhl3, Grhl3-Cre, Tfap2c, Tfap2a, Tslp and S100a8. Bar graphs presented as mean ± standard error of mean. A one-way ANOVA test following by a Dunnett's multiple comparison test between Grhl3^+/+^;Tfap2c^fl/+^ embryos and other genotypes were used for data analysis. * = P-value <0.05, ** = P-value <0.01, *** = P-value <0.001, **** = P-value <0.0001. n.s., not significant. (H) Hematoxylin and eosin staining and immunohistology analysis of E18.5 Grhl3^Cre/+^;Tfap2c^Δ/+^ control and Grhl3^Cre/+^;Tfap2c^Δ/-^ cKO skin. N = 4. SC, stratum corneum; SG, stratum granulosum; SP, stratum spinosum; SB, stratum basale; E, epidermis; D, dermis.Fig. 8
To investigate if Grhl3^Cre/+^;Tfap2c^Δ/-^ cKO embryos exhibited other Grhl3-null phenotypes, we harvested E18.5 embryos and examined general morphology and skin barrier function. These embryos exhibited a normal body shape and limb and digit morphology (Fig. 8A–S4D, and S5C). In addition, the Grhl3^Cre/+^;Tfap2c^Δ/-^ cKO embryos also exhibited a normal skin barrier development (Fig. 8A). H&E staining and IHC analyses showed a normal thickness and morphology of the Grhl3^Cre/+^;Tfap2c^Δ/-^ cKO epidermis at E18.5 without SC compaction and SG/SP expansion. The expression domains of K5, K1, loricrin, and filaggrin were all comparable to that of the Grhl3^Cre/+^;Tfap2c^Δ/+^ control skin (Fig. 8H). In addition, K6 expression was absent in the cKO skin and the PCNA expression was also confined to the basal layer with well-organised lining of PCNA-positive cells (Fig. 8H).
Real-time quantitative polymerase chain reaction (Q-RT-PCR) analyses showed that in E18.5 epidermis from mice heterozygous for Grhl3-Cre, Grhl3 expression level was reduced to around 50 % of the Grhl3^+/+^;Tfap2c^fl/-^ control level due to the disruption of Grhl3 exon 1 by the integration of the Cre recombinase gene (Fig. 8B). Also, Tfap2c mRNA abundance was reduced to a minimal level in the Grhl3^Cre/+^;Tfap2c^Δ/-^ cKO embryos regardless the presence of NTDs (Fig. 8D). Intriguingly, in the cKO embryos without NTDs, the expression level of Tfap2a did not differ from the controls, whereas it was significantly reduced in cKO mice with NTDs (Fig. 8E). This is likely due to the genetic interaction between Tfap2a and the partial loss of Grhl3 due to the integration of Cre gene in the context of neurulation as shown previously [51]. In keeping with the normal epidermal barrier function and architecture, the expression of Tslp and S100a8 was also comparable to the control level (Fig. 8F–G). As a core component of the PCP pathway in epidermal structures, GRHL3 is required to direct keratinocyte migration in wound healing and hence loss of GRHL3 leads to defective wound repair [10,12]. Therefore to confirm that keratinocyte migration is also normalised in the Grhl3^Cre/+^;Tfap2c^Δ/-^ cKO mice, we next performed an in vitro scratch assay on primary keratinocyte isolated from E18.5 epidermis. We found that the speed of wound closure did not differ between the Grhl3^+/+^;Tfap2c^fl/+^ control and Grhl3^Cre/+^;Tfap2c^Δ/-^ cKO mice regardless the presence of NTDs. Moreover, at 48 h post scratching, a complete wound closure was achieved in all groups, suggesting that loss of TFPA2C in Grhl3-expressing cells did not compromise epidermal migration in wound healing (Figs. S9A–B). Together, these results demonstrate a clear de-association between neural tube closure and other developmental events, specifically surface ectoderm development, hence, we conclude that the neural plate border cell cohort marked by Tfap2c and Grhl3 expression is a crucial population for the early-stage spinal neurulation.
Discussion
3
In the current study, we utilised scRNA-seq to interrogate the transcriptomic profiles of the caudal half of the WT and Grhl3-null embryos at E8.5 (the 6-7-somite stage). We defined a unique cellular cohort characterised by expression of Grhl3, Tfap2a, and Tfap2c that is neither committed surface ectoderm nor neuroepithelial/neural crest cells, but a previously unidentified novel progenitor population. We subsequently showed that targeted loss of Grhl3 expression in Tfap2a-expressing cells is sufficient to induce NTDs, and that loss of Tfap2c in Grhl3-expressing cells also induced spinal NTDs. Most importantly, through the latter model, we demonstrated a clear de-association between neural tube closure and surface ectoderm development as evidenced by the absence of epidermal abnormalities in the *Tfap2c-*cKO embryos with NTDs. Taken together, we conclude that the neural plate border cell population marked by Grhl3, Tfap2a, and Tfap2c expression plays a pivotal role in early-stage neurulation, in agreement with the findings from the tissue explant studies in chicken [[23], [24], [25]].
The cellular identity of Grhl3-expresssing neural plate border cell population at E8.5 has to date remained undefined. It was previously thought to represent committed surface ectoderm, given that GRHL3 is critical for epidermal development during later stages of gestation [7,9,12], and that in the cranial and anterior spinal regions, GRHL3 has been shown to mediate fate specification of surface ectoderm from the neural plate border territory [17]. Possible links between the Grhl3-expressing neural plate border cells and neural crest development have also been mooted, despite Grhl3-null animals failing to display abnormalities in neural crest development [7,9]. Through scRNA-seq, we showed that at E8.5, the caudal Grhl3-expressing neural plate border cell population represents a previously undefined novel progenitor population that lacks a neural crest fate. This is despite co-expression of Grhl3 with Tfap2a and Tfap2c, both previously characterised markers associated with neural crest specification [37,[47], [48], [49]].
Previous studies have explored the role of Grhl3 expression in different tissues in neural tube closure. De Castro et al. [19] demonstrated that specific inactivation of Grhl3 expression in hindgut using Sox17-Cre can lead to mild caudal NTDs, with an incomplete penetrance. However, at the early stage of spinal neurulation, the timepoint when the closure defect starts to be evident [7,19], Grhl3 expression is not detectable in the gut endoderm [13,19]. Hence, an additional site must be required to fulfil the requirement of Grhl3-sepcific function in early-stage neural plate bending. Here, based on the finding from our scRNA-seq, we targeted the Grhl3-expressing population located within the neural plate border domain at E8.5 and demonstrated the direct inductive role of this cell cohort in early spinal neurulation through our Grhl3^Cre/+^;Tfap2c^Δ/-^ cKO model. This is in keeping with the previous tissue explant studies in chicken showing the dispensable role of surface ectoderm in neural tube closure, and the finding that at both E9.5 and E10.5, loss of Grhl3 expression does not compromise the morphology and integrity of surface ectoderm along the entire spinal region encompassing both closed and open neural tube [21,[23], [24], [25]]. Together, De Castro et al. [19] and our data indicate that spinal neural tube closure requires collaborative efforts from at least two Grhl3-expressing sites: the initiation and early progression of spinal neurulation is dependent on the cell cohort marked by Grhl3, Tfap2a, and Tfap2c expression, while the hindgut-specific Grhl3 function is indispensable for mid-to late-stage spinal neural tube morphogenesis. The priority for the future works is to uncover the Grhl3-dependent molecular pathways in these neural plate border cells that induce neural tube closure. The convex caudal neural plate in both Grhl3^Δ/-^;Tfap2a^Cre/+^ cKO and Grhl3^Cre/+^;Tfap2c^Δ/-^ cKO animals at E14.5 suggests that the neural plate border cell cohort marked by Grhl3, Tfap2a, and Tfap2c expression may guide apical constriction and cell shape change within neuroepithelium to generate necessary force that induces neural plate juxtaposition; secondly, neural plate border GRHL3 is highly likely to be required to establish a robust cellular protrusions network to bridge the bilateral neural folds while ‘zippering’ progresses caudally as Grhl3-null animals show altered protrusion dynamics along the neural plate border [21]. Hence, future research could focus on investigating the GRHL3-dependent regulatory networks involved in neural plate juxtaposition and in generating or safeguarding cellular projection networks at the caudal neural plate border during neurulation.
Another important finding from the current study is the clear de-association between neural crest development and neural tube closure. We showed that in the Grhl3^Cre/+^;Tfap2c^Δ/-^ cKO mice, abolition of Tfap2c, the critical gene for early neural crest induction from the neural plate border territory,^48 37^ specifically in Grhl3-expressing neural plate border cells, did not lead to any classic phenotypes caused by abnormal neural crest development. This indicates that the small cohort of neural plate border cell population marked by Grhl3, Tfap2a, and Tfap2c expression does not contribute to neural crest population although these cells express the markers of neural crest progenitor and early neural crest genes and reside within the neural plate border territory. In addition, this finding strongly supports the view that neural plate border is a region with molecular heterogeneity and great flexibility in cell fates [49,59]. Therefore, we postulate that neural plate border GRHL3 is a critical factor to distinguish the non-neural crest lineage that is essential for spinal neurulation. The presence of a GRHL3-dependent regulatory network in the naïve neural plate border cells may be able to supress the neural crest fate decision mediated by TFAP2A and TFAP2C and in turn promote the specification of the novel progenitor population crucial for neural tube closure from the neural plate border territory. This finding again provides an excellent example for the multipotent property of neural plate border and new insights in understanding the complex molecular architecture that medicates neural plate border segregation.
In addition to these findings, the scRNA-seq dataset we generated in the current study offers valuable insights with significant implications for future studies. For example, we noticed that the E8.5 Grhl3-null embryos showed a significant loss of mesoderm-specific populations, including pre-somitic mesoderm, somitic mesoderm, lateral plate mesoderm, and caudal mesoderm (Fig. 1A). In late gestation, the null animals show defective axial elongation with a short longitudinal body axis, which was believed to be caused by defective convergent extension due to disruption in PCP pathway [10]. In addition, the Grhl3-null animals also show a severe kyphosis at the lower spinal region [7]. Here, our finding suggest that these abnormalities may also be the resulting outcome of a defective mesoderm development in the absence of GRHL3. Intriguingly, however, we did not see a significant abundance change in the paraxial mesoderm population (Cluster 1, Fig. 1A). This is very surprising as the precursor of paraxial mesoderm, the pre-somitic mesoderm cluster, was almost absent in our scRNA-seq analysis. However, Grhl3-null mice do not develop any defects in somite formation and segmentation [7,9]. During early embryogenesis, both lateral and paraxial mesoderm progenitors (LPMPs) from CLE region and NMPs from NSB region contribute to the pre-somitic mesoderm population [60], the anterior proportion of the pre-somitic mesoderm becomes paraxial mesoderm which then undergoes somitogenesis [61]. Therefore, a loss of pre-somitic mesoderm without a significant reduction in paraxial mesoderm population is perplexing. One possible explanation is that both pre-somitic and somitic mesoderm populations may have been exhausted due to a premature differentiation into paraxial mesoderm, but this is not consistent with the absence of defects in somite formation and segmentation in Grhl3-null embryos. Previous research has shown that the progenitor populations for pre-somitic mesoderm, LPMPs and NMPs, emerge from CLE and NSB regions at around E7.5, respectively [60]. In keeping with this is the observation that Grhl3 is expressed at low levels in these two regions at E8.5,^19^ therefore it is reasonable to speculate that Grhl3 expression at E8.5 in CLE and NSB regions is required for promoting pre-somitic mesoderm commitment from NMPs and pre-somitic, lateral plate and caudal mesoderm differentiation from LPMPs, whereas in Grhl3-null embryos, the initial mesoderm specification from these progenitors and the development of paraxial mesoderm is normal, until E8.5 when the production of pre-somitic, lateral plate and caudal mesoderm cells is largely stalled due to loss of GRHL3. This hypothesis is also supported by the loss of progenitors for mesoderm populations as seen in the RNA velocity result (Fig. S2A). Whether GRHL3 is required for LPMPs and NMPs differentiation remains an avenue for further research.
One limitation of the current study is that our scRNA-seq analysis involved only a single timepoint in development, providing a static snapshot of the transcriptomic landscape at the initiation stage of neurulation. To capture the dynamic transcriptomic changes throughout neural tube morphogenesis, future studies should perform scRNA-seq or spatial transcriptomic analysis at multiple developmental timepoints. This approach would characterise the full spectrum of gene expression changes across the entire neurulation stage in WT and Grhl3-null animals. It could also help to further investigate the molecular mechanisms by which the Grhl3-expressing neural plate border cell cohort regulates neurulation and neural plate border segregation along the trajectory of early embryonic development. Additionally, future lineage tracing studies will be necessary to validate the lineage fates of the predicted progenitor population from our RNA velocity and Monocle 3 analyses.
In conclusion, our findings from the current study underscore the significance of the unique neural plate border cell population marked by Grhl3, Tfap2a, and Tfap2c expression in neural tube closure and demonstrated that early spinal neurulation is independent of neural crest and epidermal development. This is a major step forward in the understanding of the mechanism underlying neural tube closure at the cellular level and provides us with an excellent platform to further investigate Grhl3-dependent pathways that induce neural tube closure.
Data availability statement
The single cell-RNA sequencing dataset generated by this study has been deposited into Gene Expression Omnibus (GEO) repository under the accession number GSE246181. All dataset analyses were performed based on R (version 3.6.0) [62]. This paper does not report original code. Any additional information required for re-analysing the datasets reported in this paper is available from the corresponding authors upon request.
Materials and methods
Mice
To conditionally inactivate Grhl3 expression in Tfap2a-expressing cells, a line heterozygous for Grhl3 and Tfap2a-Cre (Grhl3^+/−^;Tfap2a^Cre/+^) was generated by crossing Grhl3^+/−^ mice and a Tfap2a^Cre/Cre^ line (Fig. 3A). The Tfap2a-Cre allele contains an Internal Ribosome Entry Site (IRES)-Cre cassette which is inserted into the endogenous Tfap2a 3’ untranslated region (UTR). This line was obtained from Professor Anne Moon from the University of Utah. The Grhl3^+/−^;Tfap2a^Cre/+^ mice were then crossed to the Grhl3^fl/fl^ line through timed mating to generate Tfap2a-Cre-heterozygous or WT Tfap2a-homozygous offspring with one floxed Grhl3 allele and either a WT Grhl3 allele or a Grhl3-null allele (Fig. 3C). The floxed Grhl3 region will be excised, rendering a Grhl3 delta allele, when the Tfap2a-Cre is expressed (Fig. 3B). The generation of the Grhl3^+/−^ line [7], Grhl3^fl/fl^ line [56], and Tfap2a^Cre/Cre^ line [54] has been described previously.
To achieve specific inactivation of Grhl3 expression in Tfap2c-expressing cells, a Tfap2c^Cre/+^ mouse strain was created through the Monash Genome Modification Platform. Briefly, a cassette containing a self-cleaving porcine teschovirus-1 2A (P2A) peptide sequence and a Cre recombinase gene was knocked into the endogenous Tfap2c locus preceded to the Tfap2c stop codon through CRISPR-Cas9 system with a ssDNA repair template (Fig. S6A). The Tfap2c^Cre/+^ strain was then crossed to the Grhl3^+/−^ mice to generate the double heterozygous Grhl3^+/−^;Tfap2c^Cre/+^ line, which was then timed mated with the Grhl3^fl/fl^ mice to generate offspring that carry one Tfap2c-Cre allele, one floxed Grhl3 allele and one Grhl3-null allele (Fig. S6C). The presence of the Cre allele will inactivate the floxed Grhl3 allele in Tfap2c-expressing cells (Fig. S6B).
To delete TFAP2C in Grhl3-expressing cells, a Tfap2c^fl/fl^ line was obtained from Professor Trevor Williams from the University of Colorado (Fig. 6B). The Tfap2c^fl/fl^ mice were firstly crossed to a CMV-Cre strain to generate double heterozygotes. The double heterozygous offspring were then backcrossed to WT C57BL*/6* mice to generate the Tfap2c^+/−^ line, which was further crossed to Grhl3^Cre/+^ mice to generate Grhl3^Cre/+^;Tfap2c^+/−^ mice. Finally, the double heterozygous Grhl3^Cre/+^;Tfap2c^+/−^ mice were crossed to the Tfap2c^fl/fl^ line to generate the Grhl3^Cre/+^;Tfap2c^Δ/-^ cKO embryos (Fig. 6C). In the cKO mice, the floxed Tfap2c exon 6 will be excised by the Grhl3-Cre (Fig. 6B). The generation of the Grhl3^Cre/+^ line [30] and Tfap2c^fl/fl^ line [58] has been described previously.
To obtain Grhl3^−/−^ embryos, the Grhl3^+/−^ mice were intercrossed through timed mating overnight. All experimental mouse lines described above were maintained on a pure C57BL/6 background and raised under optimised conditions with standard food and water supplied ad libitum. For timed mating, male and female mice (generally older then 8 weeks) that have reached sexual maturity were placed in the same cage overnight. The female mice were then inspected for a vaginal plug the morning following the mating. The gestational age of embryos was identified as E0.5 at mid-day on the day of detection of a vaginal plug. To harvest embryos, pregnant female mice were sacrificed through slow-fill CO_2_ asphyxiation following by cervical dislocation. For experiments that require an intact whole-body structure or intact skin integrity, the hypothermia method was used to euthanise embryos aged > E10.0. For other experiments, embryos aged > E10.0 were fully euthanised by decapitation. Mouse genotypes or deletion of the floxed alleles were all confirmed by conventional PCR using genomic DNA isolated from yolk sac samples or different tissues and organs with GoTaq Master Mixes (Promega) and oligonucleotide primer sets listed in Table S2. All animal experiments were pre-approved by the Alfred Research Alliance Animal Ethics Committee with project numbers E/1800/2018/M, E/1900/2019/M, E/8285/2022/M, and E/8286/2022/M. All studies were conducted in the accordance of the Australian Code for the Care and Use of Animals for Scientific Purposes and the Australian Code for the Responsible Conduct of Research and in compliance with the ARRIVE guidelines.
Embryonic tissue dissociation for scRNA-seq
To generate animals for scRNA-seq, Grhl3^+/−^ mice were intercrossed through timed mating. E8.5 (the 6-7-somite stage) embryos were harvested at 3 p.m. on the eighth day post-fertilisation. Embryos were dissected in DEPC-PBS and the yolk sac samples were utilised for genotyping as described above. The caudal half of five WT and three Grhl3^−/−^ embryos was separated using tungsten needles in 0.04 % BSA (Sigma-Aldrich) in DEPC-PBS and then pelleted through centrifugation at 300 rcf for 3 min at 4 °C (Fig. 1A). The supernatant was removed, and the caudal half of the embryo was then incubated with 50 μL 0.25 % (v/v) trypsin (Gibco) in DEPC-PBS for 5 min at 37 °C and triturated with a 200 μL pipette tip to dissociate tissues. The digestion reaction was then inactivated by adding 100 μL 10 % (v/v) FBS (Bovogen Biologicals) in DMEM (Gibco). Cells from five WT embryos and from three Grhl3^−/−^ embryos were pooled and filtered through Flowmi Cell Strainers (40 μm). Cells were then pelleted through centrifugation at 300 rcf for 3 min at 4 °C and resuspended in 15 μL 10 % (v/v) FBS (Bovogen Biologicals) in DMEM (Gibco) per embryo. Cell number and viability were assessed using a hemocytometer by mixing 8 μl cell suspension with 8 μl 0.4 % (v/v) Trypan Blue Solution (Sigma-Aldrich) and a ∼95 % cell viability was observed in both WT and Grhl3^−/−^ samples. Cells were then diluted in 10 % (v/v) FBS (Bovogen Biologicals) in DMEM (Gibco) to a final concentration of 1000 cells/μL for single cell droplet generation and library preparation (Fig. 1A).
ScRNA-seq library preparation and sequencing
A Chromium Next GEM Single Cell 3′ GEM, Library & Gel Bead Kit v3.1 and a Chromium Controller from 10X Genomics were used to generate single cell droplets as per manufacturer's instructions. Two WT and two Grhl3^−/−^ reactions were performed. Briefly, cell suspension with a master mix, gel beads and partitioning oil were loaded onto a Chromium Chip B to generate Gel Beads-in-emulsion (Fig. 1A). After this, samples were transferred into PCR tube strips and processed for reverse transcription and template switching using a T100 Thermal Cycler (Bio-Rad Laboratories). Synthesised full-length cDNA was then purified and amplified, followed by a clean-up reaction. The quality and quantity of amplified cDNA were assessed using an Agilent 4200 TapeStation with a High Sensitivity D5000 ScreenTape. Two WT and two Grhl3^−/−^ 3′ gene expression libraries were then constructed for sequencing as outlined in the manufacturer's user guide. In short, cDNA amplicon from the previous reaction was fragmented and ligated with adaptors, and then subjected for a sample index PCR and a size selection with SPRIselect reagent. The quality and quantity of the libraries were again assessed using an Agilent 4200 TapeStation with a High Sensitivity D5000 ScreenTape. Finally, the libraries were sequenced on an Illumina NextSeq 500 System with the NextSeq 500/550 High Output Kit v2.5 at a targeted sequencing depth of 400 million reads per library (Fig. 1A).
ScRNA-seq data computational analysis
The raw sequencing data were processed using Cell Ranger (10X Genomics, version 3.0.0) with MM10 referenced genome. The raw dataset contains 24,239 cells with the post-normalisation mean reads per cell at 74,836 and the median genes per cell at 5537. Then, cells were filtered using Seurat (version 3.0.2) [63]. Both WT and Grhl3^−/−^ cells with less than 3000 genes per cell were removed. Also, cells with less than 7500 read counts per cells and more than 7 % mitochondrial gene reads were removed from the dataset. A total of 20,196 cells passed the filtering and were retained in the final dataset. Then, all four libraries were merged into a single Seurat object and processed for SCTransform normalisation and dimension reduction. All cells were visualised using UMAP and unsupervised clustering was then performed using FindClusters function at the resolution of 0.4 and the marker genes of each cluster were identified using FindAllMarkers function. The published scRNA-seq reference atlas from Pijuan-Sala et al. [27] was used to manually annotate each cluster based on the cluster-specific marker genes.
For gene co-expression correlation analysis on Grhl3 in cluster 10 only, the WT Cluster 10 was isolated, and the count matrix was extracted. The limma-voom pipeline (version 3.40.2) was then used to identify a set of co-expression genes whose expression changes were highly associated with Grhl3 expression level in Cluster 10, with the log fold-change threshold of 0.45 [64]. The Pearson correlation coefficient tests were then performed on the set of genes with a 95 % confidence interval and the p-value of correlation smaller than 0.05. The result was visualised using the corrplot package (version 0.89) [65].
The RNA velocity analysis was performed using the Velocyto package [52]. The run10x function from Velocyto was used to generate the loom file, which contains the spliced, un-spliced and ambiguous read counts of each gene, based on the Cell Ranger output. The loom file was then loaded and converted into a single Seurat object using the SeuratWrappers package. Low quality cells were filtered as described above. Both global and cluster-specific RNA velocities were calculated using the RunVelocity function with the estimated nearest pooling reads across 25 neighbouring cells (kcells = 25). For the velocity of a single gene, the kcells values was set to 10. All velocity results were visualised using UMAP. The pseudotime trajectory analysis was performed using Monocle 3 [53]. First, the single-cell expression matrix was pre-processed and normalised. Then, batch effects between the samples were corrected using the “align_cds” function, and clustering was performed. The surface ectoderm and neural plate border cluster, marked by the co-expression of Grhl3, Tfap2a, and Tfap2c was selected. Pseudotime trajectories of the selected cluster were inferred separately for WT and Grhl3^−/−^ samples. The root of the modelled trajectory was identified as the node with the co-expression of Grhl3, Tfap2a, and Tfap2c in WT samples, and the corresponding node in Grhl3^−/−^ samples.
Riboprobe construction and whole-mount in situ hybridisation
Riboprobe construction and whole-mount in situ hybridisation were performed as described previously [66]. All primer design templates and oligonucleotide primer sequences used for riboprobe template amplification are listed in Table S2. Whole-mount images of embryos were obtained using a Nikon SMZ1500 Stereomicroscope with the AxioVision software (Zeiss). Multiple images were taken and stacked using Adobe Photoshop to fully capture the pattern of staining. After imaging, embryos were fixed and embedded in paraffin as described previously [66], sectioned at 10 μm thickness in a transverse orientation and collected onto SuperFrost plus slides (Thermo Fisher Scientific), and processed for nuclear fast red staining using standard method. Slides were imaged using a Nikon ECLIPSE Ci-L upright microscope with the NIS-Elements D software.
Histology and immunohistochemistry
For histological analyses, E14.5 whole embryos and E18.5 skin samples were fixed in 4 % (w/v) PFA in PBS at 4 °C for two to four days. All samples were processed using a Leica ASP300S Fully Enclosed Tissue Processor by Monash Histology Platform and embedded into paraffin. All samples were sectioned in a transverse orientation at 5 μm thickness, collected onto SuperFrost plus slides (Thermo Fisher Scientific) and air-dried for at least 24 h. H&E staining was performed as per standard protocol. Immunohistochemistry IHC analyses were performed using standard DAB methods with the ABC HRP Kit and the DAB Peroxidase Substrate Kit (Vector Laboratories). For IHC with mouse antibody, the Mouse-on-Mouse Immunodetection Kit (Vector Laboratories) was used as per the manufacturer's protocol. All sections were imaged using a Nikon ECLIPSE Ci-L upright microscope with the NIS-Elements D software. All antibodies and experimental conditions used for IHC are listed in Table S3.
Skin barrier assay and skeletal preparation
For the skin barrier assay, E18.5 embryos were harvested and euthanise as above, then fixed in 100 % methanol on a roller mixer for 5 min and washed in PBS for 5 min twice. Fixed embryos were incubated in 0.1 % (w/v) toluidine blue (Sigma-Aldrich) in H_2_O for 5 min on a roller mixer, washed in PBS for 5 min twice and then imaged using a Canon EOS 60D camera. Skeletal preparations of E18.5 embryos were performed as described previously [67] and imaged using a Nikon SMZ1500 Stereomicroscope with the AxioVision software (Zeiss).
Reverse transcription and quantitative polymerase chain reaction
E18.5 epidermis samples were separated from the dorsal skin by incubating in 1 mg/mL Dispase II powder (Gibco) in PBS at 4 °C for overnight. For RNA isolation, samples were homogenised in TRIsure (Bioline) using standard syringe method and RNA was then isolated according to the manufacturer's instructions. Then, RNA was subjected to DNase treatment using a TURBO DNA-free Kit (Invitrogen) to remove genomic DNA contamination and reverse transcribed using a Transcriptor First Strand cDNA Synthesis Kit (Roche) as per manufacturer's protocols. Q-RT-PCR was performed using the GoTaq qPCR Master Mix (Promega) with 10 ng cDNA in each reaction on a LightCycler 480 Instrument (Roche). Relative expression values were calculated using the ΔΔCT method by normalising genes of interest to Actb and analysed using Microsoft Excel and GraphPad Prism 10. All oligonucleotide primers used for Q-RT-PCR are listed in Table S2.
Primary keratinocytes isolation and culturing
The isolation and culturing of mouse embryonic primary keratinocytes has been described previously [68]. Briefly, dorsal skin biopsies were obtained from E18.5 embryos and incubated in 4 mg/mL Dispase II powder (Gibco) in EpiLife Medium (Gibco) supplemented with 60 μM calcium and EpiLife Defined Growth Supplement (Gibco) overnight at 4 °C on a rotator. The epidermis was then separated from the underlying tissues and incubated in TrypLE Express Enzyme (Gibco) for 20 min at room temperature with gentle agitation. The primary keratinocytes were isolated by adding EpiLife Medium (Gibco) supplemented with 60 μM calcium and EpiLife Defined Growth Supplement (Gibco) to the digestion reaction and rubbing the epidermis vigorously using forceps. Isolated keratinocytes were then filtered through 100 μm cell strainers, centrifuged at 180 rcf for 5 min at 4 °C and resuspended in EpiLife Medium. Prior to seeding, culture plate was coated with Attachment Factor Protein (Gibco) for 30 min at 37 °C. Cells were seeded at the density of 5 × 10^4^/cm^2^ and incubated in a humidified incubator with 5 % CO_2_ at 37 °C. Culture medium was changed every 24 h to remove dead cells and spontaneously differentiated cells.
Primary keratinocytes in vitro scratch assay
After a confluent monolayer of primary keratinocytes was formed, a sterile 200 μL pipette tip was used to scratch the monolayer. The culture medium was then immediately removed and replaced with fresh EpiLife Medium (Gibco) supplemented with 60 μM calcium and EpiLife Defined Growth Supplement (Gibco). Images of wounds at 0 h, 24 h and 48 h post-scratching were obtained using a Nikon Eclipse TS100 Inverted Phase Contrast Microscope and the extent of wound closure was quantified using Fiji [69] and GraphPad Prism 10.
Statistical analysis
A one sample χ2 test was used to compare the expected and observed numbers of embryos at both E14.5 and E18.5, all P-values were determined based on one degree of freedom. Relative expression levels of genes, the thoracic vertebrae positions of the first SVP, body axis measurements, and the percentages of wound closure were compared between WT or control and other genotypes using one-way ANOVA tests following by Dunnett's multiple comparison tests. In Figs. S5A–B, the cranial-caudal axis lengths were also compared between two specific genotypes using Mann-Whitney tests. All statistical analyses were performed using GraphPad Prism 10.
CRediT authorship contribution statement
Zihao Deng: Writing – review & editing, Writing – original draft, Visualization, Software, Project administration, Methodology, Investigation, Formal analysis, Data curation, Conceptualization. Marina R. Carpinelli: Supervision, Software, Project administration, Methodology, Investigation, Formal analysis, Data curation, Conceptualization. Tariq Butt: Project administration, Investigation. Graham W. Magor: Software, Methodology, Investigation, Formal analysis, Data curation. Peinan Zhao: Visualization, Software, Methodology, Investigation, Formal analysis, Data curation. Kevin R. Gillinder: Software, Formal analysis, Data curation. Andrew C. Perkins: Supervision, Software, Methodology, Investigation, Formal analysis, Data curation. Stephen M. Jane: Writing – review & editing, Writing – original draft, Supervision, Resources, Methodology, Investigation, Funding acquisition, Conceptualization.
Declaration of competing interest
The authors declare that they have no known competing financial interests or personal relationships that could have appeared to influence the work reported in this paper.
The reference list from the paper itself. Each links out to its DOI / PubMed record.
- 1Müller F.O'Rahilly R.The development of the human brain, the closure of the caudal neuropore, and the beginning of secondary neurulation at stage 12Anat. Embryol.176198741343010.1007/BF 003100833688450 · doi ↗ · pubmed ↗
- 2O'Rahilly R.Müller F.Neurulation in the normal human embryo Ciba Foundation Symposium 1811994708210.1002/9780470514559.ch 5; discussion 82-798005032 · doi ↗ · pubmed ↗
- 3Wood L.R.Smith M.T.Generation of anencephaly: 1. Aberrant neurulation and 2. Conversion of exencephaly to anencephaly J. Neuropathol. Exp. Neurol.4319846206336502191 · pubmed ↗
- 4Meuli M.Meuli-Simmen C.Hutchins G.M.Seller M.J.Harrison M.R.Adzick N.S.The spinal cord lesion in human fetuses with myelomeningocele: implications for fetal surgery J. Pediatr. Surg.32199744845210.1016/S 0022-3468(97)90603-59094015 · doi ↗ · pubmed ↗
- 5Coskun A.Kiran G.Ozdemir O.Craniorachischisis totalis: a case report and review of the literature Fetal Diagn. Ther.252009212510.1159/00018866219129707 · doi ↗ · pubmed ↗
- 6Massarwa R.Niswander L.In toto live imaging of mouse morphogenesis and new insights into neural tube closure Development 140201322623610.1242/dev.08500123175632 PMC 3514000 · doi ↗ · pubmed ↗
- 7Ting S.B.Wilanowski T.Auden A.Hall M.Voss A.K.Thomas T.Parekh V.Cunningham J.M.Jane S.M.Inositol- and folate-resistant neural tube defects in mice lacking the epithelial-specific factor Grhl-3Nat. Med.920031513151910.1038/nm 96114608380 · doi ↗ · pubmed ↗
- 8Ting S.B.Wilanowski T.Cerruti L.Zhao L.L.Cunningham J.M.Jane S.M.The identification and characterization of human Sister-of-Mammalian Grainyhead (SOM) expands the grainyhead-like family of developmental transcription factors Biochem. J.370200395396210.1042/bj 2002147612549979 PMC 1223248 · doi ↗ · pubmed ↗