FlaHMM: unistrand flamenco-like piRNA cluster prediction in Drosophila species using hidden Markov models
Maria-Anna Trapotsi, Jasper van Lopik, Gregory J Hannon, Benjamin Czech Nicholson, Susanne Bornelöv

TL;DR
The paper introduces FlaHMM, a computational tool that automates the identification of piRNA clusters in Drosophila genomes using hidden Markov models.
Contribution
FlaHMM enables scalable annotation of piRNA clusters without requiring small RNA sequencing data.
Findings
FlaHMM performs comparably to manual and piRNA-guided methods in identifying piRNA clusters.
The tool uses transposable element content in genomic bins to predict clusters from genome assemblies alone.
FlaHMM is freely available and suitable for large-scale comparative studies across Drosophila species.
Abstract
PIWI-interacting RNAs (piRNAs) are a class of small non-coding RNAs that are essential for transposon control in animal gonads. In Drosophila ovarian somatic cells, piRNAs are transcribed from large genomic regions called piRNA clusters, which are enriched for transposon fragments and act as a memory of past invasions. Despite being widely present across Drosophila species, somatic piRNA clusters are difficult to identify and study due to their lack of sequence conservation and limited synteny. Current identification methods rely on either extensive manual curation or availability of high-throughput small RNA sequencing data, limiting large-scale comparative studies. We now present FlaHMM, a hidden Markov model developed to automate genomic annotation of flamenco-like unistrand piRNA clusters in Drosophila species, requiring only a genome assembly and transposon annotations. FlaHMM uses…
Genes, proteins, chemicals, diseases, species, mutations and cell lines named across the full text — each resolved to its canonical identifier and authoritative record.
Click any figure to enlarge with its caption.
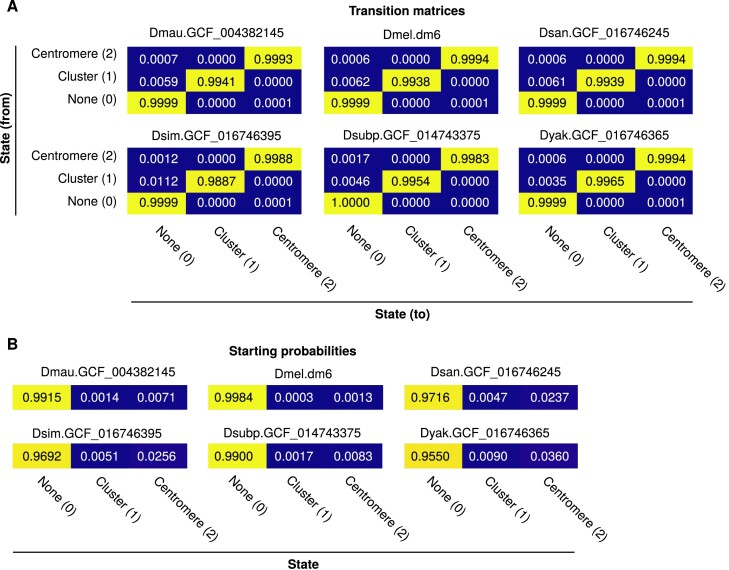 Figure 1
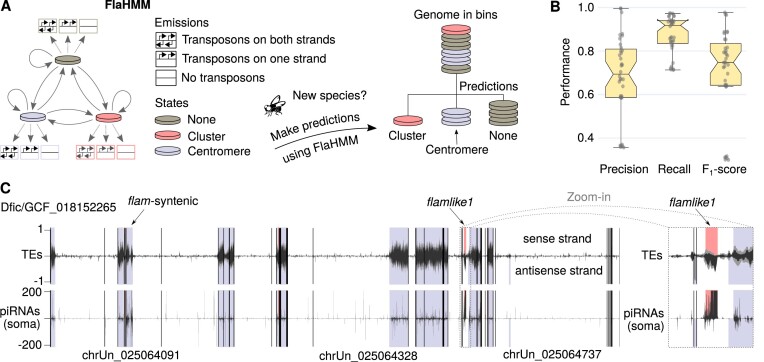 Figure 2
| Model | Bin | Threshold | TPR | FPR |
|---|---|---|---|---|
| 5kb_CV_rank1 | 5 kb | 0.025 | 0.799 ± 0.336 | 0.011 ± 0.011 |
| 5kb_CV_rank2 | 5 kb | 0.05 | 0.795 ± 0.324 | 0.010 ± 0.011 |
| 5kb_CV_rank3 | 5 kb | 0.075 | 0.898 ± 0.195 | 0.014 ± 0.017 |
| 10kb_CV_rank1 | 10 kb | 0.05 | 0.832 ± 0.269 | 0.019 ± 0.019 |
| 10kb_CV_rank2 | 10 kb | 0.1 | 0.868 ± 0.218 | 0.019 ± 0.021 |
| 10kb_CV_rank3 | 10 kb | 0.075 | 0.833 ± 0.267 | 0.018 ± 0.019 |
- —Cancer Research UK10.13039/501100000289
- —Wellcome Trust10.13039/100010269
- —Royal Society10.13039/501100000288
Peer Reviews
No public reviews on file for this paper yet. If you reviewed it on a platform where reviews are public (OpenReview, ICLR, NeurIPS, ICML), you can paste yours below so the community can read it here.
Videos
No videos yet. Explain this paper in a talk, walkthrough, or lecture? Add one.
Taxonomy
TopicsChromosomal and Genetic Variations · RNA and protein synthesis mechanisms · Genomics and Phylogenetic Studies
Introduction
Transposable elements (TEs) are DNA sequences with the ability to move and amplify within a genome, thus posing a threat to genome integrity of their host. In the fruit fly Drosophila melanogaster, the flamenco (flam) locus plays an essential role in repressing a subset of TEs in somatic follicle cells of the ovary. Here, flam serves as the predominant source of PIWI-interacting RNAs (piRNAs), a class of small non-coding RNAs that guide PIWI proteins to silence TEs through complementary base pairing (1). Failure to express or process flam into piRNAs typically results in sterility (2,3).
Although most animals rely on the piRNA pathway to repress TEs (1), flam was described as a master regulator of Gypsy-family TEs in D. melanogaster (3,4) a decade before it was known to be a piRNA cluster. For a long time, flam-syntenic clusters were identified only in species closely related to D. melanogaster (5,6). We recently reported that flam is evolutionarily conserved beyond the melanogaster subgroup and that flam-like loci exist in species that diverged from D. melanogaster at least 33 million years ago (7). This raises the possibility that unistrand piRNA clusters may control Gypsy-family TEs across the whole Drosophila genus.
Currently, piRNA clusters are typically identified by mapping piRNAs onto the genome of interest, followed by identification of candidate piRNA clusters using proTRAC (8). This tool quantifies small RNA abundance per 1-kb genomic bin and identifies regions where small RNAs display piRNA-like characteristics such as 1U and 10A biases. Although powerful, proTRAC and related methods crucially rely on the availability of small RNA sequencing (sRNA-seq) data obtained from germline cells of the species of interest. Recent advances in long-read sequencing have enabled more and better genome assemblies. High-quality assemblies are now available for 298 drosophilid species (9), including many assemblies from individual wild-caught flies. Using sRNA-seq to identify piRNA clusters is therefore not possible, both due to the sheer scale of the project and because many of these species are not currently available and may not be thriving in laboratory conditions. To effectively study the evolution of piRNA clusters across all drosophilids, we would therefore need automated methods capable of annotating flam-like piRNA clusters genome-wide from genome sequence alone.
Here we present FlaHMM, a hidden Markov model (HMM) that accurately predicts the location of flam-like unistrand piRNA clusters solely based on genomic sequence and predicted TE annotations. Inspired by other genome-wide annotation tools such as ChromHMM (10), FlaHMM divides each chromosome into a series of consecutive bins. Each bin is considered to have a hidden state (piRNA cluster or not) giving rise to an observable feature, in this case TE content. The classification task is formulated as deriving the hidden states, based on the observed TE content. HMMs are particularly suited for this task since they correctly assume that the state of each bin simultaneously depends on the previous bin and on the next bin. FlaHMM was trained using flam and flam-syntenic regions from 6 species in the melanogaster subgroup, and evaluated on 4 additional species from the melanogaster subgroup and 12 distantly related species with evolutionarily distinct flam-like piRNA clusters. Overall, FlaHMM achieved a true positive rate (TPR) of 0.80 ± 0.34 and a false positive rate (FPR) of 0.011 ± 0.011, and the predicted clusters showed strong agreement with high-throughput profiling of soma-enriched ovarian piRNAs.
Materials and methods
Data and annotations
Training and test sets
All genome assemblies used for training or model evaluation are listed in Supplementary Table S1. In short, the model was trained to separate the genome into centromeres, flam-syntenic regions and other regions using species from the melanogaster subgroup. Since training required information about the chromosome arms, we used six species with this information available as a training set and the remaining four species as a test set. Another 12 more distantly related species with non-syntenic clusters were used as a second fully independent test set.
Evaluation of genome assembly quality
To estimate the quality of each genome assembly, we used the NX metric, which is defined as the length of the shortest contig for which longer and equal length contigs cover at least X% of the assembly (see ‘01_assembly_stats’ in the supplementary repository).
De novo TE annotations
For this study, de novo TE libraries were constructed using EDTA (v1.9.3) as previously described (7); however, other TE annotations such as RepBase can be used (see ‘examples’ in the FlaHMM repository). In brief, the genome was divided into 2.5-, 5- or 10-kb bins using ‘bedtools makewindows’. Gypsy-family TEs were separated by strand and coverage per bin was quantified using ‘bedtools coverage’ and normalized to bin size as previously described (7). For detailed instructions, see ‘examples’ in the FlaHMM repository.
Hidden Markov model
States
Each genomic bin was assigned one of three possible states: none (0), flam-like cluster (1) and centromere-like region (2). As ground truth, we used previously reported cluster coordinates (7). Centromeric regions were defined at chr2 and chr3 as described in Supplementary Methods S1 (Supplementary Figure S1). Any other bin was considered to be ‘none’. Please note that the main purpose of including centromeres as a separate state was to improve the specificity of flam-like cluster predictions, and that we did not per se optimize the model for centromere predictions.
Emissions
Each genomic bin was assigned one of three possible emissions: no Gypsy-family TEs (0), Gypsy-family TEs present on one strand (1) and Gypsy-family TEs present on both strands (2). Assignment was done based on the EDTA-predicted Gypsy-family TE coverage per strand, defined as a fraction between 0 and 1. This fraction was compared to a threshold between 0.025 and 0.900 using the conditions described in Supplementary Table S2.
Model training
Transition, emission and starting probabilities were estimated as maximum likelihood estimates using the known states and emissions for D. mauritiana, D. melanogaster, D. santomea, D. simulans, D. subpulchrella and D. yakuba with pseudo-count 0.001 for transition probabilities or 1 for emission probabilities and starting probabilities. Finally, a combined model was constructed as the mean of the individual models. Examples of transition matrix (Figure 1A), starting (Figure 1B) and emission matrix (Supplementary Figure S2) probabilities are provided.
Overview of model parameters. (A) Transition matrix probabilities and (B) starting probabilities calculated across all six Drosophila species used to train the models, using the 5-kb binning strategy. Please note that the state is independent of the emission threshold.
Model evaluation
The models were implemented in Python using CategoricalHMM (called MultinomialHMM prior to hmmlearn v0.2.8) from hmmlearn (v0.2.7). Parameter optimization during training was done by leave-one-out cross-validation. The final models were evaluated on an external test set that included 4 species with a flam-syntenic cluster and 12 species with a previously predicted flam-like locus that lacks synteny to flam. Models were evaluated by TPR, FPR, precision (Equation 1), recall (Equation 2) and F1 score (Equation 3):
\documentclass[12pt]{minimal} \usepackage{amsmath} \usepackage{wasysym} \usepackage{amsfonts} \usepackage{amssymb} \usepackage{amsbsy} \usepackage{upgreek} \usepackage{mathrsfs} \setlength{\oddsidemargin}{-69pt} \begin{document} \begin{equation*}{\rm precision} = \frac{{{\rm TP}}}{{{\rm TP} + {\rm FP}}},\end{equation*}\end{document} \documentclass[12pt]{minimal} \usepackage{amsmath} \usepackage{wasysym} \usepackage{amsfonts} \usepackage{amssymb} \usepackage{amsbsy} \usepackage{upgreek} \usepackage{mathrsfs} \setlength{\oddsidemargin}{-69pt} \begin{document} \begin{equation*}{\rm recall} = \frac{{{\rm TP}}}{{{\rm TP} + {\rm FN}}},\end{equation*}\end{document} \documentclass[12pt]{minimal} \usepackage{amsmath} \usepackage{wasysym} \usepackage{amsfonts} \usepackage{amssymb} \usepackage{amsbsy} \usepackage{upgreek} \usepackage{mathrsfs} \setlength{\oddsidemargin}{-69pt} \begin{document} \begin{equation*}F_1 = 2 \times \frac{{{\rm precision} \times {\rm recall}}}{{{\rm precision} + {\rm recall}}} = \frac{{2{\rm TP}}}{{2{\rm TP} + {\rm FP} + {\rm FN}}}.\end{equation*}\end{document}We note that false positives were more common on fragmented and unplaced contigs. We therefore present the cross-validation results across the N90 contigs. See Supplementary Results S1 (Supplementary Figure S3) for more details on NX thresholds.
Analysis of sRNA-seq data
Sequencing data for D. ficusphila available on Gene Expression Omnibus (GEO; accession numbers GSM7059862 and GSM7059863) were processed and aligned as previously described (7). In short, we excluded an abundant ribosomal RNA and performed adapter trimming using Trim Galore! (v0.6.4, \documentclass[12pt]{minimal} \usepackage{amsmath} \usepackage{wasysym} \usepackage{amsfonts} \usepackage{amssymb} \usepackage{amsbsy} \usepackage{upgreek} \usepackage{mathrsfs} \setlength{\oddsidemargin}{-69pt} \begin{document} \hbox{-,-}\end{document} stringency 30 -e 0.1 -a TGCTTGGACTACATATGGTTGAGGGTTGTA \documentclass[12pt]{minimal} \usepackage{amsmath} \usepackage{wasysym} \usepackage{amsfonts} \usepackage{amssymb} \usepackage{amsbsy} \usepackage{upgreek} \usepackage{mathrsfs} \setlength{\oddsidemargin}{-69pt} \begin{document} \hbox{-,-}\end{document} length 18 -q 0, followed by \documentclass[12pt]{minimal} \usepackage{amsmath} \usepackage{wasysym} \usepackage{amsfonts} \usepackage{amssymb} \usepackage{amsbsy} \usepackage{upgreek} \usepackage{mathrsfs} \setlength{\oddsidemargin}{-69pt} \begin{document} \hbox{-,-}\end{document} stringency 5 -e 0.1 \documentclass[12pt]{minimal} \usepackage{amsmath} \usepackage{wasysym} \usepackage{amsfonts} \usepackage{amssymb} \usepackage{amsbsy} \usepackage{upgreek} \usepackage{mathrsfs} \setlength{\oddsidemargin}{-69pt} \begin{document} \hbox{-,-}\end{document} length 18 \documentclass[12pt]{minimal} \usepackage{amsmath} \usepackage{wasysym} \usepackage{amsfonts} \usepackage{amssymb} \usepackage{amsbsy} \usepackage{upgreek} \usepackage{mathrsfs} \setlength{\oddsidemargin}{-69pt} \begin{document} \hbox{-,-}\end{document} max_length 35 -q 0). Next, we used bowtie (v1.2.3) to exclude reads mapping to miRBase release 22.1 (11) (-S -n 2 -M 1 -p 20 \documentclass[12pt]{minimal} \usepackage{amsmath} \usepackage{wasysym} \usepackage{amsfonts} \usepackage{amssymb} \usepackage{amsbsy} \usepackage{upgreek} \usepackage{mathrsfs} \setlength{\oddsidemargin}{-69pt} \begin{document} \hbox{-,-}\end{document} best \documentclass[12pt]{minimal} \usepackage{amsmath} \usepackage{wasysym} \usepackage{amsfonts} \usepackage{amssymb} \usepackage{amsbsy} \usepackage{upgreek} \usepackage{mathrsfs} \setlength{\oddsidemargin}{-69pt} \begin{document} \hbox{-,-}\end{document} strata \documentclass[12pt]{minimal} \usepackage{amsmath} \usepackage{wasysym} \usepackage{amsfonts} \usepackage{amssymb} \usepackage{amsbsy} \usepackage{upgreek} \usepackage{mathrsfs} \setlength{\oddsidemargin}{-69pt} \begin{document} \hbox{-,-}\end{document} nomaqround \documentclass[12pt]{minimal} \usepackage{amsmath} \usepackage{wasysym} \usepackage{amsfonts} \usepackage{amssymb} \usepackage{amsbsy} \usepackage{upgreek} \usepackage{mathrsfs} \setlength{\oddsidemargin}{-69pt} \begin{document} \hbox{-,-}\end{document} chunkmbs 1024), followed by aligning the remaining reads to the reference genomes (-S -n 2 -M 1 -p 20 \documentclass[12pt]{minimal} \usepackage{amsmath} \usepackage{wasysym} \usepackage{amsfonts} \usepackage{amssymb} \usepackage{amsbsy} \usepackage{upgreek} \usepackage{mathrsfs} \setlength{\oddsidemargin}{-69pt} \begin{document} \hbox{-,-}\end{document} best \documentclass[12pt]{minimal} \usepackage{amsmath} \usepackage{wasysym} \usepackage{amsfonts} \usepackage{amssymb} \usepackage{amsbsy} \usepackage{upgreek} \usepackage{mathrsfs} \setlength{\oddsidemargin}{-69pt} \begin{document} \hbox{-,-}\end{document} strata \documentclass[12pt]{minimal} \usepackage{amsmath} \usepackage{wasysym} \usepackage{amsfonts} \usepackage{amssymb} \usepackage{amsbsy} \usepackage{upgreek} \usepackage{mathrsfs} \setlength{\oddsidemargin}{-69pt} \begin{document} \hbox{-,-}\end{document} nomaqround \documentclass[12pt]{minimal} \usepackage{amsmath} \usepackage{wasysym} \usepackage{amsfonts} \usepackage{amssymb} \usepackage{amsbsy} \usepackage{upgreek} \usepackage{mathrsfs} \setlength{\oddsidemargin}{-69pt} \begin{document} \hbox{-,-}\end{document} chunkmbs 1024). piRNA cluster prediction was performed using proTRAC (8). Two biological replicates were combined using samtools merge, following by running proTRAC (v2.4.4, -pdens 0.01 -swincr 100 -swsize 1000 -clsize 5000 -1To10A 0.75 -clstrand 0.5 -pimin 23 -pimax 30 -pisize 0.75 -distr 1-99 -nomotif -format SAM).
To quantify the number of piRNAs per genomic region, we further used ‘bedtools makewindows’ with ‘-w 10000 -s 5000’ to construct 10-kb windows with 5-kb overlap. The BAM file was filtered for reads within the expected piRNA size range (24–29 nucleotides), downsampling to at most 1000 reads per 5′ end position. The BAM files were then converted to BED using ‘bedtools bamtobed’ and the number of piRNAs mapping to each bin was quantified using ‘bedtools intersect’ with ‘-c -F 0.5’.
Results
Design of FlaHMM to accurately identify flam-like clusters from genomic sequence
To identify the best strategy for flam-like cluster identification using Gypsy-family TE content (Figure 2A), we trained HMMs using six Drosophila species and used leave-one-out cross-validation to evaluate how genome binning strategy (2.5, 5 or 10 kb) and Gypsy-family TE content thresholds (0.025–0.900) influenced model performance (Supplementary Figure S4A–C). We note that 5- or 10-kb bins gave similar performance (Supplementary Figure S5B and C), but lower performance was obtained with 2.5-kb bins (Supplementary Figure S5A). For all binning strategies, low Gypsy-family TE thresholds (0.025–0.100) performed better than higher thresholds (0.200–0.900). For example, the median F1 score was equal to 0.79, 0.64 and 0.59 for thresholds of 0.025, 0.50 and 0.90, respectively, when 5-kb bins were used (Supplementary Figure S4B). Based on cross-validation F1 scores, we selected the top three models using 5-kb bins (thresholds of 0.025, 0.5 and 0.075) and the top three models using 10-kb bins (thresholds of 0.05, 0.075 and 0.1), resulting in six preferred settings (Figure 2B, and arrows in Supplementary Figure S4). The overall best-performing model (5-kb bins, 0.025 threshold) had a median precision of 0.76, a recall of 0.86 and an F1 score of 0.79. To not overestimate performance due to uneven class distribution, all metrics are reported as mean across all three classes (more details in Supplementary Results S2).
Overview of FlaHMM. (A) Schematic of FlaHMM, an HMM trained to predict unistrand piRNA clusters and centromere-like regions based on Gypsy-family TE content per genomic strand. Predictions are made across 2.5–10-kb genomic bins. (B) Cross-validation performance across six top-performing models. (C) FlaHMM predictions across the D. ficusphila genome. Genomic coordinates are shown on the x-axis with vertical black lines indicating contig breaks and selected contig names indicated. The top tracks show TE content (black lines, long terminal repeat TEs; grey lines, all TEs) and the bottom one (black lines) shows piRNAs in soma-enriched ovarian cells (7). Positive values represent the sense strand and negative values the antisense strand relative to flamlike1. FlaHMM predictions are shown as shaded areas, with grey–blue regions indicating centromeres or other TE-rich regions, and pink areas flam-like clusters. Notably, the only major flam-like cluster predicted corresponds to previously reported flamlike1 (7), indicated by an arrow and shown in the zoom-in to the right (grey dashed lines).
FlaHMM efficiently scans Drosophila genomes for flam-like piRNA cluster candidates
FlaHMM output includes interactive plots (Supplementary Figures S6–S8) that can be explored in a web browser. We next applied FlaHMM on 29 genome assemblies from 16 previously unseen Drosophila species with previously reported unistrand piRNA clusters. Four of these species belong to the melanogaster species subgroup and have flam-syntenic piRNA clusters, and another 12 are evolutionarily distant with non-syntenic flam-like clusters (7).
We first used the settings that performed best during cross-validation (5-kb bins, 0.025 threshold). Known flam-syntenic clusters were successfully re-identified in 11 out of 11 assemblies representing all four tested species (Supplementary Table S3, overall TPR = 0.900 ± 0.111, FPR = 0.011 ± 0.013). For the more difficult task of finding new clusters, we re-identified flam-like clusters in 14 out of 18 assemblies from nine species (Supplementary Table S4, overall TPR = 0.737 ± 0.411, FPR = 0.010 ± 0.011), representing four distinct unistrand piRNA clusters (flamlike1, flamlike2, flamlike3 and flamlike5). Highly fragmented genome assemblies are likely to provide poor assembly quality of repetitive regions, and indeed, although not significant, we observed a moderate negative correlation between TPR and the number of contigs in an assembly, for both flam-syntenic (r = −0.24, P = 0.48; Supplementary Table S3) and flam-like regions (r = −0.39, P = 0.12; Supplementary Table S4). We also tested whether cluster size influenced detection but observed only a weak and non-significant negative correlation between TPR and cluster size (r = −0.14, P = 0.46). Notably, TPR was strongly correlated to FPR, for both flam-syntenic (r = 0.74, P = 0.0093) and flam-like (r = 0.39, P = 0.11) regions, confirming that increased sensitivity comes at the expense of specificity. Allowing more false positives may therefore provide a way of improving detection of cluster regions in the future. We note that although even a low FPR can pose a problem when predicting a rare category on a genome-wide scale, these were generally scattered across the centromere-like regions and therefore easy to separate from the pericentromeric piRNA cluster (Figure 2C). Notably, our successful predictions included D. ambigua, D. miranda, D. obscura and D. tristis, where previously reported flam-like regions were identified only when guided by synteny analysis (7). FlaHMM therefore provides an improvement in sensitivity over the currently used manual annotation.
We next evaluated FlaHMM using the other five top-performing settings (Table 1). Strikingly, while all settings re-identified 11 out of 11 flam-syntenic regions (Supplementary Table S5), the new settings, which all used higher thresholds, performed equally well or better on non-syntenic flam-like clusters. For instance, using 5-kb bins and 0.075 threshold, we successfully identified flam-like clusters in 28 out of 29 genome assemblies (Supplementary Tables S5 and S6, overall TPR = 0.898 ± 0.195, FPR = 0.014 ± 0.017), failing only on the highly fragmented Dfic.GCF_000220665 assembly (5754 contigs and N50 of 1 050 541). All metrics are shown in Supplementary Table S7. We conclude that higher thresholds likely improve identification of non-syntenic flam-like clusters, although this remains to be verified on independent data. We nevertheless recommend running FlaHMM with higher thresholds if no hit is found initially.
FlaHMM predictions are experimentally supported
Next, we tested the agreement between FlaHMM predictions and piRNA profiling through sRNA-seq. In D. ficusphila, FlaHMM identified 91% of bins overlapping flamlike1, limiting FPR to 0.5% located primarily in centromeric regions (Figure 2C). Publicly available soma-enriched piRNA profiling (7) confirmed that this region was strongly enriched for piRNAs originating from the predicted strand and complementary to Gypsy-family TEs, thus resembling the expression pattern of a unistrand piRNA cluster. In comparison, using the same sequencing data, proTRAC predicted 50 piRNA clusters (Supplementary Table S8), including 13 clusters overlapping flamlike1, and recovered 50% of bins overlapping flamlike1 at a 0.3% FPR (Supplementary Figure S9). Thus, both approaches are largely successful, although the latter requires experimental sequencing data.
Discussion
HMMs are commonly used to segment a genome based on its transcriptional state (10). In this study, we show that TE content can be used in a similar manner to identify genomic regions with other specialized functions, such as unistrand flam-like piRNA clusters and centromere-like regions. Previous efforts to identify flam-like piRNA clusters in new Drosophila species have relied either fully (12) or partially (7) on sRNA-seq. However, with the current growth of high-quality long-read genome assemblies available (9), obtaining and sequencing all new fly species becomes increasingly intractable, and use of tools for automatic annotations such as FlaHMM may instead support large-scale comparative studies. Moreover, studying the cases where cluster borders differ from current annotation may provide an opportunity to refine our current annotations, as clusters vary even within species (13).
Although FlaHMM currently predicts both flam-like clusters and centromere-like regions, our external test validation was focused on flam-like regions. Beyond the cross-validation metrics, we therefore cannot exclude that other TE-rich regions may occasionally be annotated as centromeres, for instance dual-strand piRNA clusters or the unusually large and TE-rich Y chromosome in D. miranda (14), and centromere predictions should subsequently be used with caution. FlaHMM currently relies solely on Gypsy-family TE content, which is characteristic for flam-like clusters (7), and provides good performance. However, integrating other TE families, characteristic for other genomic features, may improve model performance further and provide additional granularity to separate different types of TE-rich regions. Future versions of FlaHMM may explore this idea using a multivariate HMM, simultaneously measuring several different TE families.
Conclusion
We have developed FlaHMM, a tool for unistrand piRNA cluster prediction in Drosophila species. Notably, while piRNA cluster identification traditionally has relied on sRNA-seq, FlaHMM predicts cluster locations requiring only a genome assembly and TE annotations. We hope that the release of FlaHMM will simplify and speed up annotation of unistrand piRNA cluster candidates in newly assembled Drosophila genomes. Moreover, with FlaHMM as a proof of principle, similar tools may now be developed for other species.
Supplementary Material
lqae119_Supplemental_Files
The reference list from the paper itself. Each links out to its DOI / PubMed record.
- 1Czech B. , MunafòM., Ciabrelli F., Eastwood E.L., Fabry M.H., Kneuss E., Hannon G.J. pi RNA-Guided Genome Defense: From Biogenesis to Silencing. Annu. Rev. Genet.2018; 52:131–157.30476449 10.1146/annurev-genet-120417-031441 PMC 10784713 · doi ↗ · pubmed ↗
- 2Goriaux C. , Théron E., Brasset E., Vaury C. History of the discovery of a master locus producing pi RN As: the flamenco/COM locus in Drosophila melanogaster. Front. Genet.2014; 5:257.25136352 10.3389/fgene.2014.00257 PMC 4120762 · doi ↗ · pubmed ↗
- 3Prud’homme N. , Gans M., Masson M., Terzian C., Bucheton A. Flamenco, a gene controlling the gypsy retrovirus of Drosophila melanogaster. Genetics. 1995; 139:697–711.7713426 10.1093/genetics/139.2.697PMC 1206375 · doi ↗ · pubmed ↗
- 4Kim A.I. , Lyubomirskaya N.V., Belyaeva E.S., Shostack N.G., Ilyin Y.V. The introduction of a transpositionally active copy of retrotransposon GYPSY into the stable strain of Drosophila melanogaster causes genetic instability. Mol. Gen. Genet.1994; 242:472–477.8121404 10.1007/BF 00281799 · doi ↗ · pubmed ↗
- 5Chirn G.W. , Rahman R., Sytnikova Y.A., Matts J.A., Zeng M., Gerlach D., Yu M., Berger B., Naramura M., Kile B.T.et al. Conserved pi RNA expression from a distinct set of pi RNA cluster loci in eutherian mammals. P Lo S Genet.2015; 11:e 1005652.26588211 10.1371/journal.pgen.1005652 PMC 4654475 · doi ↗ · pubmed ↗
- 6Malone C.D. , Brennecke J., Dus M., Stark A., Mc Combie W.R., Sachidanandam R., Hannon G.J. Specialized pi RNA pathways act in germline and somatic tissues of the Drosophila ovary. Cell. 2009; 137:522–535.19395010 10.1016/j.cell.2009.03.040PMC 2882632 · doi ↗ · pubmed ↗
- 7van Lopik J. , Alizada A., Trapotsi M.A., Hannon G.J., Bornelöv S., Czech Nicholson B. Unistrand pi RNA clusters are an evolutionarily conserved mechanism to suppress endogenous retroviruses across the Drosophila genus. Nat. Commun.2023; 14:7337.37957172 10.1038/s 41467-023-42787-1PMC 10643416 · doi ↗ · pubmed ↗
- 8Rosenkranz D. , Zischler H. pro TRAC—a software for probabilistic pi RNA cluster detection, visualization and analysis. BMC Bioinformatics. 2012; 13:5.22233380 10.1186/1471-2105-13-5PMC 3293768 · doi ↗ · pubmed ↗