Low methylthioadenosine phosphorylase expression is associated with worse survival in patients with acute myeloid leukaemia
Yiyu Xiao, Qianqian Peng, Advaith Maya Sanjeev Kumar, Houda Alachkar

Abstract
Genes, proteins, chemicals, diseases, species, mutations and cell lines named across the full text — each resolved to its canonical identifier and authoritative record.
Click any figure to enlarge with its caption.
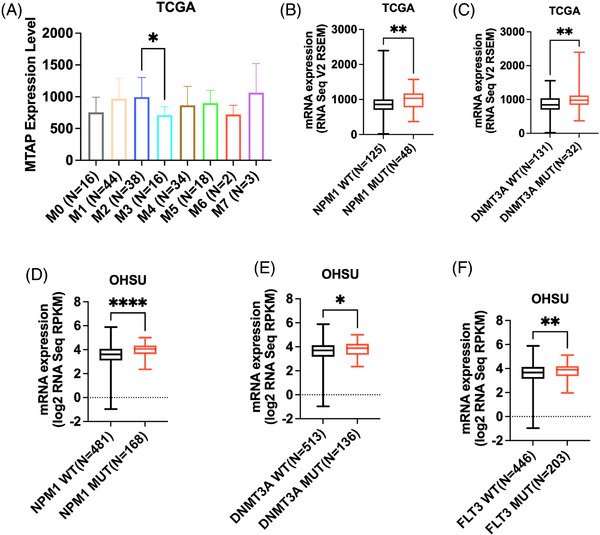 Figure 1
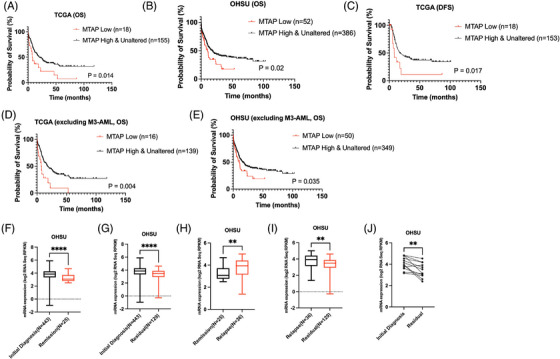 Figure 2
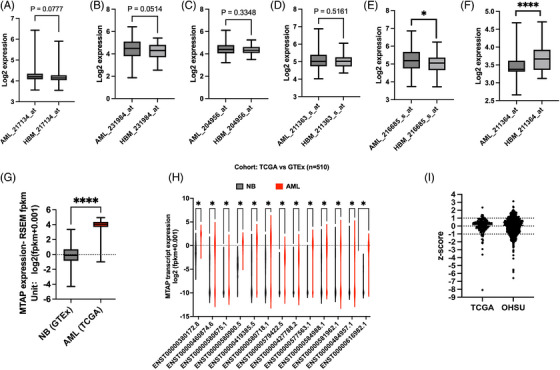 Figure 3
- —NIH‐NCI
- —University of Southern California 10.13039/100006034
- —School of Pharmacy Seed Fund
- —Norris Cancer Center pilot fund
- —STOP Cancer pilot funding
- —NIH 10.13039/100000002
Peer Reviews
No public reviews on file for this paper yet. If you reviewed it on a platform where reviews are public (OpenReview, ICLR, NeurIPS, ICML), you can paste yours below so the community can read it here.
Videos
No videos yet. Explain this paper in a talk, walkthrough, or lecture? Add one.
Taxonomy
TopicsAcute Myeloid Leukemia Research · Autoimmune and Inflammatory Disorders Research · Gestational Trophoblastic Disease Studies
Dear Editor,
Deletions of methylthioadenosine phosphorylase (MTAP) are frequent in several malignancies and lead to 5′‐deoxy‐5′‐methylthioadenosine (MTA) accumulation, competing with S‐adenosylmethionine (SAM) for binding to Protein Arginine Methyltransferase 5 (PRMT5) and enhancing tumour sensitivity to PRMT5 inhibitors.1, 2 Although MTAP enzyme deficiency has been documented in acute myeloid leukaemia (AML), deletions of the MTAP gene have not been identified in this haematological malignancy. Here we evaluated MTAP downregulation in AML datasets (TCGA and OHSU)3, 4, 5, 6, 7 and its associations with clinical and molecular characteristics and patient's clinical outcome.
When comparing the MTAP expression between AML bone marrow (BM) (n = 542) and healthy BM (n = 73), different MTAP probes showed different results (MILE dataset,8 Figure 1A–F). However, when comparing the GTEx and TCGA datasets on UCSC Xena,9 we found higher MTAP expression in AML blood (n = 173) than normal blood samples (n = 337) (median‐log2: 4.040 vs. −0.199, *p *= 6.596e^−197^, Figure 1G). Thirteen transcripts of MTAP were differentially expressed (Figure 1H). While only one deep deletion case was identified in AML in the TCGA dataset, using Z‐score < −1 to define low expressor MTAP, we found 10.40% and 16.84% of cases have low MTAP expression in the TCGA and OHSU, respectively (Figure 1I).
To investigate whether low expression of MTAP is associated with specific baseline clinical features in patients with AML, we compared the frequency of MTAP low expression according to diagnosis age, sex, BM blast percentage, white blood cell count, peripheral blasts percentage, cytogenetic risk and molecular risk (Tables S1 and S2). In the TCGA dataset, we found MTAP low expression to be more frequent in older patients (diagnosis age ≥ 65 years) than in younger patients (diagnosis age < 65 years) (18.87% vs. 6.67%, *p *= .027). MTAP expression levels were found to be lower in patients with AML M3 (n = 16) than AML M2 (n = 38) (p = .030, Figure 2A).
We also assessed the association between MTAP low expression and AML molecular characteristics in terms of the presence of certain AML mutations (Tables S3 and S4). We compared the frequencies of FLT3, DNMT3A, NPM1, IDH2, IDH1 and TP53 mutations between low and unaltered/high MTAP patients. In OHSU, patients with MTAP low expression have a lower frequency of FLT3 mutations (17.3% vs. 32.1%, p = .036) and NPM1 mutation (3.8% vs. 30.6%, p < .001) compared with unaltered/high MTAP group. MTAP was expressed at significantly higher levels in patients with NPM1 mutation (median‐log2, TCGA: 1037 vs. 857.5, *p *= .0018, adjusted‐p = .0112; OHSU: 4.058 vs. 3.606, *p *< .001, adjusted‐p < .001), DNMT3A mutation (median‐log2, TCGA: 980.3 vs. 844.0, p = .0094, adjusted‐p = .0569; OHSU: 3.887 vs. 3.702, p = .048, adjusted‐p = .288), FLT3 mutation (median‐log2, OHSU: 3.905 vs. 3.670, p = .007, adjusted‐p = .044), compared with patients carrying wild type genes (Figure 2B–F).
Survival analyses showed that the overall survival (OS) of MTAP‐low patients was significantly shorter than that of unaltered/high MTAP patients (MTAP‐low patients vs. MTAP‐ unaltered/high patients; median‐OS [months]: TCGA: 7.5 vs. 20.5, *p *= .014; OHSU: 10.16 vs. 17.79, *p *= .02, Figure 3A,B). Additionally, the disease‐free survival (DFS) of MTAP‐low patients was significantly lower than MTAP‐unaltered/high patients in the TCGA dataset (MTAP‐low patients (n = 18) vs. MTAP‐unaltered/high patients (n = 153); median‐DFS (months): 8.200 vs. 17.00, *p *= .017, Figure 3C). The OHSU dataset does not contain DFS data. We also conducted survival analyses after the exclusion of patients with AML M3, and patients with no available FAB data, due to the favourable prognosis of all‐trans retinoic acid therapy. MTAP‐low patients still have worse outcomes compared with MTAP‐unaltered/high patients (TCGA: MTAP‐low patients (n = 16) vs. MTAP‐unaltered/high patients (n = 139); median OS (months): 7.200 vs. 17.40, *p *= 0.004, OHSU: MTAP‐low patients (n = 50) vs. MTAP‐unaltered/high patients (n = 349); 10.16 vs. 15.52, *p *= 0.035, Figure 3D,E). Multivariable analysis (cox‐regression model) showed that MTAP low expression is significantly associated with OS (TCGA: *p *= 0.026; OHSU: *p *= 0.031) when adjusted by age, *DNMT3A‐*mutation, *TP53‐*mutation, *FLT3‐*mutation (Table 1).
When comparing MTAP expression at different disease statuses in the OHSU dataset (initial diagnosis, remission, residual and relapse), we found MTAP expression levels were significantly higher at diagnosis (n = 443) than at remission (n = 25, median‐log2: 3.855 vs. 3.073, *p *< .001, Figure 3F) or at residual disease (n = 129, median‐log2: 3.855 vs. 3.491, p < .001, Figure 3G). MTAP expression was significantly higher at relapse (n = 36) than at remission (n = 25) (median‐log2: 3.938 vs 3.073, *p *= .003, Figure 3H) and at residual disease (n = 129) (median‐log2: 3.938 vs. 3.491, *p *= .002, Figure 3I). Consistently, MTAP expression levels were significantly higher in initial diagnosis compared with that in patients with residual disease when comparing samples from the same patients (n = 12, p = .001, Figure 3J).
Studies using synthetic lethal screens have shown that MTAP‐deleted cells exhibit higher sensitivity to downregulation of PRMT5. MTAP‐deleted cancer cells are particularly vulnerable to further inhibition of PRMT5 by the MTA‐cooperative PRMT5 inhibitor MRTX1719.2 This therapeutic approach selectively inhibits the PRMT5‐MTA complex in MTAP‐deficient cells.
MTA is generated through polyamine synthesis in which arginine is metabolized into ornithine and then into polyamines. Polyamine metabolism plays a key role in leukaemia stem cell survival and presents a potential therapeutic target in AML.10 It is plausible that MTA accumulation plays an important metabolic vulnerability in AML cells, and thus MTA levels should be evaluated in patients with AML. Therapeutic strategies that are proven effective in MTAP‐deleted cancers such as PRMT5 inhibitors and MTA‐cooperative PRMT5 inhibitors should be investigated in the context of low MTA AML.
Altogether, our study reveals the association between low MTAP expression and shorter overall survival and the absence of NPM1 mutation in patients with AML. Whether this is a causative association, what underlying mechanism of unfavourable clinical outcomes in patients with low MTAP expression, and whether MTAP low expression may lead to enhanced sensitivity to PRMT5 inhibitors remain to be studied.
AUTHOR CONTRIBUTIONS
Yiyu Xiao and Qianqian Peng: data analysis, validation and visualization, writing‐original draft, reviewing‐editing and methodology. Advaith Maya Sanjeev Kumar: data curation, analyses and validation, methodology. Houda Alachkar: conceptualization, resources, supervision, funding, validation, writing original draft, project administration, writing review and editing. All authors contributed to the article and approved the submitted version.
CONFLICT OF INTEREST STATEMENT
The authors declare no conflict of interest.
FUNDING INFORMATION
This study was supported by the University of Southern California Grant no. NIH‐NCI 1R01CA248381‐01A1 and National Institutes of Health (NIH) Grant no. 5P30CA014089‐45.
ETHICS STATEMENT
Ethical approval was not required for the studies involving humans because this study was conducted on a publicly available dataset. The studies were conducted in accordance with the local legislation and institutional requirements. Written informed consent to participate in this study was not required from the participants or the participants’ legal guardians/next of kin in accordance with the national legislation and the institutional requirements.
Supporting information
Supporting Information
The reference list from the paper itself. Each links out to its DOI / PubMed record.
- 1Pegg AE , Williams‐Ashman HG . On the role of S‐adenosyl‐L‐methionine in the biosynthesis of spermidine by rat prostate. J Biol Chem. 1969;244(4):682‐693.4889860 · pubmed ↗
- 2Engstrom LD , Aranda R , Waters L , et al. MRTX 1719 is an MTA‐cooperative PRMT 5 inhibitor that exhibits synthetic lethality in preclinical models and patients with MTAP‐deleted cancer. Cancer Discov. 2023;13(11):2412‐2431. doi:10.1158/2159-8290.CD-23-0669 37552839 PMC 10618744 · doi ↗ · pubmed ↗
- 3de Bruijn I , Kundra R , Mastrogiacomo B , et al. Analysis and visualization of longitudinal genomic and clinical data from the AACR Project GENIE Biopharma Collaborative in c Bio Portal. Cancer Res. 2023;83(23):3861‐3867. Published online September 5, 2023. doi:10.1158/0008-5472.CAN-23-0816 37668528 PMC 10690089 · doi ↗ · pubmed ↗
- 4Ceramil E , Gao J , Dogrusoz U , et al. The c Bio cancer genomics portal: an open platform for exploring multidimensional cancer genomics data. Cancer Discov. 2012;2(5):401‐404. doi:10.1158/2159-8290.CD-12-0095 22588877 PMC 3956037 · doi ↗ · pubmed ↗
- 5Gao J , Aksoy BA , Dogrusoz U , et al. Integrative analysis of complex cancer genomics and clinical profiles using the c Bio Portal. Sci Signal. 2013;6(269):pl 1. doi:10.1126/scisignal.2004088 23550210 PMC 4160307 · doi ↗ · pubmed ↗
- 6Cancer Genome Atlas Research Network , Ley TJ , Miller C , et al. Genomic and epigenomic landscapes of adult de novo acute myeloid leukemia. N Engl J Med. 2013;368(22):2059‐2074. doi:10.1056/NEJ Moa 1301689 23634996 PMC 3767041 · doi ↗ · pubmed ↗
- 7Bottomly D , Long N , Schultz AR , et al. Integrative analysis of drug response and clinical outcome in acute myeloid leukemia. Cancer Cell. 2022;40(8):850‐864. e 9. doi:10.1016/j.ccell.2022.07.002 35868306 PMC 9378589 · doi ↗ · pubmed ↗
- 8Haferlach T , Kohlmann A , Basso G , et al. The clinical utility of microarray‐based gene expression profiling in the diagnosis and sub‐classification of leukemia: final report on 3252 cases from the International MILE Study Group. Blood. 2008;112(11):753. doi:10.1182/blood.V 112.11.753.753 · doi ↗