South Asia’s COVID-19 History and Surveillance: Updated Epidemiological Assessment
Lori A Post, Alan G Soetikno, Scott A Wu, Claudia Hawkins, Maryann Mason, Egon A Ozer, Robert L Murphy, Sarah B Welch, Yingxuan Liu, Robert J Havey, Charles B Moss, Chad J Achenbach, Alexander L Lundberg

TL;DR
This study analyzes South Asia's COVID-19 data to determine if the region transitioned from pandemic to endemic status by May 2023, when the WHO ended the public health emergency.
Contribution
The study provides updated surveillance data and genomic analysis to confirm that South Asia's transmission rate had fallen below pandemic thresholds by the WHO's declaration.
Findings
South Asia's weekly transmission speed remained below the outbreak threshold for over a year before the WHO declaration.
Omicron became the dominant variant in late 2021 and persisted without significant changes in transmission patterns.
Surveillance metrics confirm that the pandemic had ended in South Asia by May 2023.
Abstract
This study updates our findings from the COVID-19 pandemic surveillance we first conducted in South Asia in 2020 with 2 additional years of data for the region. We assess whether COVID-19 had transitioned from pandemic to endemic at the point the World Health Organization (WHO) ended the public health emergency status for COVID-19 on May 5, 2023. First, we aim to measure whether there was an expansion or contraction in the pandemic in South Asia around the WHO declaration. Second, we use dynamic and genomic surveillance methods to describe the history of the pandemic in the region and situate the window of the WHO declaration within the broader history. Third, we aim to provide historical context for the course of the pandemic in South Asia. In addition to updating the traditional surveillance data and dynamic panel estimates from our original study, this study used data on sequenced…
Genes, proteins, chemicals, diseases, species, mutations and cell lines named across the full text — each resolved to its canonical identifier and authoritative record.
Click any figure to enlarge with its caption.
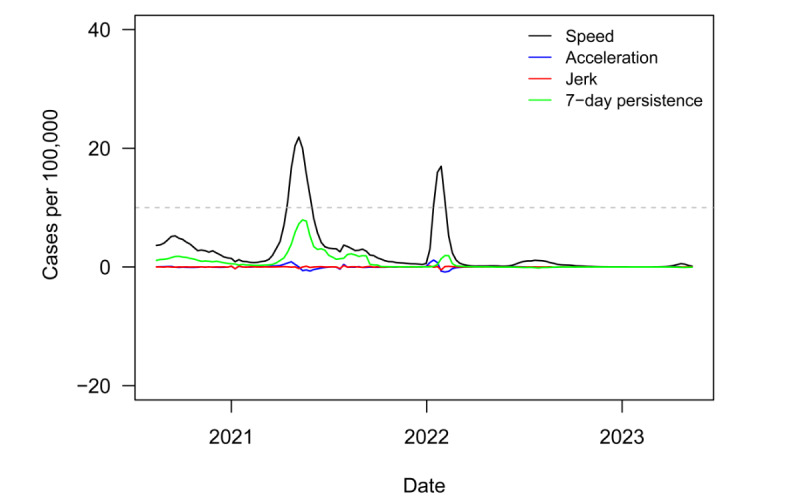 Figure 1
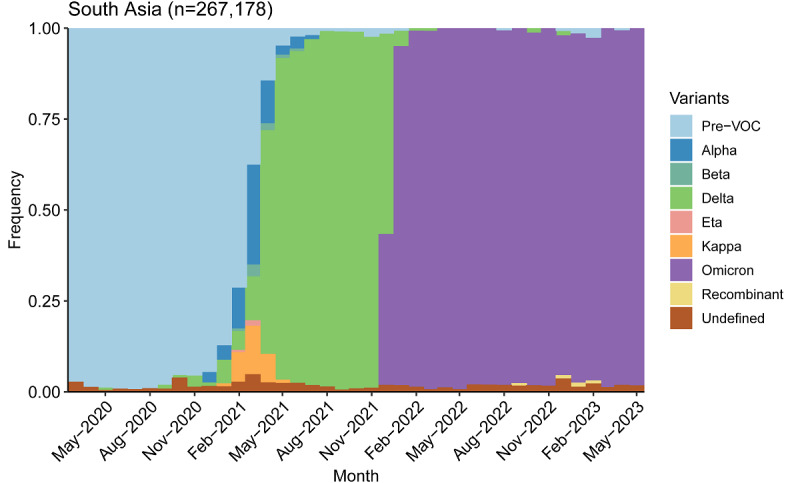 Figure 2
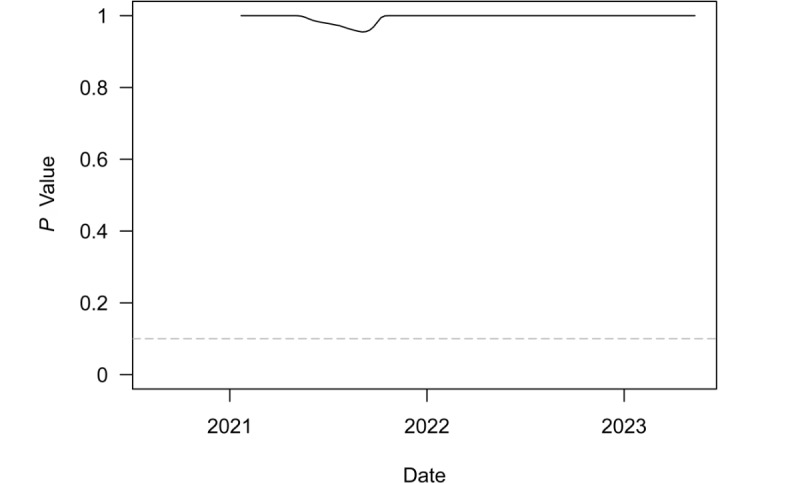 Figure 3
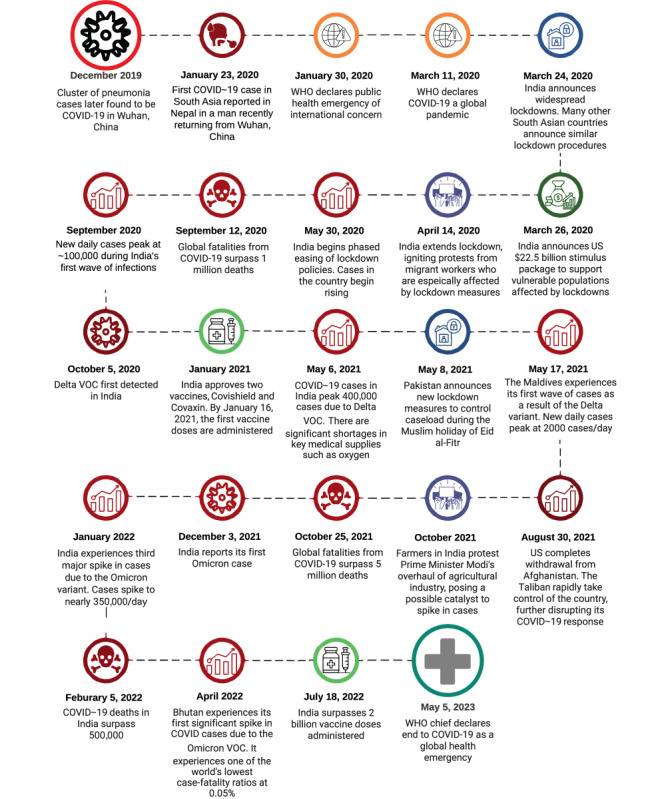 Figure 4
| Variable | Value | |
| 1-day persistence coefficient | 1.168 | <.001 |
| 7-day persistence coefficient | –0.185 | <.001 |
| Shift parameter for week of April 28 | 0.052 | .03 |
| Shift parameter for week of May 5 | –0.044 | .13 |
| Weekend | 0.051 | .33 |
| Country | New COVID-19 cases, n | Cumulative COVID-19 cases, n | 7-day moving average of new cases | Weekly transmission rate per 100,000 population | New deaths, n | Cumulative deaths, n | 7-day moving average of deaths | Death rate per 100,000 individuals | Conditional death rate |
| Afghanistan | 198 | 216,396 | 252.57 | 0.48 | 1 | 7894 | 0.29 | 0 | 0.04 |
| Bangladesh | 9 | 2,038,300 | 13.29 | 0.01 | 0 | 29,446 | 0 | 0 | 0.01 |
| Bhutan | 0 | 62,666 | 0.14 | 0 | 0 | 21 | 0 | 0 | 0 |
| India | 3611 | 44,964,289 | 4563.57 | 0.25 | 36 | 531,642 | 24.86 | 0 | 0.01 |
| Maldives | 15 | 186,435 | 21.57 | 19.76 | 0 | 313 | 0 | 0.20 | 0 |
| Nepal | 17 | 1,003,081 | 23.14 | 0.06 | 0 | 12,031 | 0.29 | 0 | 0.01 |
| Pakistan | 0 | 1,580,631 | 0 | 0 | 0 | 30,656 | 0 | 0 | 0.02 |
| Sri Lanka | 6 | 672,194 | 5.86 | 0.03 | 0 | 16,844 | 0.43 | 0 | 0.03 |
| Country | New COVID-19 cases, n | Cumulative COVID-19 cases, n | 7-day moving average of new cases | Weekly transmission rate per 100,000 population | New deaths, n | Cumulative deaths, n | 7-day moving average of deaths | Death rate per 100,000 individuals | Conditional death rate |
| Afghanistan | 235 | 218,454 | 294 | 0.57 | 3 | 7907 | 1.86 | 0.01 | 0.04 |
| Bangladesh | 23 | 2,038,453 | 21.86 | 0.01 | 0 | 29,446 | 0 | 0 | 0.01 |
| Bhutan | 0 | 62,668 | 0 | 0 | 0 | 21 | 0 | 0 | 0 |
| India | 1580 | 44,978,179 | 1984.29 | 0.11 | 17 | 531,753 | 15.86 | 0 | 0.01 |
| Maldives | 9 | 186,526 | 10.57 | 12.36 | 0 | 314 | 0.14 | 0.15 | 0 |
| Nepal | 21 | 1,003,205 | 17.71 | 0.07 | 0 | 12,031 | 0 | 0 | 0.01 |
| Pakistan | 0 | 1,580,631 | 0 | 0 | 0 | 30,656 | 0 | 0 | 0.02 |
| Sri Lanka | 24 | 672,265 | 10.14 | 0.11 | 0 | 16,851 | 1 | 0 | 0.03 |
| Country | Speed | Acceleration | Jerk | 7-day persistence effect on speed |
| Afghanistan | 0.61 | –0.04 | –0.14 | –0.03 |
| Bangladesh | 0.01 | 0 | 0 | 0 |
| Bhutan | 0.05 | 0 | 0 | –0.02 |
| India | 0.32 | –0.04 | 0.01 | –0.06 |
| Maldives | 28.70 | –2.70 | –0.27 | –3.87 |
| Nepal | 0.08 | –0.02 | 0.01 | –0.02 |
| Pakistan | 0 | 0 | 0 | 0 |
| Sri Lanka | 0.03 | 0 | 0 | 0 |
| Country | Speed | Acceleration | Jerk | 7-day persistence effect on speed |
| Afghanistan | 0.71 | 0.01 | 0.07 | –0.08 |
| Bangladesh | 0.01 | 0 | 0 | 0 |
| Bhutan | 0.04 | 0 | 0 | –0.01 |
| India | 0.14 | –0.02 | 0 | –0.04 |
| Maldives | 14.12 | –1.06 | 0.37 | –3.83 |
| Nepal | 0.06 | 0 | 0.01 | –0.01 |
| Pakistan | 0 | 0 | 0 | 0 |
| Sri Lanka | 0.05 | 0.01 | 0.01 | 0 |
Peer Reviews
No public reviews on file for this paper yet. If you reviewed it on a platform where reviews are public (OpenReview, ICLR, NeurIPS, ICML), you can paste yours below so the community can read it here.
Videos
No videos yet. Explain this paper in a talk, walkthrough, or lecture? Add one.
Taxonomy
TopicsCOVID-19 epidemiological studies · COVID-19 Clinical Research Studies · COVID-19 Pandemic Impacts
Introduction
COVID-19, the disease caused by the virus SARS-CoV-2, was first detected in Wuhan, China, in the fall of 2019 [1-5]. The first cases of COVID-19 in South Asia were reported in India on January 30, 2020. Our research team conducted an analysis of the pandemic in South Asia 1 year into the pandemic [6]. This study provides 2 additional years of updated surveillance and analysis for the region.
We adopt the World Bank’s definition of South Asia, which is based on economic development and geographical proximity, encompassing Afghanistan, Bangladesh, Bhutan, India, the Maldives, Nepal, Pakistan, and Sri Lanka [7].
The World Health Organization (WHO) and Director-General Tedros Adhanom Ghebreyesus declared the end of COVID-19 as a public health emergency of international concern on May 5, 2023 [8-10], based on the recommendation of the COVID-19 Emergency Committee [10]. We compare how the pandemic was progressing before and after the declaration.
Epidemiological terms, such as pandemic, epidemic, outbreak, and endemic, are used to describe the occurrence and spread of diseases [11,12]. The distinctions between these terms lie in their scope, geographic extent, and severity. An epidemic refers to a sudden increase in the number of disease cases in a specific population or region. If the epidemic spreads across several countries or continents, it becomes a pandemic. An outbreak, on the other hand, describes a sudden increase in a concentrated setting, usually involving a more limited geographic area than an epidemic. Endemic refers to the constant presence of a disease in a particular geographic region or population, with no sudden increases in case volume [13,14].
Public health surveillance is the “ongoing, systematic collection, analysis, and interpretation of health-related data essential to planning and evaluation of public health practice” [15]. Surveillance not only explains the burden of death and disease, but it generates research questions and guides researchers on topics that require further investigation [16-30]. Surveillance allows us to compare the burden of disease between geographic regions and to understand which regions are most impacted. The impact can be measured through rates of how many people contract a disease, how many die, and the affiliated costs.
Traditional surveillance carries several limitations that this study will address. Traditional surveillance provides a snapshot of what has already happened [16-30], meaning surveillance is static and focuses on the past. In the middle of a burgeoning pandemic, policy makers and public health practitioners also need to understand what is about to happen. Is an outbreak increasing? Will growth switch from linear to exponential? Are more people dying from that particular condition in one place than another? To inform health policy and practice, knowledge of what is about to happen is often more valuable than knowledge of what did happen. To that end, we have developed enhanced surveillance metrics that reflect the dynamics of a pandemic and inform imminent growth—most importantly, where along the epidemiological outbreak curve a particular region is situated. We also include dynamic metrics about the speed of the pandemic at the national, regional, and global level. We measure how acceleration of speed this week compares to last week, as well as how novel infections last week predict new cases this week. We can think of the latter measure as the echoing forward of cases. These metrics were tested and validated in prior research [31-42].
The novel indicators go beyond transmission rates to include acceleration, jerk, and 1- and 7-day persistence metrics. The transmission rate of new COVID-19 cases per 100,000 population is also known as the “speed” of the pandemic. The difference in speed from one time unit to another is called acceleration, which can identify whether the rate of new cases is increasing (positive acceleration), decreasing (negative acceleration), or stable (zero acceleration). With terminology from physics, “jerk” is the change in acceleration from one time unit to another, and a high jerk can indicate an explosive outbreak of disease. Lastly, 1- and 7-day persistence measures estimate the statistical impact of 1- and 7-day lagged speed on current speed. These two metrics are coefficient estimates from a dynamic panel data model [43].
In earlier work, this research team used the novel indicators to analyze the impact of reopening the economy on COVID-19 transmissions [41]. The metrics also assessed the status of the pandemic by global region, and they were used in policy briefs for public health decision-makers through the pandemic [44].
For the purposes of this study, standard surveillance metrics are those that explain what has already happened in South Asia, while enhanced surveillance metrics speak to what is about to happen or where along an epidemiological curve a country sits. We use both types of metrics to analyze the possible end to the pandemic in South Asia.
This study has 3 objectives. First, we aim to measure whether there was an expansion or contraction in the pandemic in South Asia when the WHO declared the end of the COVID-19 pandemic as a public health emergency of international concern on May 5, 2023 [8-10]. At both the region and country level, we use advanced surveillance and analytical techniques to describe the status of the pandemic in a 2-week window around the WHO declaration. From a public health perspective, we need to know whether the rate of new COVID-19 cases was increasing, decreasing, or stable from week to week, and if any changes in the transmission rate indicated an acceleration or deceleration of the pandemic. Statistical insignificance is significant—it can signal the epidemiological “end” to the pandemic if the rate of new cases is zero (or very low) and stable, meaning the number of new cases is neither accelerating nor decelerating.
Second, we use dynamic and genomic surveillance methods to describe the history of the pandemic in the region and situate the time window around the WHO declaration within the broader history. We include the ratio of COVID-19 deaths to the number of transmissions as a proxy for the mortality risk from infection at the population level. We also include a historical record of genomic surveillance from sequenced viral specimens to identify the appearance and spread of variants of concern (VOCs) in the region.
Third, we aim to provide historical context for the course of the pandemic in South Asia. We address several questions: How did countries respond to the pandemic? How did the region fare in terms of disease burden? What social, economic, and political factors shaped the course of COVID-19 in the region? This context can provide important lessons for disease prevention and mitigation in future pandemics.
Methods
Data Source
This study conducted trend analyses with longitudinal COVID-19 data from Our World in Data (OWID) [45]. OWID compiles data on COVID-19 cases and mortality from various sources, including individual websites, statistical reports, and press releases. This study provides updates for the original study by Welch et al [6] for traditional surveillance data and dynamic panel estimates [40,41,46,47]. For the region of South Asia, the data comprised an unbalanced panel of 8 countries and territories, running from August 14, 2020, to May 12, 2023. Because a number of countries around the world switched from daily to weekly reports at various points in 2023, we used a cubic spline to interpolate daily new cases and deaths if any country had 4 consecutive periods of nonzero new cases interspersed by 6 days of zero new cases.
To identify the appearance and duration of VOCs, we also used data on sequenced SARS-CoV-2 variants from the Global Initiative on Sharing All Influenza Data (GISAID), an effective and trusted web-based resource for sharing genetic, clinical, and epidemiological COVID-19 data [48-51]. We used Nextclade nomenclature [52] to collect clade designations from sequences and Pangolin nomenclature for lineage designations of SARS-CoV-2 [53,54]. Metadata for the location of the lab submitting individual specimens were accessed on June 22, 2023. To avoid low frequency or potentially erroneous samples, the data set was further filtered to exclude months with fewer than 100 available samples, variant groups with fewer than 5 samples in a month, and variant groups representing less than 0.5% of the total samples in a month. The final data set consisted of 184,386 total samples available on GISAID [48-51].
We analyzed the potential “statistical end” to the pandemic with a 1-sided t test for whether the mean of speed was equal to or greater than the outbreak threshold of 10. We ran the test on a rolling 6-month window over weekly speed for the region, and we plotted the P values from the test over time. All statistical analyses were conducted in R (version 4.2.1; R Foundation for Statistical Computing) with the plm package (version 2.6-2) [46].
Ethical Considerations
The data in this study are publicly available and contain no identifiable or private information. As defined by the 45CFR46:102 policy, the study does not qualify as human subjects research. Sources have been presented in the Data Availability statement.
Results
Table 1 presents the dynamic panel estimates for the most recent time window. The Wald test for the regression was significant (P<.001), and the Sargan test failed to reject the validity of the overidentification restrictions (P>.99). While the 1-day lag coefficient was statistically significant and positive (1.168), suggesting a cluster effect in which cases on a given day impact cases the next day, the broader persistence measure of the 7-day coefficient was negative (–0.185). Furthermore, the shift parameters for the most recent week were negative, meaning the clustering effect had become smaller in the week after the WHO declaration (but the shift parameter was positive and similar in magnitude for the prior week).
The dynamic panel estimates are motivated by limitations in the reproductive number, R_0_, which is the average number of people 1 contagious person will infect [55]. The central limitation is that R_0_ is influenced by many factors, such as individual behavior, vaccination rates, population density, and the transmissibility of a pathogen. Because the SARS-CoV-2 virus mutated many times, so has its R_0_, but continually updated estimates for R_0_ are difficult to obtain, as R_0_ depends not only on the transmissibility of SARS-CoV-2 but various other factors. Other factors, such as public health campaigns, have also evolved over time. The dynamic panel estimates are derived from a rolling 120-day window, so they adjust rapidly to new circumstances. The Arellano-Bond model is also robust to time-invariant, unobservable factors (ie, any stable differences between countries over the sample period), corrects for autocorrelation, and allows for statistical tests of model parameters [41].
The validity of the dynamic panel model can be partly assessed through the Wald and Sargan statistical tests. The former test checks whether the independent variables collectively have explanatory power for movements in the dependent variable. The Wald test was highly statistically significant (P<.001), implying a rejection of the null hypothesis that the independent variables do not explain the dependent variable. The Sargan test instead assesses the validity of the overidentifying restrictions assumed in the estimation of the model. Here, a rejection of the null would instead be evidence against the validity, but the test failed to reject with a P value approaching 1.
Static surveillance metrics for the weeks of April 28 and May 5, 2023, are provided in Tables 2 and 3. Aside from the Maldives, every country had a small number of new COVID-19 cases relative to the population. The highest transmission rate was observed in Afghanistan, where speed was 0.48 in the week of April 28 and 0.57 the following week. This speed was below the threshold considered a low transmission rate by the US Centers for Disease Control and Prevention (CDC) [31-42,56]. Specifically, a “low” transmission is considered no more than 10 cases per 100,000 people per week. “Moderate” transmission is 10 to 50 cases per 100,000 people per week. “Substantial” transmission is 50 to 100 [56,57].
Speed in the Maldives was 19 in the week of April 28 and 12 in the subsequent week. This rate of novel transmissions qualifies as a moderate outbreak, but we note that transmission rates often vacillate between high and low values in island nations. Based on the definition of a pandemic or an outbreak in several countries, the data indicate a shift from pandemic to endemic COVID-19 in South Asia, while it was epidemic in the Maldives.
A comparison of Tables 2 and 3 demonstrates little to no change before and after the WHO declared an end to the pandemic. Without question, India had the most cases of COVID-19 transmissions and deaths, but this rank is a function of population size. Thus, a better measure is the number of COVID-19 cases and deaths per 100,000 population. Moreover, death is often a better proxy for the state of an outbreak than transmissions because deaths are less likely to be undercounted [58]. Undercounting may be due to poor public health infrastructure, home antigen testing, or a dearth of polymerase chain reaction testing or other resources. While India reported 0.01 deaths per confirmed infection, several countries had higher rates. Afghanistan had the highest rate at 0.04, followed by Sri Lanka at 0.03 and Pakistan at 0.02. The relative risk of death per infection was modest in India compared to the region.
Tables 4 and 5 contain enhanced dynamic surveillance metrics for the 2 weeks before and after May 5. Again, speed was low for every country except the Maldives. Acceleration and jerk were both either small or negative for every country and territory, including the Maldives. The 7-day persistence effect on speed was also negative, suggesting a further reduction in the risk of outbreaks. These metrics suggest the pandemic may have indeed ended for the region. Because only a single territory was in a moderate outbreak, epidemiologically, COVID-19 would be considered an epidemic in the Maldives and not reach the threshold of a pandemic. We note that the figures in Tables 4 and 5 are not calculated as day-over-day averages across the week, as they are in Tables 2 and 3. Thus, the magnitudes of speed may not exactly match those in Tables 2 and 3.
Figure 1 plots regional speed, acceleration, jerk, and 7-day persistence metrics from August 14, 2020, to May 12, 2023. The dashed gray line denotes the informal CDC outbreak threshold of speed equal to 10. In terms of disease burden, South Asia was less affected by the pandemic than most other global regions. South Asia experienced 2 relatively small outbreaks. The first began in April of 2021, lasting less than 2 months and bringing a peak speed of 22 new COVID-19 cases per 100,000 population. The second, slightly smaller outbreak began in January of 2022, lasted only a month, and brought a peak speed of 17. The region has had low and stable speed ever since.
Novel surveillance metrics (speed, acceleration, jerk, 7-day persistence) for COVID-19 infections in South Asian countries from August 2020 to May 2023. The dashed gray line denotes the informal US Centers for Disease Control and Prevention outbreak threshold of speed equal to 10.
Figure 2 plots variant groups as a proportion of all viral specimens collected and sequenced in the region (and made available through GISAID) each month. Matching the timeline to Figure 1, the first regional outbreak was driven by the Delta variant, while the second outbreak was driven by Omicron. South Asia, like much of the rest of the world, saw a surge in cases amid the heightened transmissibility of Omicron [44]. However, the surge was much smaller in South Asia than in most other parts of the world.
Another potential indication of the end to the pandemic is the continued dominance of the Omicron variant. While the region saw a mixture of variants prior to the arrival of Omicron in December of 2021, viral sequences have almost exclusively returned as Omicron and its subvariants ever since.
Figure 3 plots P values from a series of 1-sided t tests to determine whether speed for the region was equal to or greater than the outbreak threshold of 10. These tests were conducted on a rolling 6-month window of weekly regional speed. The dashed gray line denotes the least restrictive conventional significance level threshold of α=.10. The test never rejected the null in favor of the alternative. In fact, the test statistic was totally insignificant outside of a brief, tiny dip in the P value over the period covering the Delta-driven outbreak. The continued lack of statistical significance ever since is consistent with the end to the pandemic in the region, as the test clearly failed to reject the null hypothesis that the weekly speed or transmission rate was lower than the outbreak threshold.
Variant groups as a proportion of all sequenced SARS-CoV-2 specimens from March 2020 to May 2023 in South Asia. VOC: variant of concern.
P values from t tests of weekly COVID-19 transmissions per 100,000 population equal to 10 over a rolling 6-month window in South Asia. The dashed gray line denotes the least restrictive conventional significance level threshold of α=.10.
Figure 4 provides a timeline of the onset of COVID-19 in South Asia, as well as vaccination programs and major events that shaped the course of the pandemic in the region, such as economic measures and political conflict.
Timeline of the COVID-19 pandemic in South Asia. VOC: variant of concern; WHO: World Health Organization.
Discussion
Principal Findings
While COVID-19 continues to circulate in South Asia, the rate of transmission had consistently remained below the outbreak threshold for well over a year prior to the WHO declaration. COVID-19 is endemic in the region, no longer meeting the criteria for pandemic classification. There has been neither significant acceleration nor deceleration in the region, and transmission rates remained below the threshold of an outbreak. Finally, the statistical echo-forward effect of COVID-19 cases on future cases had dissipated well before the WHO declared the end of the pandemic public health emergency. Both standard and enhanced surveillance metrics confirm that the pandemic had concluded by the time of the WHO declaration.
South Asia experienced independent rather than overlapping waves of COVID-19 [59]. The initial wave of COVID-19 in South Asia, while milder in caseload compared to Europe and the Americas, was influenced by a large population of migrant workers who moved across regions, increasing transmission risk [60]. Lockdowns led to reverse migration, facilitating virus spread [60,61]. India, Bangladesh, and Pakistan are home to 139 million migrant workers who traveled out of their home states for work [62]. As countries in the region instituted lockdowns, unemployed migrants [61-64] “reverse migrated” back to their residence of origin, creating a natural conduit for COVID-19 to spread in South Asia [60,65].
The second wave in early 2021 was severe, driven by the Delta variant. India reported over 400,000 daily cases, straining health care systems and causing oxygen shortages [66-68]. Due to high demand and a lack of health care infrastructure, many COVID-19 patients did not receive adequate treatment, resulting in higher mortality. Crematoriums and burial grounds were quickly overwhelmed [66,69-71]. Bangladesh, Pakistan, and Sri Lanka also experienced a rise in cases and deaths from the Delta-variant wave [72-75]. Afghanistan grappled with significant sociopolitical instability following the withdrawal of US troops from the country and the government takeover by the Taliban [76,77]. Still, South Asia fared relatively better than other regions, with lower transmission rates.
Economically, South Asia’s gross domestic product (GDP) contracted by 5.2% in 2020 due to lockdowns, with India’s GDP declining by 24.4% in Q2 2020 [78,79]. Governments implemented stimulus packages, including cash support, corporate incentives, and health care investments [75,76]. As vaccines became available, economies began recovering, with the region’s GDP growing by 8% in 2021 [78-80].
Policies Implemented to Control and Mitigate the Transmission of COVID-19
COVID-19 containment strategies in South Asia included masking, border closures, contact tracing, social distancing, quarantines, and lockdowns. India’s phased reopening faced challenges [79]. Pakistan attempted to ease restrictions in April 2020 and had to partially reverse course due to a second wave of infections [79]. Afghanistan struggled due to health care limitations and political instability [76].
South Asian countries aimed for herd immunity through vaccination. India initiated a massive vaccination campaign in January 2021 [81]. Supply chain issues affected progress, contributing to the Delta variant’s impact [82]. Vaccine hesitancy prompted public health campaigns in some countries [83-85].
Even though South Asia has shifted from pandemic to endemic, there is a possibility that a novel VOC could potentially be more transmissible, resistant to vaccines, or cause more severe illness. This underlines the importance of continued vigilance, vaccination efforts, and global cooperation to control the spread of the virus. [39].
Limitations
COVID-19 data had become less frequently reported around the world by the time the WHO declared an end to the pandemic public health emergency [86]. Additionally, more people began to use at-home tests as the pandemic evolved, leading to an undercount of cases [87]. Because the enhanced surveillance metrics of speed, acceleration, jerk, and 7-day persistence are based on rates, not total counts, statistical bias caused by countries dropping in or out of the sample is mitigated, but to the extent that a nonincluded country is unrepresentative of the region in disease burden, the omission of a country or territory can still influence historical data comparisons. Viral specimen tests for VOCs in GISAID are also dependent on testing and sequencing capacity, which varies by country across the region.
Conclusion
Although South Asia experienced only 2 brief outbreaks of COVID-19 during the pandemic, its disease burden was still somewhat high due to its population size, with well over 500,000 deaths. One of the most important lessons from the COVID-19 pandemic is preparedness for future pandemics. At the country level, an epidemiological task force with rapid, widespread testing capacity and a contact-tracing system should be prioritized [88]. Lockdown policies are effective but may have heightened economic costs in less economically developed countries [89]. Indicators of preparedness from a regional perspective might help identify countries in need of support, as measures of governance are positively associated with, for example, vaccination rates [90,91]. Thus, cooperation at the regional level will be a continued necessity for effective disease mitigation in future pandemics [92,93].
The reference list from the paper itself. Each links out to its DOI / PubMed record.
- 1Muralidar S Ambi SV Sekaran S Krishnan UM The emergence of COVID-19 as a global pandemic: Understanding the epidemiology, immune response and potential therapeutic targets of SARS-Co V-2Biochimie 20201217985100 10.1016/j.biochi.2020.09.01832971147 S 0300-9084(20)30224-832971147 PMC 7505773 · doi ↗ · pubmed ↗
- 2Sharma A Ahmad Farouk I Lal SKCOVID-19: a review on the novel coronavirus disease evolution, transmission, detection, control and prevention Viruses 20210129132202 10.3390/v 1302020233572857 v 1302020233572857 PMC 7911532 · doi ↗ · pubmed ↗
- 3Chilamakuri R Agarwal SCOVID-19: characteristics and therapeutics Cells 20210121102206 10.3390/cells 1002020633494237 cells 1002020633494237 PMC 7909801 · doi ↗ · pubmed ↗
- 4Hu B Guo H Zhou P Shi Z Characteristics of SARS-Co V-2 and COVID-19Nat Rev Microbiol 202103193141154 10.1038/s 41579-020-00459-73302430710.1038/s 41579-020-00459-733024307 PMC 7537588 · doi ↗ · pubmed ↗
- 5Seyed Hosseini E Riahi Kashani N Nikzad H Azadbakht J Hassani Bafrani H Haddad Kashani H The novel coronavirus disease-2019 (COVID-19): mechanism of action, detection and recent therapeutic strategies Virology 20201255119 10.1016/j.virol.2020.08.01133010669 S 0042-6822(20)30172-033010669 PMC 7513802 · doi ↗ · pubmed ↗
- 6Welch SB Kulasekere DA Prasad PVV Moss CB Murphy RL Achenbach CJ Ison MG Resnick D Singh L White J Issa TZ Culler K Boctor MJ Mason M Oehmke JF Faber JMM Post LA The interplay between policy and COVID-19 outbreaks in South Asia: longitudinal trend analysis of surveillance data JMIR Public Health Surveill 2021061776 e 24251 10.2196/2425134081593 v 7i 6e 2425134081593 PMC 8213065 · doi ↗ · pubmed ↗
- 7The world by region World Bank 2024-07-23 https://datatopics.worldbank.org/sdgatlas/archive/2017/the-world-by-region.html
- 8Smith-Schoenwalder C When does the COVID-19 pandemic end?U.S. News and World Report 202305122023-09-12 https://tinyurl.com/mvek 589t