Mirabegron 50 mg once daily, long-term treatment maximizes benefit in middle-aged and older people with overactive bladder syndrome: a systematic review and meta-analysis of nine phase II/III, randomized, double-blind, parallel-design, placebo-controlled, multicenter, and multinational trials
Xiangxiang Zhang, Yinhui Mao, Yang Liu, Jilei Sun, Juntao Sun, Chenli Pan, Zhuo Wang, Zhitao Wei, Yong Yang

TL;DR
A review of nine clinical trials found that mirabegron 50 mg daily is most effective for treating overactive bladder in middle-aged and older adults.
Contribution
This study provides a meta-analysis showing that mirabegron 50 mg daily is optimal for long-term treatment of overactive bladder in older populations.
Findings
Mirabegron 50 mg daily increased voided volume and reduced micturitions and incontinence episodes.
Treatment improved quality of life with tolerable adverse events similar to placebo.
50 mg was recommended as the optimal dose for long-term use.
Abstract
The prevalence and severity of overactive bladder increase with age, and mirabegron is an approved treatment for this condition. This meta-analysis systematically evaluated the efficacy and safety of mirabegron compared with placebo for overactive bladder treatment. We searched PubMed and the Cochrane Library (30 October 2023) for relevant articles (source: MEDLINE, EMBASE, ClinicalTrials.gov, ICTRP, CINAHL). We included randomized controlled trials involving adults with overactive bladder syndrome that compared mirabegron with placebo treatment. Data were analyzed according to the Cochrane Handbook for Systematic Reviews of Interventions [Review Manager (computer program) Version 5.4]. Nine parallel-group trials (10 articles) were included. The evaluation included a total of 8,527 adults, including 6,445 women and 2,082 men, of whom 5,726 were White, 2,462 were Asian, and 161 were…
Genes, proteins, chemicals, diseases, species, mutations and cell lines named across the full text — each resolved to its canonical identifier and authoritative record.
Click any figure to enlarge with its caption.
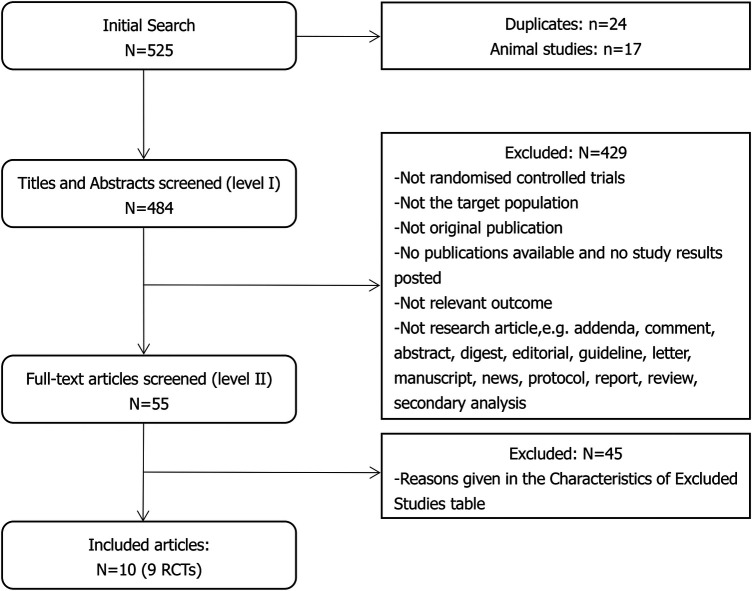 Figure 1
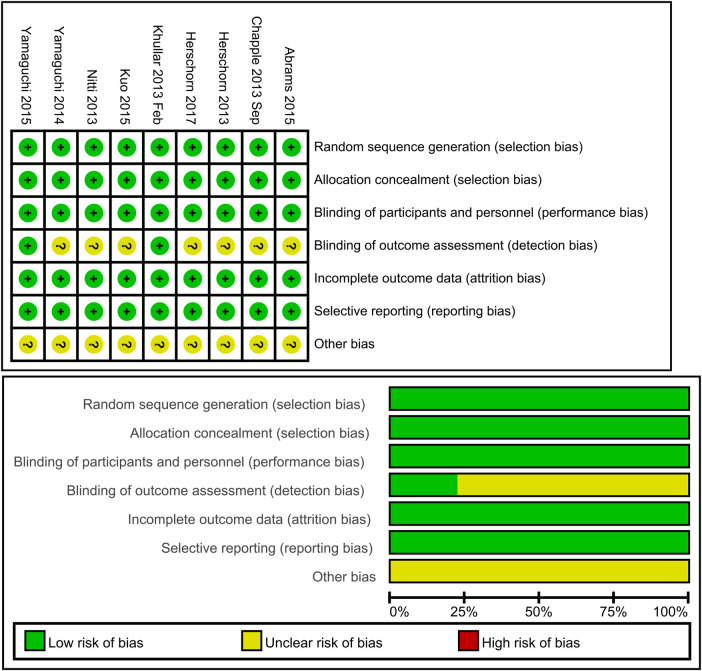 Figure 2
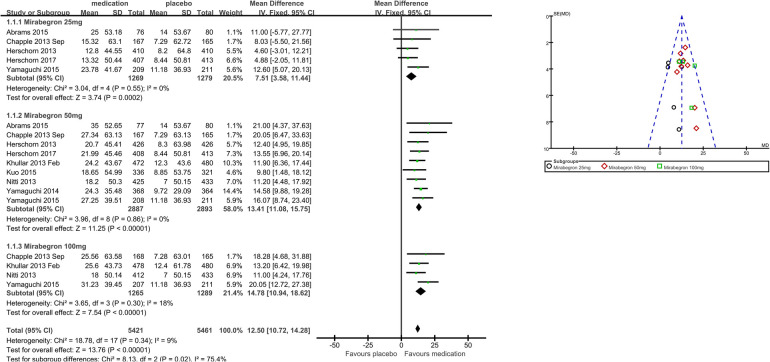 Figure 3
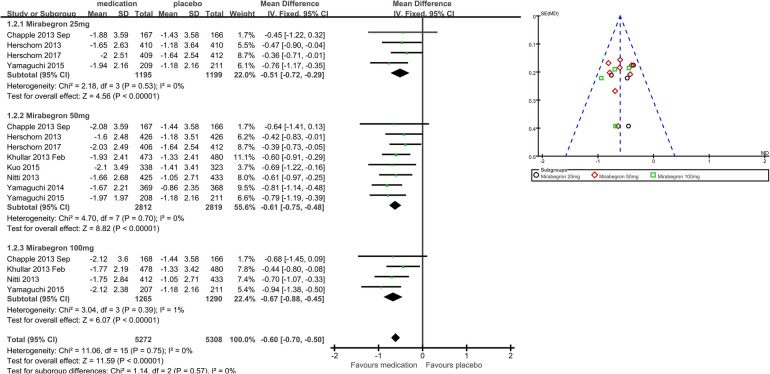 Figure 4
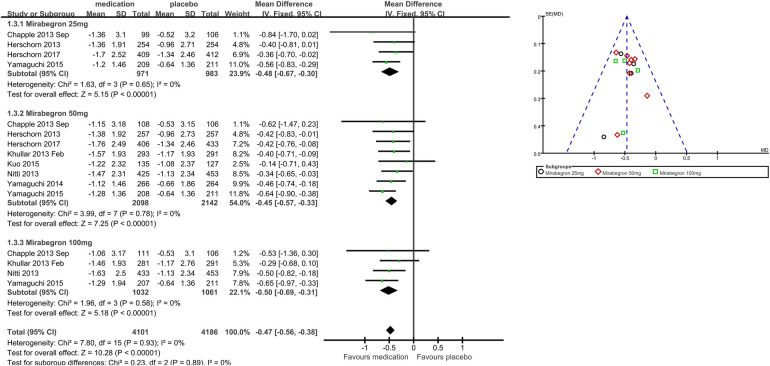 Figure 5
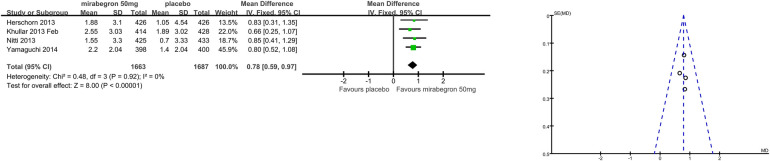 Figure 6
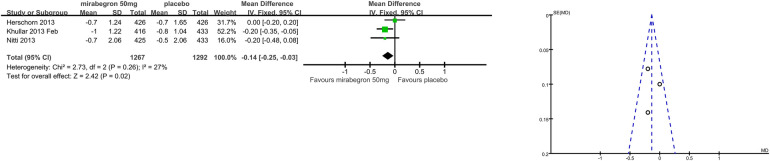 Figure 7
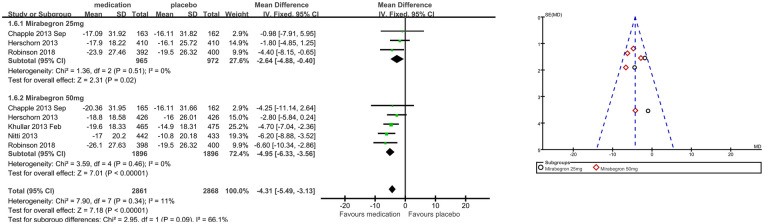 Figure 8
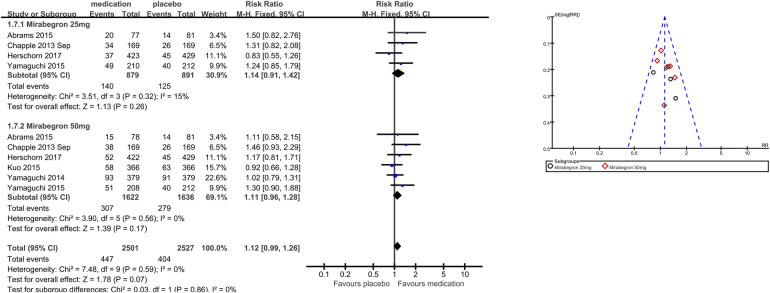 Figure 9
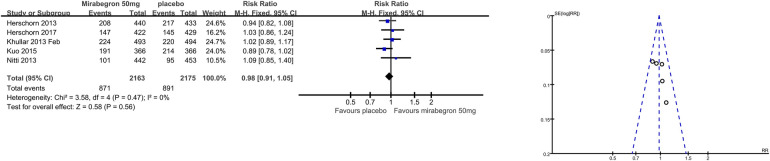 Figure 10
| #1 | “Urinary Bladder, Overactive”[Mesh] |
| #2 | (Overactive Bladder[Title/Abstract) OR (Overactive Urinary Bladder[Title/Abstract) OR (Bladder, Overactive[Title/Abstract) OR (Overactive Detrusor[Title/Abstract) OR (Detrusor, Overactive[Title/Abstract) OR (Overactive Detrusor Function[Title/Abstract) OR (Detrusor Function, Overactive[Title/Abstract) |
| #3 | (((((((“Urinary Bladder, Overactive”[Mesh) OR (Overactive Bladder[Title/Abstract)) OR (Overactive Urinary Bladder[Title/Abstract)) OR (Bladder, Overactive[Title/Abstract)) OR (Overactive Detrusor[Title/Abstract)) OR (Detrusor, Overactive[Title/Abstract)) OR (Overactive Detrusor Function[Title/Abstract)) OR (Detrusor Function, Overactive[Title/Abstract) |
| #4 | “mirabegron” [Supplementary Concept] |
| #5 | (Betmiga[Title/Abstract) OR (2-(2-aminothiazol-4-yl)-4′-(2-((2-hydroxy-2-phenylethyl)amino)ethyl)acetanilide[Title/Abstract) OR (Betanis[Title/Abstract) OR (YM 178[Title/Abstract) OR (YM-178[Title/Abstract) |
| #6 | (((((“mirabegron” [Supplementary Concept) OR (Betmiga[Title/Abstract)) OR (2-(2-aminothiazol-4-yl)-4′-(2-((2-hydroxy-2-phenylethyl)amino)ethyl)acetanilide[Title/Abstract)) OR (Betanis[Title/Abstract)) OR (YM 178[Title/Abstract)) OR (YM-178[Title/Abstract) |
| #7 | (((((((randomized controlled trial[pt) OR (controlled clinical trial[pt)) OR (randomized[tiab)) OR (placebo[tiab)) OR (drug therapy [sh)) OR (randomly[tiab)) OR (trial [tiab)) OR (groups[tiab) |
| #8 | (((((((((“Urinary Bladder, Overactive"[Mesh) OR (Overactive Bladder[Title/Abstract)) OR (Overactive Urinary Bladder[Title/Abstract)) OR (Bladder, Overactive[Title/Abstract)) OR (Overactive Detrusor[Title/Abstract)) OR (Detrusor, Overactive[Title/Abstract)) OR (Overactive Detrusor Function[Title/Abstract)) OR (Detrusor Function, Overactive[Title/Abstract)) AND ((((((“mirabegron” [Supplementary Concept) OR (Betmiga[Title/Abstract)) OR (2-(2-aminothiazol-4-yl)-4′-(2-((2-hydroxy-2-phenylethyl)amino)ethyl)acetanilide[Title/Abstract)) OR (Betanis[Title/Abstract)) OR (YM 178[Title/Abstract)) OR (YM-178[Title/Abstract))) AND ((((((((randomized controlled trial[pt) OR (controlled clinical trial[pt)) OR (randomized[tiab)) OR (placebo[tiab)) OR (drug therapy [sh)) OR (randomly[tiab)) OR (trial [tiab)) OR (groups[tiab)) |
| Outcome or subgroup | Studies | Participants | Statistical method | Effect estimate |
|---|---|---|---|---|
| 1.1 Mean volume voided per micturition | 9 | 10,882 | Mean difference (IV, fixed, 95% CI) | 12.50 (10.72, 14.28) |
| 1.1.1 Mirabegron 25 mg | 5 | 2,548 | Mean difference (IV, fixed, 95% CI) | 7.51 (3.58, 11.44) |
| 1.1.2 Mirabegron 50 mg | 9 | 5,780 | Mean difference (IV, fixed, 95% CI) | 13.41 (11.08, 15.75) |
| 1.1.3 Mirabegron 100 mg | 4 | 2,554 | Mean difference (IV, fixed, 95% CI) | 14.78 (10.94, 18.62) |
| 1.2 Micturitions in 24 h | 8 | 10,580 | Mean difference (IV, fixed, 95% CI) | −0.60 (−0.70, −0.50) |
| 1.2.1 Mirabegron 25 mg | 4 | 2,394 | Mean difference (IV, fixed, 95% CI) | −0.51 (−0.72, −0.29) |
| 1.2.2 Mirabegron 50 mg | 8 | 5,631 | Mean difference (IV, fixed, 95% CI) | −0.61 (−0.75, −0.48) |
| 1.2.3 Mirabegron 100 mg | 4 | 2,555 | Mean difference (IV, fixed, 95% CI) | −0.67 (−0.88, −0.45) |
| 1.3 Incontinence episodes in 24 h | 8 | 8,287 | Mean difference (IV, fixed, 95% CI) | −0.47 (−0.56, −0.38) |
| 1.3.1 Mirabegron 25 mg | 4 | 1,954 | Mean difference (IV, fixed, 95% CI) | −0.48 (−0.67, −0.30) |
| 1.3.2 Mirabegron 50 mg | 8 | 4,240 | Mean difference (IV, fixed, 95% CI) | −0.45 (−0.57, −0.33) |
| 1.3.3 Mirabegron 100 mg | 4 | 2,093 | Mean difference (IV, fixed, 95% CI) | −0.50 (−0.69, −0.31) |
| 1.4 TS-VAS | 4 | 3,350 | Mean difference (IV, fixed, 95% CI) | 0.78 (0.59, 0.97) |
| 1.5 PPBC | 3 | 2,559 | Mean difference (IV, fixed, 95% CI) | −0.14 (−0.25, −0.03) |
| 1.6 OAB-q | 5 | 5,729 | Mean difference (IV, fixed, 95% CI) | −4.31 (−5.49, −3.13) |
| 1.6.1 Mirabegron 25 mg | 3 | 1,937 | Mean difference (IV, fixed, 95% CI) | −2.64 (−4.88, −0.40) |
| 1.6.2 Mirabegron 50 mg | 5 | 3,792 | Mean difference (IV, fixed, 95% CI) | −4.95 (−6.33, −3.56) |
| 1.7 TRAEs | 6 | 5,028 | Risk ratio (M-H, fixed, 95% CI) | 1.12 (0.99, 1.26) |
| 1.7.1 Mirabegron 25 mg | 4 | 1,770 | Risk ratio (M-H, fixed, 95% CI) | 1.14 (0.91, 1.42) |
| 1.7.2 Mirabegron 50 mg | 6 | 3,258 | Risk ratio (M-H, fixed, 95% CI) | 1.11 (0.96, 1.28) |
| 1.8 TEAEs | 5 | 4,338 | Risk ratio (M-H, fixed, 95% CI) | 0.98 (0.91, 1.05) |
- —Department of Science and Technology of Jilin Province
Peer Reviews
No public reviews on file for this paper yet. If you reviewed it on a platform where reviews are public (OpenReview, ICLR, NeurIPS, ICML), you can paste yours below so the community can read it here.
Videos
No videos yet. Explain this paper in a talk, walkthrough, or lecture? Add one.
Taxonomy
TopicsUrinary Bladder and Prostate Research · Pelvic floor disorders treatments · Urinary Tract Infections Management
Background
The International Continence Society (ICS) defines overactive bladder (OAB) as a bladder storage symptom syndrome: “urgency, with or without urgency urinary incontinence, usually with increased daytime frequency and nocturia” (1). Urgency is a sudden and strong urge to urinate that is difficult to postpone, and sometimes there is involuntary urinary leakage, called urgency urinary incontinence. Urinating more than eight times in a 24 h period is recognized as frequent in clinical practice. If a person wakes up over once during the nighttime to urinate from asleep, the condition is known as nocturia (2). In 2008, the prevalence of OAB was approximately 10.7% of the global population of 4.3 billion. It was previously estimated that by 2018, 546 million people would be affected by OAB (20.1%) (3). As a highly prevalent disease, the prevalence and severity of OAB increase with age (4, 5). As the world is expected to enter an aging society, OAB results in adverse effects on patients’ health-related quality of life and a significant financial burden, on the one hand, and may put increasing pressure on healthcare resources, on the other hand (6–9). The myogenic and urothelial-neurogenic hypotheses are the two most frequently recognized explanations for OAB, which is caused by multiple underlying pathophysiologic mechanisms and should be viewed as a complex, multifactorial symptomatic syndrome (10). Current treatment options for OAB include behavioral therapy, pharmacotherapy, minimally invasive surgery, and other surgical options (11). Clinical guidelines identified behavioral therapy with or without pharmacotherapy as the first-line treatment and pharmacotherapy alone as the second-line therapy for OAB (12). This evaluation's focus is solely on pharmaceutical care.
One of the main pharmacologic treatments for OAB is to block the binding of acetylcholine to muscarinic receptors in the bladder wall with anticholinergic drugs; the intestines, salivary glands, eyes, brain, and other areas of the body do, however, have muscarinic receptors. Consequently, this category of medications can have negative effects on several physiological systems, such as constipation, dry mouth, blurred vision, and cognitive dysfunction (13–15). These side effects cause some patients to become intolerant and discontinue treatment, and they particularly hinder the durability of treatment for middle-aged and elderly OAB patients whose base medication is in this class. Mirabegron is a β_3_-adrenergic receptor agonist that selectively stimulates bladder β_3_-adrenergic receptors, mediates relaxation of the detrusor, and modulates sensory pathways, bladder afferent neural activity, and neurotransmitter release, from the urothelium, thereby increasing bladder capacity and decreasing bladder sensitivity to alleviate the storage-phase symptom syndrome—OAB (10, 16, 17). At the same time, it has been shown that mirabegron has a concentration-dependent diastolic effect on the detrusor, which results from a combination of action through agonism of β_3_-adrenergic receptors and antagonism of α_1_-adrenergic receptors (18). It was approved by the US Food and Drug Administration in 2012 for the treatment of OAB symptoms and is an alternative treatment regimen for antimuscarinic treatment of OAB (19). To support and further define the reported efficacy and safety of adult patients receiving mirabegron monotherapy, we included evidence from the most recent extant global clinical trials of 12-week placebo-controlled randomized studies in patients with OAB. We aimed to integrate these existing high-level studies and conduct a meta-analysis of these studies to explore mirabegron for OAB efficacy and safety.
Objectives
To evaluate the efficacy of mirabegron in the treatment of overactive bladder syndrome in comparison to a placebo. We will address the following assumption: mirabegron is more effective than a placebo in managing overactive bladder syndrome.
Methods
Criteria for considering studies for this review
Types of studies
All randomized controlled trials of mirabegron vs. placebo of overactive bladder syndrome.
Types of participants
All adult males and females who have been diagnosed with overactive bladder syndrome according to symptoms.
Types of interventions
In one study, mirabegron had to be used in at least one research arm, while the other arm was a placebo. The medication has to be administered to lessen the symptoms of an overactive bladder.
Types of outcome measures
The indicators of the outcome, objective as well as subjective, were incorporated in this evaluation.
Primary outcomes
Quantification of symptoms: volume voided per micturition, micturitions in 24 h, and incontinence episodes in 24 h.
Secondary outcomes
A.Patient's satisfaction scores with treatments: TS-VAS, PPBC, and OAB-q.B.Adverse events: TRAEs and TEAEs.
Search methods for identification of studies
We did not impose any language or other restrictions on any of the searches.
Electronic searches
The latest search for this evaluation was conducted on 30 October 2023. We searched PubMed and the Cochrane Library; the relevant articles were obtained from databases including MEDLINE, EMBASE, ClinicalTrials.gov, ICTRP, and CINAHL. Relevant trials were identified from the Cochrane Central Register of Controlled Trials (CENTRAL), which is regularly updated with the Cochrane Library. The evaluation has drawn on the Cochrane Collaboration's recommendation to use a highly sensitive search strategy specifically for MEDLINE randomized controlled trials using the Pubmed search route.
The search terms and strategies used are presented in Table 1.
Searching other resources
The reference list of relevant articles was searched for other potentially relevant trials.
Data collection and analysis
Selection of studies
Without first taking into account their outcomes, both researchers separately evaluated the appropriateness of the trials that were under consideration for inclusion in this study. A third party evaluated any disagreements that could not be settled through discussion. The excluded studies and their reasons for exclusion are listed.
Data extraction and management
The data were extracted and cross-checked independently by at least two researchers. Further explanation was requested from the researchers in cases where data were gathered but not reported or presented in a way that was suitable for incorporation in the formal evaluation.
Assessment of risk of bias in included studies
The researchers independently assessed the risk of bias using the Cochrane Collaboration Network's risk of bias assessment tool, which includes random sequence generation, allocation concealment, blinding of participants and personnel, blinding of outcome assessment, incomplete outcome data, selective reporting, and other biases. Disagreements were resolved by discussion with a third party.
Measures of treatment effect
In accordance with the Cochrane Handbook for Systematic Reviews of Interventions, data from included trials were handled. For dichotomous data, the Mantel–Haenszel fixed-effect approach was used to calculate the risk ratio as the effect measure; for continuous data, the inverse variance fixed-effect method was used to calculate the mean difference. In the meta-analysis, data from trials reporting changes in end-of-treatment scores compared to baseline scores were merged.
Unit of analysis issues
Data from all trials must be given as the mean and standard deviation of the difference from the baseline of two treatments for continuous data to be used in this evaluation, as the correlation between measurements on the same individual may be important.
Data synthesis
The indicators of targeted results from the included studies were combined in this formal evaluation, if appropriate, to produce an overall estimate of the treatment effect using a fixed-effect model.
Subgroup analysis and investigation of heterogeneity
The subgroup analyses were planned to investigate the effects of the dose. The clinical and methodological heterogeneity of the studies was assessed. To check for signs of statistical dissimilarity in the data plots, a statistical test for heterogeneity was applied. If heterogeneity was noticed, an explanation was looked for and described in the article (based on the I^2^ statistic and the test for heterogeneity). The data were analyzed after the trials that were the source of the discrepancy were removed from all data plots where three or more trials were involved.
Sensitivity analysis
By removing trials that resulted in considerable heterogeneity at a certain dose, the analysis of sensitivity was carried out. The article just reported the findings after the analysis of sensitivity.
Results
Description of studies
See “Characteristics of included studies” and “Characteristics of excluded studies” in the Appendix.
Results of the search
The search yielded 525 records, which were then vetted for eligibility; 55 full-text articles were acquired.
Included studies
Ten independent reports (20–29) of nine randomized controlled trials were included in the evaluation, all with a parallel design. Figure 1 shows the flow of literature through the assessment process. The evaluation examined only that part of all reports in which mirabegron was compared with placebo and made one type of comparison: comparisons of different doses (25 mg, 50 mg, and 100 mg) of mirabegron vs. placebo. All trials were given at a once-daily dose. Sample sizes ranged from 236 (20) to 1,483 (25).
Study flow diagram.
The trials included people ≥18 years old with symptoms of overactive bladder (OAB) for ≥3 months and a diagnosis of OAB met after assessment of a 3-day urinary diary. Exclusion criteria were clearly defined for all but one report (20), where the exclusion criteria were unclear. The evaluation included a total of 8,527 adults, including 6,445 women (∼76%) and 2,082 men (∼24%), of whom 5,726 were White (67%), 2,462 were Asian (29%), and 161 were Black (about 2%). The mean age of the participants ranged from 53.4 to 60.3 years, and the standard deviation ranged from 11.84 to 14.5. In many trials, patients were enrolled in a single-blind, 2-week placebo run-in period, followed by a 12-week double-blind treatment period. In one trial, treatment was preceded by a 4-week placebo run-in period (23).
Overall, there was inconsistency in the sorts of outcome measures provided by trialists as well as in the way data were recorded. The primary outcomes of the target in the evaluation were the quantification of symptoms, including volume voided per micturition, micturitions in 24 h, and incontinence episodes in 24 h. Another quantitative measure that was one of the most usually reported secondary outcomes of the target was patient observations (e.g., perception of cure or improvement), which included the TS-VAS, PPBC, and OAB-q. For continuous data, the mean and standard deviation of the difference from baseline between two treatments were statistical and calculated to incorporate these data into the evaluation. In this manner, 10 independent reports of nine parallel trials supplied data (20–29). The other most usually reported secondary outcome of the target was adverse events, such as TRAEs and TEAEs. The data must be presented in the evaluation as a two-by-two table for binary data (20, 21, 23, 26, 28, 29).
Risk of bias in included studies
The generation of random allocation, concealment of allocation, blinding of trial participants and investigators, completeness of treatment, withdrawals and dropouts, and loss to follow-up were examined to evaluate the methodological quality of the published studies.
Randomization, allocation concealment, and blinding
Rarely was the grouping procedure described. Although group allocation should be sufficiently concealed by double blinding, this is not a given. Trials that declared group allocation was “double-blind” were categorized as having adequate concealment for the evaluation. In the nine trials (20–23, 25–29), it was known that allocation was sufficiently concealed. Although the nine trials were double-blinded, only two trials specifically stated that outcome assessors were blind to group allocation (25, 29). Some studies stated that the code was broken at the completion of the study, and in some, it was specified that this was after the analysis. This would imply that the final measurement was done blind. Consequently, the evaluation has been considered to have sufficient allocation concealment. All nine parallel-group trials claimed that the groups were comparable at baseline. The risk of bias summary and graph are shown in Figure 2.
Risk of bias summary and graph: review authors’ judgments about each risk of bias item for each included study.
Withdrawals and dropouts
The reasons for discontinuation were mentioned in all trials. The dropout rate in four trials was 10% or less (21, 25, 28, 29). One trial did not state the number of dropouts in each group, so the dropout rate was not sure (20). The dropout rates in the remaining trials varied in parallel designs from 11% (23) to 21% (26). More than half of the parallel-design trials included any follow-up. Spans of time, such as 2 weeks (20, 26, 28) or 4 weeks (25, 27), were used in the trials that did follow-up individuals.
Effects of interventions
Comparison 1. Mirabegron versus placebo. The data is presented in Table 2.
Primary outcome measures: quantification of symptoms, for example, volume voided per micturition, micturitions in 24 h, and incontinence episodes in 24 h (Outcomes 1.1–1.3)
Nine trials (20–23, 25–29) reported available data on volume voided per micturition after treatment (Figure 3). Those in the mirabegron groups had approximately 12.50 volume voided more per micturition than those taking placebo (MD for volume voided per micturition 12.50, 95% CI 10.72–14.28, P < 0.00001, Outcome 1.1).
Comparison 1. Mirabegron versus placebo, Outcome 1.1, volume voided per micturition.
Mirabegron 25 mg vs. placebo
Five trials (20–23, 29) reported available data on volume voided per micturition after treatment. Those in the mirabegron 25 mg groups had approximately 7.51 volume voided more per micturition than those taking placebo (MD for volume voided per micturition 7.51, 95% CI 3.58–11.44, P = 0.0002, Outcome 1.1.1).
Mirabegron 50 mg vs. placebo
Nine trials (20–23, 25–29) reported available data on volume voided per micturition after treatment. Those in the mirabegron 50 mg groups had approximately 13.41 volume voided more per micturition than those taking placebo (MD for volume voided per micturition 13.41, 95% CI 11.08–15.75, P < 0.00001, Outcome 1.1.2).
Mirabegron 100 mg vs. placebo
Four trials (21, 25, 27, 29) reported available data on volume voided per micturition after treatment. Those in the mirabegron 100 mg groups had approximately 14.78 volume voided more per micturition than those taking placebo (MD for volume voided per micturition 14.78, 95% CI 10.94–18.62, P < 0.00001, outcome 1.1.3).
Eight trials (21–23, 25–29) reported available data on micturitions in 24 h after treatment (Figure 4). The number of micturitions per 24 h was roughly 0.60 less in the mirabegron groups than that in the placebo groups (MD for micturitions within a day −0.60, 95% CI −0.70 to −0.50, P < 0.00001, Outcome 1.2). The outcome reveals a weekly reduction in micturitions of about five on average.
Comparison 1. Mirabegron versus placebo, Outcome 1.2, micturitions in 24 h.
Mirabegron 25 mg vs. placebo
Four trials (21–23, 29) reported available data on micturitions in 24 h after treatment. Approximately 0.51 fewer micturitions per 24 h were made by those using 25 mg mirabegron compared to those receiving a placebo (MD for micturitions within a day −0.51, 95% CI −0.72 to −0.29, P < 0.0001, Outcome 1.2.1).
Mirabegron 50 mg vs. placebo
Eight trials (21–23, 25–29) reported available data on micturitions in 24 h after treatment. Approximately 0.61 fewer micturitions per 24 h were made by those using mirabegron 50 mg compared to those receiving a placebo (MD for micturitions within a day −0.61, 95% CI −0.75 to −0.48, P < 0.00001, Outcome 1.2.2).
Mirabegron 100 mg vs. placebo
Four trials (21, 25, 27, 29) reported available data on micturitions in 24 h after treatment. Approximately 0.67 fewer micturitions per 24 h were made by those using mirabegron 100 mg compared to those receiving a placebo (MD for micturitions within a day −0.67, 95% CI −0.88 to −0.45, P < 0.00001, Outcome 1.2.3).
Eight trials (21, 22, 25–29) reported available data on incontinence episodes within 24 h after treatment (Figure 5). The number of incontinence episodes per 24 h was roughly 0.47 less in the mirabegron groups than in the placebo groups (MD for incontinence episodes within a day −0.47, 95% CI −0.56 to −0.38, P < 0.00001, Outcome 1.3). The outcome reveals a weekly reduction in incontinence episodes of about four on average.
Comparison 1. Mirabegron versus placebo, Outcome 1.3, incontinence episodes in 24 h.
Mirabegron 25 mg vs. placebo
Four trials (21–23, 29) reported available data on incontinence episodes in 24 h after treatment. There were almost 0.48 fewer incontinence events per 24 h in the mirabegron 25 mg groups than in the placebo groups (MD for incontinence episodes within a day −0.48, 95% CI −0.67 to −0.30, P < 0.00001, Outcome 1.3.1).
Mirabegron 50 mg vs. placebo
Eight trials (21, 22, 25–29) reported available data on incontinence episodes in 24 h after treatment. There were roughly 0.45 fewer incontinence incidents per 24 h in the mirabegron 50 mg groups than in the placebo groups (MD for incontinence episodes within a day −0.45, 95% CI −0.57 to −0.33, P < 0.00001, Outcome 1.3.2).
Mirabegron 100 mg vs. placebo
Four trials (21, 25, 27, 29) reported available data on incontinence episodes in 24 h after treatment. There were roughly 0.50 fewer incontinence events per 24 h in the mirabegron 100 mg groups than in the placebo groups (MD for incontinence episodes within a day −0.50, 95% CI −0.69 to −0.31, P < 0.00001, Outcome 1.3.3).
Secondary outcome measures: patient observations, for example, TS-VAS, PPBC, and OAB-q (Outcomes 1.4–1.6)
Patients’ perceptions of change including TS-VAS, PPBC, and OAB-q were reported in five articles (21, 22, 24, 25, 27). Those taking medication had a higher likelihood of attesting to a cure or an improvement in their symptoms than those receiving a placebo, mean difference (MD) for TS-VAS (Figure 6), 0.78 (95% CI 0.59–0.97, P < 0.00001, Outcome 1.4); MD for PPBC (Figure 7), −0.14 (95% CI −0.25 to −0.03, P = 0.02, Outcome 1.5); MD for OAB-q (Figure 8), −4.31 (95% CI −5.49 to −3.13, P < 0.00001, Outcome 1.6).
Comparison 1. Mirabegron versus placebo, Outcome 1.4, TS-VAS.
Comparison 1. Mirabegron versus placebo, Outcome 1.5, PPBC.
Comparison 1. Mirabegron versus placebo, Outcome 1.6, OAB-q.
Three articles (21, 22, 24) reported available data for mirabegron 25 mg in OAB-q (MD −2.64, 95% CI −4.88 to −0.40, P = 0.02, Outcome 1.6.1). Five articles (21, 22, 24, 25, 27) reported available data for mirabegron 50 mg in OAB-q, with a statistically significant difference (MD −4.95, 95% CI −6.33 to −3.56, P < 0.00001, Outcome 1.6.2).
Adverse events (Outcomes 1.7–1.8)
The number of people for TRAEs (Figure 9) in six parallel-group trials was reported (20, 21, 23, 26, 28, 29). There was no statistically significant difference for TRAEs between the mirabegron and placebo groups (RR 1.12, 95% CI 0.99–1.26, P = 0.07, Outcome 1.7).
Comparison 1. Mirabegron versus placebo, Outcome 1.7, TRAEs.
Four trials (20, 21, 23, 29) reported available data for mirabegron 25 mg in TRAEs (RR 1.14, 95% CI 0.91–1.42, P = 0.26, Outcome 1.7.1). Six trials (20, 21, 23, 26, 28, 29) reported available data for mirabegron 50 mg in TRAEs, with no statistically significant difference (RR 1.11, 95% CI 0.96–1.28, P = 0.17, Outcome 1.7.2).
The number of people for TEAEs (Figure 10) in five parallel-group trials was reported (22, 23, 25–27). There was no statistically significant difference for TEAEs between the mirabegron and placebo groups (RR 0.98, 95% CI 0.91–1.05, P = 0.56, Outcome 1.8).
Comparison 1. Mirabegron versus placebo, Outcome 1.8, TEAEs.
Despite the clinical heterogeneity of the included studies (such as demographics), from the statistical tests, we considered heterogeneity to be acceptable for I^2^ <50% (referenced in the Cochrane Handbook of Systematic Evaluation of Interventions). GRADEprofiler Version 3.6 was used to evaluate the quality of the evidence for the summarized findings. The results of the quality of evidence grading are shown in the “Summary of findings” presented in the Appendix.
Discussion
This article is one of a series of articles on β_3_-adrenergic receptor agonist mirabegron therapy for overactive bladder symptoms, and it should be viewed in that context. The use of mirabegron for the relief of overactive bladder symptoms is widespread, so the question of which dose of mirabegron is better is of clinical interest. The two questions addressed by the article are as follows: whether mirabegron is better than placebo, and what dose is most effective and secure?
Summary of main results
Considering this evaluation as a whole, mirabegron was found to be more effective than placebo for adults with overactive bladder syndrome. The difference in quantification of symptoms between the mirabegron and placebo groups was approximately 13 ml more volume voided per micturition (MD 12.50, 95% CI 10.72–14.28, P < 0.00001), five fewer micturitions per week (MD for micturitions within a day −0.60, 95% CI −0.70 to −0.50, P < 0.00001), and four fewer incontinence episodes per week (MD for incontinence episodes within a day −0.47, 95% CI −0.56 to −0.38, P < 0.00001) in favor of mirabegron. The difference in patients’ satisfaction scores with treatments between the mirabegron and placebo groups was approximately 1 score higher for TS-VAS (MD 0.78, 95% CI 0.59–0.97, P < 0.00001), 0.2 scores lower for PPBC (MD −0.14, 95% CI −0.25 to −0.03, P = 0.02), and 5 scores lower for OAB-q (MD −4.31, 95% CI −5.49 to −3.13, P < 0.00001) in favor of mirabegron. One in five people (Events/Total = 447/2,501) taking mirabegron reported TRAEs; the risk of discontinuation due to TRAEs was similar in the mirabegron and placebo groups (RR 1.12, 95% CI 0.99–1.26, P = 0.07), and the risk of TEAEs was also similar to that in the placebo group (RR 0.98, 95% CI 0.91–1.05, P = 0.56). As noted earlier, there was no significant tendency for mirabegron to be associated with overall adverse events compared with placebo, so its safety profile was relatively favorable.
Doses higher and lower than the normal therapeutic dose of 50 mg once daily, which is 25 mg vs. 100 mg of mirabegron, were indirectly compared by examining the combined statistics and the test for subgroup differences for each dose of mirabegron vs. placebo. Test for subgroup differences in volume voided per micturition was the statistically significant difference [χ^2 ^= 8.13, df = 2 (p = 0.02), I^2^ 75.4%]. Mirabegron 50 mg (MD 13.41, 95% CI 11.08–15.75, P < 0.00001) demonstrated superior efficacy in volume voided per micturition when compared to mirabegron 25 mg (MD 7.51, 95% CI 3.58–11.44, P = 0.0002); however, there was similar efficacy when 100 mg (MD 14.78, 95% CI 10.94–18.62, P < 0.00001) of mirabegron was compared to mirabegron 50 mg. A 50 mg dose made no difference between 25 mg and 100 mg for decreasing micturitions [χ^2 ^= 1.14, df = 2 (p = 0.57), I^2^ 0%] and incontinence episodes [χ^2 ^= 0.23, df = 2 (p = 0.89), I^2^ 0%] per 24 h. Test for subgroup differences in OAB-q was the statistically significant difference [χ^2 ^= 2.95, df = 1 (p = 0.09), I^2^ 66.1%]. Patient-reported reductions in OAB-q were significantly better with larger doses, which were 50 mg (MD −4.95, 95% CI −6.33 to −3.56, P < 0.00001) superior to 25 mg (MD −2.64, 95% CI −4.88 to −0.40, P = 0.02). Because the risk of TRAEs was similar [χ^2^ = 0.03, df = 1 (p = 0.86), I^2^ 0%] for mirabegron 25 mg (Events/Total = 140/879) and mirabegron 50 mg (Events/Total = 307/1,622), patients tolerated mirabegron better. Only 25 mg and 50 mg are available commercially. Based on a comprehensive analysis of the data, including combined statistics, 95% CI, and weights, the recommended dose of 50 mg is preferable as it balances the significance, stability, and safety of efficacy and therefore has greater generalizability to support policymakers in promoting it.
During normal filling, an increase in the volume of the bladder does not cause a significant increase in its internal pressure. It is when the volume of the bladder is >300–400 ml that its internal pressure rises significantly, at which point the receptors on the bladder wall and in the posterior urethra are stimulated by stretching and become excited. This excitation travels along the afferent fibers of the pelvic nerve to the sacral segment of the spinal cord and then up the brainstem and cerebral cortex to produce the urge to urinate. Overactive bladder syndrome is a condition in which the bladder suddenly contracts without any control, resulting in urination and/or leakage of urine. It is also known as “irritable” bladder or detrusor instability, urgency to urinate, and/or urgency incontinence syndrome. Overactive bladder syndrome becomes more common with age. The functional regulation of the detrusor muscle of the bladder is accomplished by a variety of factors such as cholinergic nerves, adrenergic nerves, non-cholinergic and non-adrenergic nerves, and the detrusor muscle itself. The myogenic and neurogenic hypotheses are the two most frequently recognized explanations for OAB, while its pathophysiology is still not completely understood. The detrusor muscle grows overactive in both hypotheses (10). Mirabegron is a β_3_-adrenergic receptor agonist that selectively stimulates bladder β_3_-adrenergic receptors, mediates relaxation of the detrusor, and modulates sensory pathways, bladder afferent neural activity, and neurotransmitter release, from the urothelium, thereby increasing bladder capacity and decreasing bladder sensitivity to alleviate the storage-phase symptom syndrome (16, 17). At the same time, mirabegron has a concentration-dependent diastolic effect on the detrusor, with high concentrations of mirabegron acting synergistically to diastole the detrusor by agonizing the β_3_-adrenergic receptor and antagonizing the α_1_-adrenergic receptor (18). Herein lies the potential reason for the superiority of mirabegron 50 mg over mirabegron 25 mg. The primary endpoint was assessed after 12 weeks of therapy in the majority of the included trials. Given that mirabegron is not curative for overactive bladder syndrome, which is a chronic illness, and it is not clear whether any benefits are sustained after treatment stops, regular usage and long-term adherence to the medication are probably necessary to sustain the benefits.
Quality of the evidence
Since 2012, when mirabegron was approved by the US Food and Drug Administration for the treatment of OAB symptoms, there have been a significant number of trials examining the efficacy and security of mirabegron in the treatment of OAB symptoms. Generally speaking, the reported methods of the parallel arm trials were of moderate to high quality. Nevertheless, the methods of group allocation were rarely described in enough detail to guarantee that the allocation was sufficiently concealed. Only two of the nine double-blinded trials explicitly indicated that outcome assessors were unaware of group allocation. Subgroup allocation and reasons for withdrawal from the trials were fully reported in all but one of the nine trials.
Potential biases in the evaluation process
It is sad that we focused only on these outcome metrics of interest and could not combine data on the additional outcomes reported in the nine trials. There are two reasons for this, one being the limited energy of those involved in this evaluation and the other key factor being that both the outcomes that were chosen and the way that the same outcome was measured and reported varied.
All trials involved both men and women; however, there was no sex-specific reporting of results. Investigating gender-based disparities in effect was therefore not practicable. There was statistically significant heterogeneity in certain comparisons. A reasonable explanation based on clinical heterogeneity is typically available for this. The sample populations varied, but there were also variations in the ways that drugs were administered.
It is important to note that every trial explicitly stated pharmaceutical company support. This aid included everything from full funding, data analysis, and help with medical writing to the design and execution of the trial, the provision of active and placebo tablets (in blinded packaging), and more.
Authors’ conclusions
Implications for practice
Statistically significant differences are observed when mirabegron is administered for the treatment of overactive bladder syndrome in comparison to a placebo. Patients who received mirabegron therapy were more likely to report a cure or improvement in their symptoms, as well as an increase in the volume passed (approximately thirteen ml per micturition), a decrease in the frequency of micturitions (about five per week), and a decrease in the frequency of incontinence episodes (about four per week). In terms of satisfaction with treatments including TS-VAS, PPBC, and OAB-q, it has also improved appreciably. About one in five people taking mirabegron reported TRAEs. There was no significant drug predisposition for the risk of TRAEs and TEAEs compared to the placebo group, resulting in a favorable safety profile for mirabegron therapy. Mirabegron 50 mg was more advantageous in increasing volume voided per micturition, reducing OAB-q; however, the risk of TRAEs occurring was similar to the lower dose and was therefore well tolerated. The effect is maximized by taking 50 mg once daily for a long period of time.
Implications for research
The majority of the trials that were included used oral pill delivery. Further study would be beneficial to see whether variations in the size of the effect with various delivery methods (such as skin patches, OCAS formulation, or intravesical administration) would also be beneficial (30). Because it delivers the medication directly to the site of action, intravesical administration has the potential to eliminate some of the difficult side effects of 3 adrenergic agonists. However, this method would only be therapeutically helpful if intravesical administration could be made less difficult. In addition, very few trials have involved high doses of mirabegron (100 mg, 150 mg, 200 mg) in their studies, and future trials are needed to assess the efficacy and safety of these doses.
Mirabegron is unlikely to be curative; continued use of it will probably be necessary for success. Little is known about the forward effect and acceptance of mirabegron therapy because of the lack of longer follow-up (5 years, 10 years, or more) in the majority of trials. Although it wasn't a requirement in every experiment, patient satisfaction and therapy acceptance are crucial considerations in management decisions. This information will need to be known through follow-up in the future.
The reference list from the paper itself. Each links out to its DOI / PubMed record.
- 1Abrams P Cardozo L Fall M Griffiths D Rosier P Ulmsten U The standardisation of terminology of lower urinary tract function: report from the standardisation sub-committee of the International Continence Society. Neurourol Urodyn. (2002) 21(2):167–78. 10.1002/nau.1005211857671 · doi ↗ · pubmed ↗
- 2Madhuvrata P Cody JD Ellis G Herbison GP Hay-Smith EJ. Which anticholinergic drug for overactive bladder symptoms in adults. Cochrane Database Syst Rev. (2012) 1:CD 005429. 10.1002/14651858.CD 005429.pub 222258963 PMC 12989262 · doi ↗ · pubmed ↗
- 3Irwin DE Kopp ZS Agatep B Milsom I Abrams P. Worldwide prevalence estimates of lower urinary tract symptoms, overactive bladder, urinary incontinence and bladder outlet obstruction. BJU Int. (2011) 108(7):1132–8. 10.1111/j.1464-410X.2010.09993.x 21231991 · doi ↗ · pubmed ↗
- 4Milsom I Abrams P Cardozo L Roberts RG Thüroff J Wein AJ. How widespread are the symptoms of an overactive bladder and how are they managed? A population-based prevalence study. BJU Int. (2001) 87(9):760–6. 10.1046/j.1464-410x.2001.02228.x 11412210 · doi ↗ · pubmed ↗
- 5Stewart WF Van Rooyen JB Cundiff GW Abrams P Herzog AR Corey R Prevalence and burden of overactive bladder in the United States. World J Urol. (2003) 20(6):327–36. 10.1007/s 00345-002-0301-412811491 · doi ↗ · pubmed ↗
- 6Raju R Linder BJ. Evaluation and treatment of overactive bladder in women. Mayo Clin Proc. (2020) 95(2):370–7. 10.1016/j.mayocp.2019.11.02432029089 · doi ↗ · pubmed ↗
- 7Eshkoli T Yohai D Laron E Weintraub AY. Epidemiology of over-active bladder (OAB) syndrome. Harefuah. (2016) 155(11):682–5. PMID: .28530071 · pubmed ↗
- 8Wen JG Li JS Wang ZM Huang CX Shang XP Su ZQ The prevalence and risk factors of OAB in middle-aged and old people in China. Neurourol Urodyn. (2014) 33(4):387–91. 10.1002/nau.2242923765684 · doi ↗ · pubmed ↗