Correction to: Modelling [18F]LW223 PET data using simplified imaging protocols for quantification of TSPO expression in the rat heart and brain
Mark G. MacAskill, Catriona Wimberley, Timaeus E. F. Morgan, Carlos J. Alcaide‑Corral, David E. Newby, Christophe Lucatelli, Andrew Sutherland, Sally L. Pimlott, Adriana A. S. Tavares

Abstract
Genes, proteins, chemicals, diseases, species, mutations and cell lines named across the full text — each resolved to its canonical identifier and authoritative record.
Click any figure to enlarge with its caption.
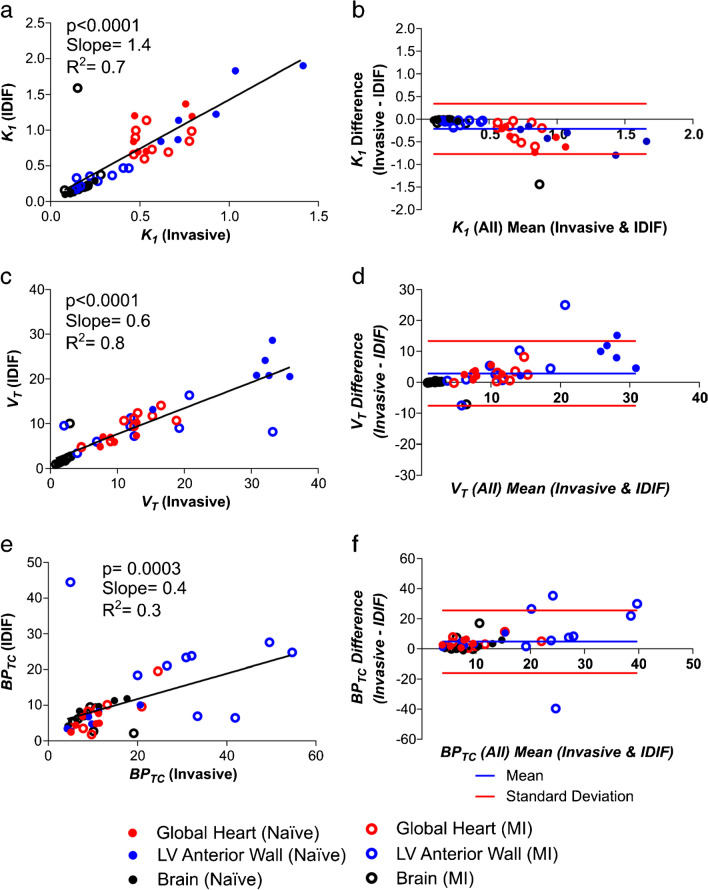 Figure 1
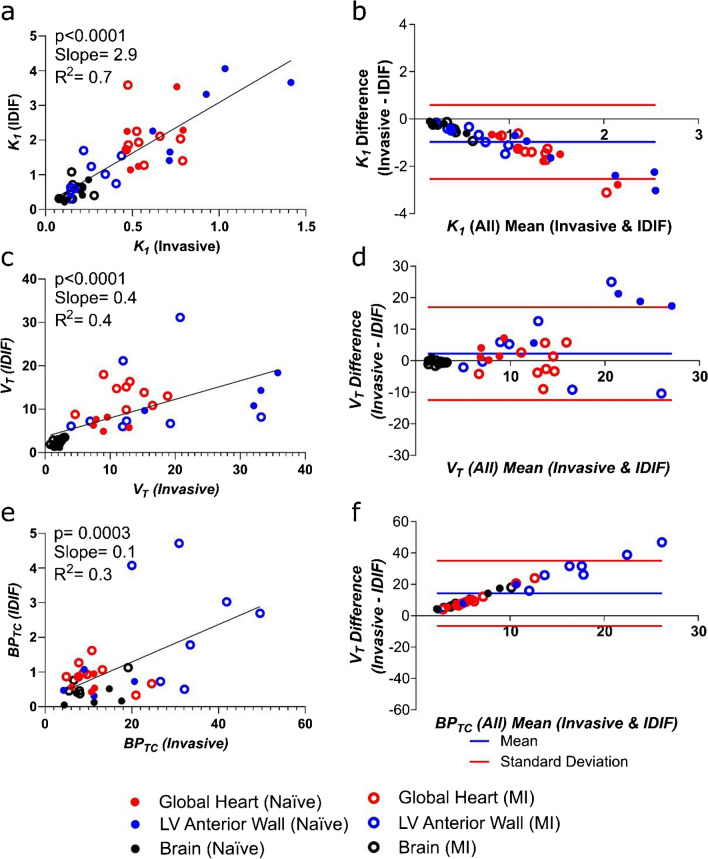 Figure 2
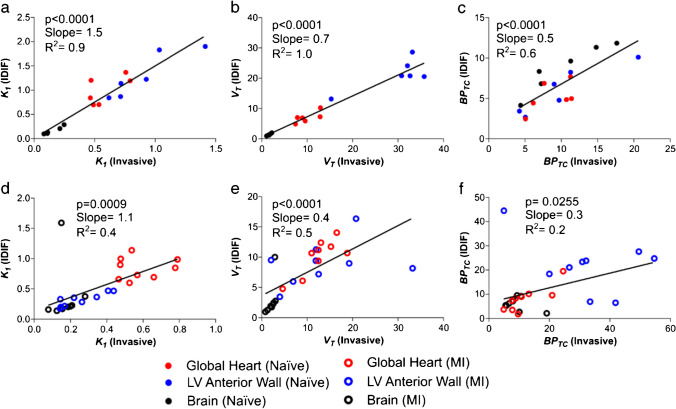 Figure 3
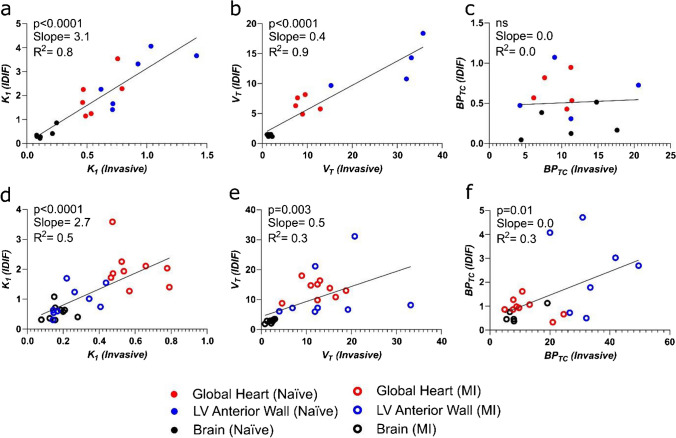 Figure 4
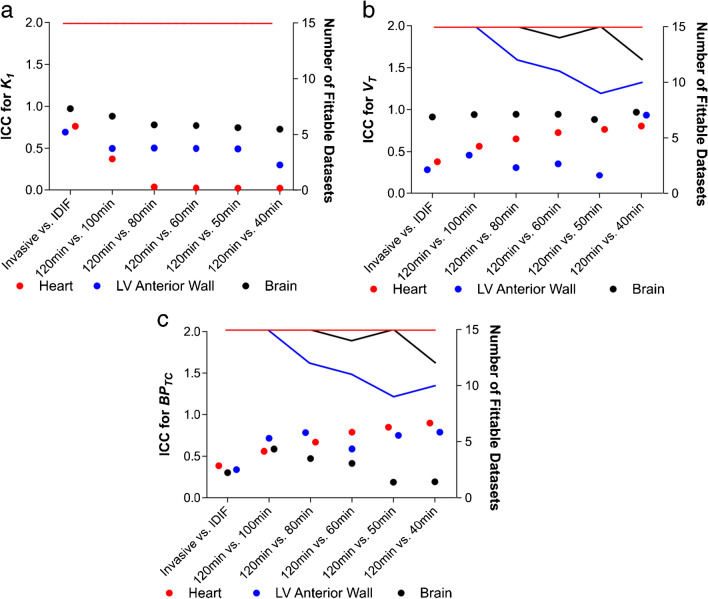 Figure 5
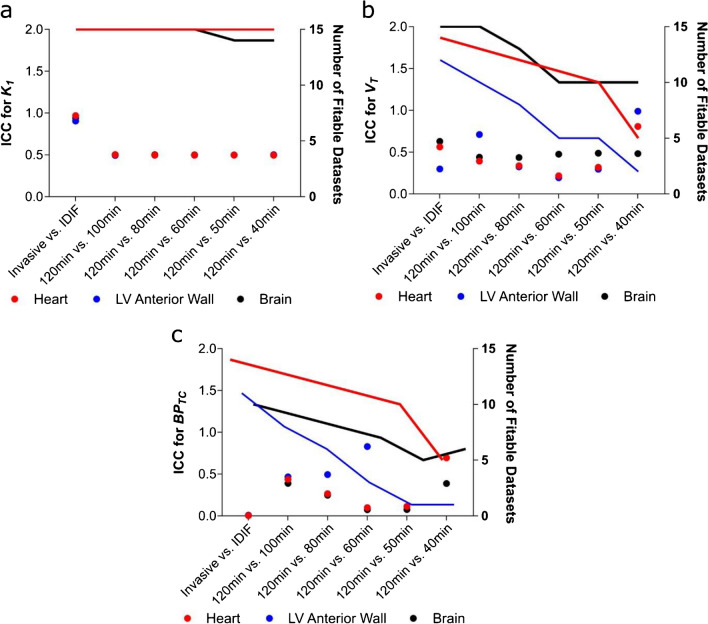 Figure 6
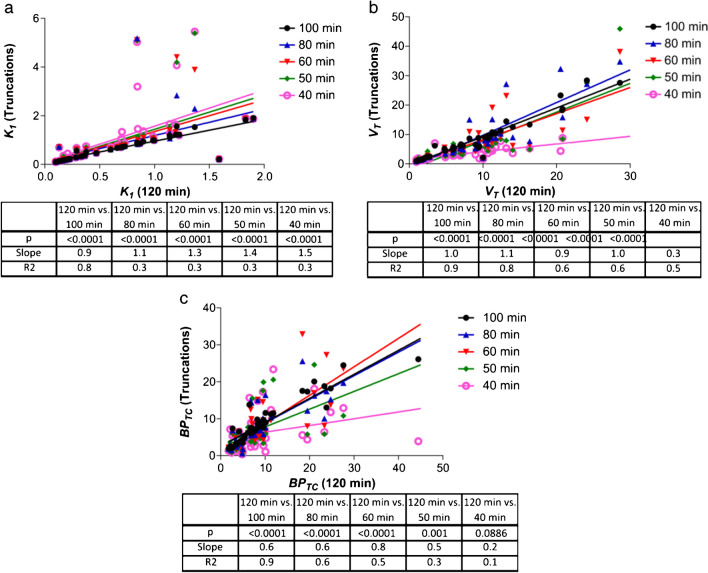 Figure 7
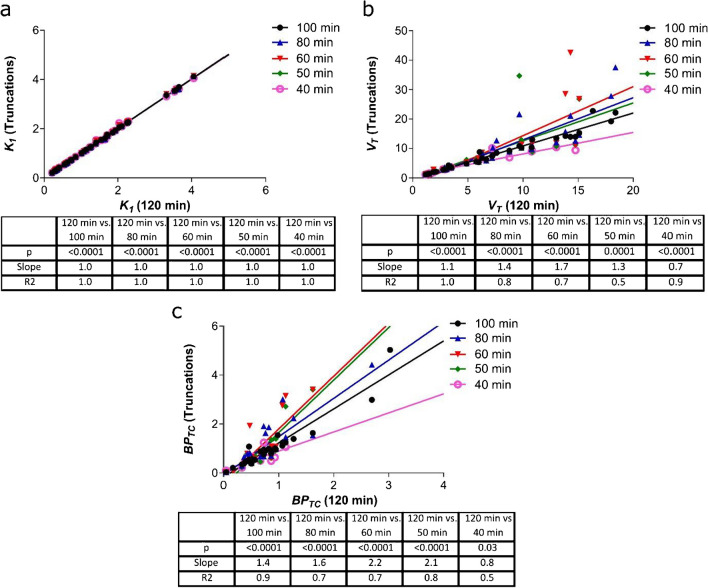 Figure 8
Peer Reviews
No public reviews on file for this paper yet. If you reviewed it on a platform where reviews are public (OpenReview, ICLR, NeurIPS, ICML), you can paste yours below so the community can read it here.
Videos
No videos yet. Explain this paper in a talk, walkthrough, or lecture? Add one.
Taxonomy
TopicsCancer, Hypoxia, and Metabolism · S100 Proteins and Annexins · Medical Imaging Techniques and Applications
Correction to: European Journal of Nuclear Medicine and Molecular Imaging (2021) 49:137–145
10.1007/s00259-021-05482-1
The authors regret that there are some errors in the published original article.
Listed below are the corrections.
The sentence:
Overall, compared to using the invasive AIF, K1 values were 40% higher when using IDIF (based on slope, Figure 2.a-b).
Should have read as:
Overall, compared to using the invasive AIF, K1 values were 190% higher when using IDIF (based on slope, Figure 2.a-b).
The sentence:
The other 2TCM microparameters were also higher when using IDIF (10%-200% range, Supplementary Figure 3).
Should have read as:
The other 2TCM microparameters were higher (k4), lower (k3) and same (k2) when using IDIF (Supplementary Figure 3).
The sentence:
VT and BPTC were 40% (based on slope, Figure 2. c & d) and 60% lower respectively (based on slope, Figure 2.e & f) when using IDIF compared to AIF.
Should have read as:
VT and BPTC were 60% (based on slope, Figure 2. c & d) and 90% lower respectively (based on slope, Figure 2.e & f) when using IDIF compared to AIF.
The sentence:
When analysing the comparison between AIF and IDIF in naive and MI cohorts on their own, a similar pattern is evident although the fitting is poorer within those with MI (Figure 3).
Should have read as:
When analysing the comparison between AIF and IDIF in naive and MI cohorts on their own, a similar pattern is evident although the fitting is generally poorer within those with MI (Figure 3).
The sentence:
A truncation greater than 20 min results in lower K1 ICC values, and therefore stability, with the global heart VOI particularly impacted (Figure 4.a).
Should have read as:
K1 ICC values were unaffected by truncations in scan duration (Figure 4.a).
The sentence:
The VT ICC demonstrates stability in brain outcomes for different truncations and an improvement of heart outcomes (Figure 4.b.).
Should read as:
The VT ICC demonstrates greater stability in brain outcomes for different truncations compared with heart outcomes (Figure 4.b.).
The sentence:
The improved brain performance improvement versus the heart maybe due to the decreasing effect of the apparent quasi-irreversible kinetics on 2TCM (Figure 1).
Should read as:
The improved brain performance versus the heart maybe due to the decreasing effect of the apparent quasi-irreversible kinetics on 2TCM (Figure 1).
The sentence:
When assessing the ICC of truncated data within the naive and MI cohorts separately, K1, VT and BPTC ICC results are overall higher in the diseased cohort (Supplementary Figure 4).
Should read as:
When assessing the ICC of truncated data within the naive and MI cohorts separately, K1, VT and BPTC ICC results are overall comparable (Supplementary Figure 4).
The sentence:
Furthermore, a truncation of greater than 20 min impacts the quantitative accuracy of the outcomes as is evidenced by the deteriorating R^2^ values and increasing measurement bias (regression line slope, Fig. 5).
Should read as:
Furthermore, a truncation of greater than 20 min impacts the quantitative accuracy of VT and BPTC, but not K1, as is evidenced by the deteriorating R^2^ values and increasing measurement bias (regression line slope, Figure 5).
Some of the figures are also incorrect.
Incorrect Figure 2:
Figure 2. Comparison of PET outcome measures calculated using the “gold standard” invasive AIF and IDIF in all rats. a Correlation of K1 calculated using AIF vs. IDIF and b Bland–Altman plot for the same comparison. c Correlation of VT calculated using AIF vs. IDIF and d Bland–Altman plot for the same comparison. e Correlation of BPTC calculated using AIF vs. IDIF and f Bland–Altman plot for the same comparison. n = 15 for all graphs (6 naive animals and 9 MI animals) with 3 regions per animal (heart, brain and left ventricular anterior wall)
Correct Figure 2:
Figure 2. Comparison of PET outcome measures calculated using the “gold standard” invasive AIF and IDIF in all rats. a) Correlation of K1 calculated using AIF vs. IDIF and b) Bland–Altman plot for the same comparison. c) Correlation of VT calculated using AIF vs. IDIF and d) Bland–Altman plot for the same comparison. e) Correlation of BPTC calculated using AIF vs. IDIF and f) Bland–Altman plot for the same comparison. n=15 for all graphs (6 naive animals and 9 MI animals) with 3 regions per animal (heart, brain and left ventricular anterior wall).
Incorrect Figure 3:
Figure 3. Comparison of PET outcome measures calculated using invasive AIF and IDIF in separate naive and MI cohorts. a Correlation of K1, b VT and c BPTC calculated using AIF vs. IDIF in naive cohort heart and brain. n = 6 animals with 3 regions (heart, brain and left ventricular anterior wall). d Correlation of K1, e VT and f BPTC calculated using AIF vs. IDIF in the MI cohort heart and brain. n = 9 animals with 3 regions (heart, brain and left ventricular anterior wall)
Correct Figure 3:
Figure 3. Comparison of PET outcome measures calculated using invasive AIF and IDIF in separate naive and MI cohorts. a) Correlation of K1, b) VT and c) BPTC calculated using AIF vs. IDIF in naive cohort heart and brain. n=6 animals with 3 regions (heart, brain and left ventricular anterior wall). d) Correlation of K1, e) VT and f) BPTC calculated using AIF vs. IDIF in the MI cohort heart and brain. n=9 animals with 3 regions (heart, brain and left ventricular anterior wall).
Incorrect Figure 4:
Figure 4. The ICC of 2TCM parameters for invasive AIF function, IDIF and PET frame truncation in all datasets. a The ICC for K1 calculated using the different conditions in naive and MI rats is shown as dots (left Y axis), with the lines detailing the number of datasets (rats) where calculation of K1 was possible (right Y axis). b The same analysis is shown for VT and c) BPTC. n = 15 (6 naive animals and 9 MI animals)
Correct Figure 4:
Figure 4. The ICC of 2TCM parameters for invasive AIF function, IDIF and PET frame truncation in all datasets. a) The ICC for K1 calculated using the different conditions in naive and MI rats is shown as dots (left Y axis), with the lines detailing the number of datasets (rats) where calculation of K1 was possible (right Y axis). b) The same analysis is shown for VT and c) BPTC. n=15 (6 naive animals and 9 MI animals).
Incorrect Figure 5:
Figure 5. The impact of PET scan duration truncation on 2TCM parameter accuracy in all datasets. a Correlation between K1 calculated using a 120-min PET scan duration and 5 other truncated durations. b The same is shown for BPTC and c VT. n = 15 (6 naive animals and 9 MI animals) with 3 regions per animal (heart, brain and left ventricular anterior wall)
Correct Figure 5:
Figure 5. The impact of PET scan duration truncation on 2TCM parameter accuracy in all datasets. a) Correlation between K1 calculated using a 120 min PET scan duration and 5 other truncated durations. b) The same is shown for BPTC and c) VT. n=15 (6 naive animals and 9 MI animals) with 3 regions per animal (heart, brain and left ventricular anterior wall).
The original article has been corrected.