Fluctuating arch symmetry: a comparison of two methods of assessment - applicability and efficiency
Maria Giulia Rezende PUCCIARELLI, Eloá Cristina Passucci AMBROSIO, Thaís Marchini OLIVEIRA, Chiarella SFORZA, Márcio de MENEZES, Simone SOARES

TL;DR
This study compares two methods for assessing dental arch symmetry in children and adults to determine their usefulness and efficiency in orthodontic treatment.
Contribution
The study introduces and evaluates two distinct methods for assessing arch symmetry, highlighting their applicability in different treatment stages.
Findings
Method 1 showed varying correlation levels in maxillary and mandibular arches across age groups.
Method 2 found both arches symmetrical in all participants.
Method 1 uniquely identified the side of asymmetry, making it more suitable for treatment monitoring.
Abstract
Symmetry is balance, some correspondence in the size, form, and arrangements of parts on opposite sides of a plane, line, or point. The opposite of this concept is asymmetry, or imbalance. This retrospective study compared two methods for assessing arch symmetry with linear measurements based on triangles, to determine their applicability and efficiency. Two groups were enrolled: children (n=20) and adults (n=20), and the arch symmetry was assessed from linear measurements. Method 1: the incisor-canine (INC), canine-molar (CM), and incisor-molar (INM) distances (paired t-test and Pearson correlation). Method 2: a mathematical equation between the cusps measurements of the canines and the distobuccal of the first molars leading to result 1 (t-test for one sample and bootstrapping analysis). Dental casts were digitized and analyzed using a software program. The Bland-Altman test…
Genes, proteins, chemicals, diseases, species, mutations and cell lines named across the full text — each resolved to its canonical identifier and authoritative record.
Click any figure to enlarge with its caption.
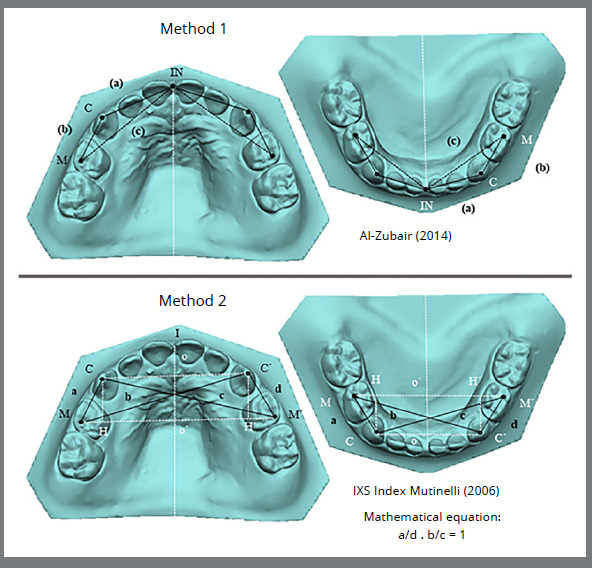 Figure 1
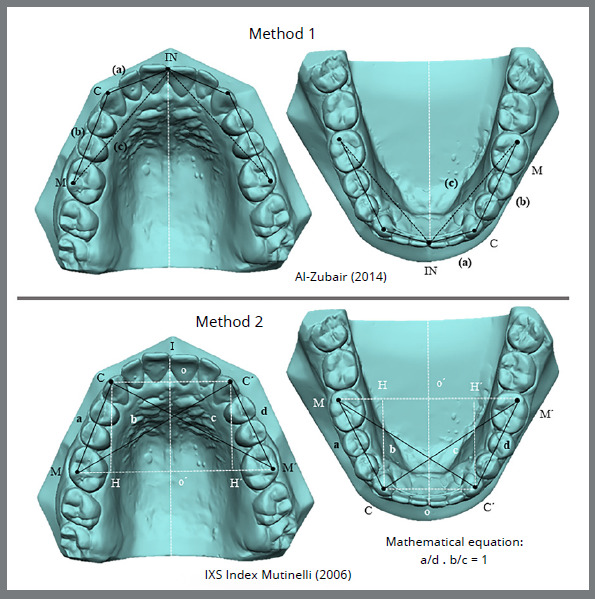 Figure 2
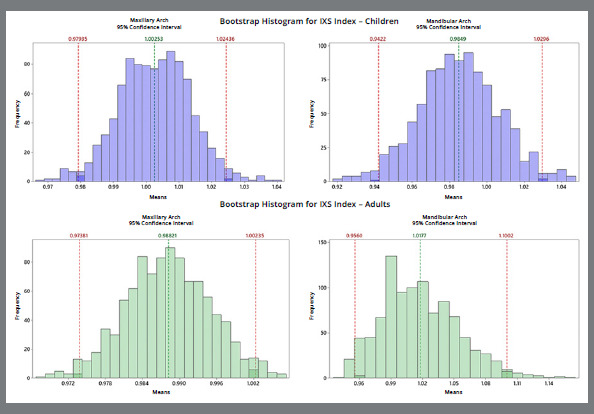 Figure 3
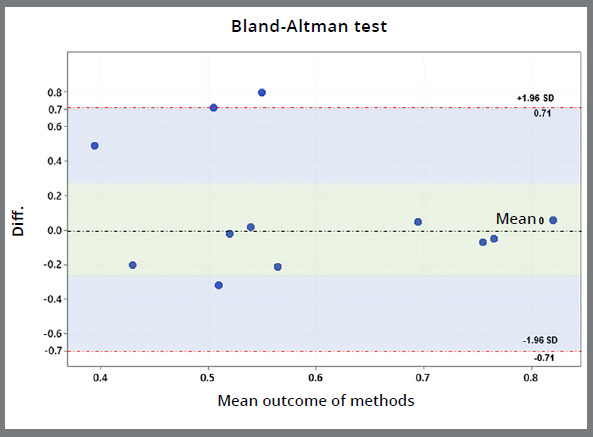 Figure 4
Peer Reviews
No public reviews on file for this paper yet. If you reviewed it on a platform where reviews are public (OpenReview, ICLR, NeurIPS, ICML), you can paste yours below so the community can read it here.
Videos
No videos yet. Explain this paper in a talk, walkthrough, or lecture? Add one.
Taxonomy
Topicsdental development and anomalies · Orthodontics and Dentofacial Orthopedics · Dental Radiography and Imaging
INTRODUCTION
Symmetry represents a visual or conceptual equilibrium achieved through the proportional arrangement of parts of a whole, in contrast to the concept of asymmetry, or imbalance.1 ^-^ 3 Previous research underscored the pivotal significance of arch asymmetry, and orthodontists face challenges in diagnosing and planning the correction of this arch discrepancy.4 ^,^ 5 The etiology of asymmetry encompasses a spectrum of genetic and environmental factors, with potential skeletal, dental, or functional effects.2 ^,^ 6 External environmental factors contributing to asymmetry may include tooth extraction or trauma, further complicating diagnostic and treatment considerations.2
Currently, there is no consensus on the optimal methods for assessing arch symmetry, and the effectiveness of various approaches remains uncertain. Traditionally, arch symmetry has been evaluated by measuring the distance from the teeth on one side to the midline, aligned with the median palatal raphe, and comparing it with the distance from the corresponding teeth on the opposite side to the same midline.7 ^-^ 11 However, the reliability of the palatal raphe as a symmetry axis at the palate’s center has not been conclusively established.2 ^,^ 4 Some researchers have instead employed strategic dental landmarks and linear measurements based on analogous triangles to assess symmetry.3 ^,^ 12
Two methods have been described in the literature,3 ^,^ 12 that utilize dental points and linear measurements. One method, utilized in previous studies,13 ^,^ 14 segments the dental arch and evaluates the distances between specific teeth and cusps tips.12 This approach is well-suited for diagnosing asymmetries of skeletal, dental, or combined origin, and is essential for guiding effective treatment interventions. The other one is a geometric analysis to devise a method for assessing the symmetrical alignment of teeth within the dental arch and the overall curvature symmetry.3 A significant challenge lies in identifying the symmetry axis of both the upper and lower dental arches, which is compounded by the absence of specific anatomical landmarks in the central regions of the palate and mandibular body. Consequently, the principles of symmetrical figures were employed to investigate the interrelationships among the dental arch points and to derive an evaluative metric termed the IXS Index. This index yields a value of one when two pairs of dental features, such as the cusps of the canines and the mesiobuccal cusps of the first molars, are in perfectly symmetrical alignment. A deviation from 1 indicates asymmetrical positioning of the teeth.
Ensuring symmetry within individual dental arches (arch form) and establishing harmonious occlusal relationships between the maxillary and mandibular arches15 is crucial for managing the development of occlusion and correcting malocclusion. Evaluating arch symmetry and dimension is essential both before and after treatment in pediatric and adult populations, serving as a cornerstone for understanding malocclusion, treatment planning, and assessing treatment outcomes in orthodontics. The efficacy of the method for evaluating symmetry depends on its versatility, allowing its application across diverse demographic groups irrespective of age or inherent arch characteristics. While asymmetrical dental arches are prevalent in children11 due to various developmental factors, older individuals tend to exhibit arch asymmetry, due to cumulative external environmental influences over their lifetimes.16
This study assessed the efficacy and applicability of these two methods that utilize dental points and linear measurements, and compared their respective merits and discernment, namely which offers greater specificity and broader applicability to evaluate dental arch symmetry. The methods were evaluated using stereophotogrammetric linear measurements, offering insights into the selection of the most effective approach for potential applications in other studies. The null hypothesis tested was that no significant differences would exist between the methods for evaluating dental arch symmetry.
MATERIAL AND METHODS
This retrospective study was approved by the ethics review board of University of São Paulo (protocols 36314820.6.0000.5441 and 48136215.0.0000.5441). The sample size was determined to detect a strong-to-moderate correlation of 0.6, with a power test of 0.8 and 0.05 significance level. The minimum number of participants per group was 20. The sample comprised 40 participants, who were separated into two groups according to age and dentition (deciduous or permanent).
SAMPLE CHARACTERISTICS
The sample was comprised of two independent groups with different ages and characteristics. The child group comprised 20 participants aged five years, with complete deciduous dentition (10 teeth in each arch, total 20 teeth), Class I occlusal pattern, and without orthodontic intervention, caries, or severe dental crown destruction. The exclusion criteria were participants with harmful habits, the presence of syndromes and/or other anomalies, and difficult behavioral management (Fig 1).
Figure 1: Pointsand measurements in methods of evaluating symmetry in children. IN: incisor; C: canine; M: molar. (a): from the incisal point to the canine cusp tip; (b): linear distance from the canine cusp tip to the distobuccal cusp tip of the first deciduous molar; (c): linear distance from the incisal point to the distobuccal cusp tip of the first deciduous molar (Method 1). I: incisor; C: right canine; C’: left canine; M: right molar; M’: left molar. (a): from the cusp tip of the right canine to the distobuccal cusp tip of the first deciduous right molar; (b): from the distobuccal cusp tip of the right deciduous first molar to the left canine cusp tip; (c): from the cusp tip of the right canine to the distobuccal cusp tip of the left deciduous first molar; (d): from the cusp tip of the left canine to the distobuccal cusp tip of the left deciduous first molar (Method 2).
The adult group comprised 20 participants aged between 18 and 30 years, with complete permanent dentition (a total of 32 teeth with a third molar or 28 without a third molar), Angle Class III, and after orthodontic treatment with rapid maxillary expansion (RME) performed with Haas expanders attached to the canines and deciduous second molars, and a lingual bar extended to the permanent first molars. The activation protocol was the same for all participants: one full turn per day (2/4 in the morning and 2/4 in the evening) for seven days.17 After the active expansion, the device was maintained as retention for six months. These participants were followed-up after the skeletal maturity, with the expected orthodontic treatment completed to provide a Class I dental pattern. All adult patients were assessed after orthodontic treatment, to compare methods within the Angle Class I. Exclusion criteria were individuals with anomalies and incomplete documentation (Fig 2).
Figure 2: Pointsand measurements in methods for evaluating symmetry in adults. IN: incisor; C: canine; M: molar. (a): from the incisal point to the canine cusp tip; (b): linear distance from the canine cusp tip to the distobuccal cusp tip of the first permanent molar; (c): linear distance from the incisal point to the distobuccal cusp tip of the first permanent molar (Method 1). I: incisor; C: right canine; C’: left canine; M: right molar; M’: left molar. (a): from the cusp tip of the right canine to the distobuccal cusp tip of the first permanent right molar; (b): from the distobuccal cusp tip of the right permanent first molar to the left canine cusp tip; (c): from the cusp tip of the right canine to the distobuccal cusp tip of the left permanent first molar; (d): from the cusp tip of the left canine to the distobuccal cusp tip of the left permanent first molar (Method 2).
METHODS DESCRIPTION
METHOD 1
Linear measurements
The linear measurements were as follows: the incisor-canine distance (INC), corresponding to the linear distance from the incisal point to the canine cusp tip (a); the canine-molar distance (CM), corresponding to the linear distance from the canine cusp tip to the distobuccal cusp tip of the first permanent molar (b); and the incisor-molar distance (INM), corresponding to the linear distance from the incisal point to the distobuccal cusp tip of the first permanent molar (c) as suggested by Al Zubair.12 These measurements were analyzed in both the child group (Fig 1) and the adult group (Fig 2).
Statistical analysis
The t-test (t-value) and the correlation coefficient (r-value) were applied to test the significance of differences between the right and left sides of the maxillary and mandibular segmental measurements. Statistical significance was predetermined at the 95% level, at p < 0.05. The outcomes were determined from tables showing the means and the standard deviations obtained using Minitab software version 19.
METHOD 2
Linear measurements
The mathematical equation for symmetry analysis can be summarized as two points being symmetrical with respect to a line if the line is perpendicular to the segment connecting the points and if it crosses the segment in the middle. Therefore, two points were identified on the curve: C symmetric to C’ and M to M’ (four points were marked). According to these criteria, the present study used: C/C´ = in the cusp tip of the canine teeth and M/ M´ = at the distobuccal cusp tip of the first molar (Figs 1 and 2). Moreover, if a line is perpendicular to two segments at the same time, the segments lie on two parallel lines: CC´ and MM´ segments are parallel to each other.18 Following geometric rules, these equalities were evaluated: CM = C´M´ (trapezium sides) and CM´ = C´M (trapezium diagonals). To simplify the expression, the sides and diagonals were assigned a single letter: CM = a, C´M = b, CM´ = c, and C´M´ = d. Rewriting the relationship and naming it as the IXS index, the IXS index3 = (a/d) · (b/c) = 1.
Therefore, if the points are symmetrical, the IXS index is 1. If the IXS index is less than 1, the trapezium is a scalene, with the two diagonals and the oblique sides of different lengths, as proposed by Mutinelli.3
Comparison of methods
Establishing a pertinent comparison between the methods for both groups require an understanding of the information provided by both methods. Both methods can be applied for digital or manual measurements, working with similar strategic points, such as canines and molars, and can be used to determine linear distances to analyze arch symmetry (Table 1). The analysis was performed with dental casts digitized by using a laser model scanner (R700^TM^; 3Shape, Copenhagen, Denmark) for all participants, and analyzed using the Vectra Analysis Module (VAM) software program (VECTRA H1; Canfield Scientific Inc., Fairfield, NJ, USA).
? Table 1:Characteristics of the two symmetry evaluation methods described in the literature.Method 1 (Al-Zubair, 2014)Method 2 IXS index (Mutinelli, 2006)Three points in each arch side (left and right)Four pointsThree linear measurements in each arch side (left and right)Four linear measurementsCorrelation and comparison between left and right sidesNo comparison and correlation between left and right sidesNo mathematical equationMathematical equationsSuitable to maxillary and mandibular archesSuitable to maxillary and mandibular archesDetects asymmetry according to the distancesDo not detects the asymmetry distancesThree values in each arch side, according to linear measurementsA single value resulting from the mathematical symmetry equation
The first method can compare and correlate the left and right sides in the maxillary and mandibular arches.12 However, with the IXS index, this analysis is not possible, because the symmetry method does not divide the arches along the midline.3
The comparison and correlation between sides determined in Method 1 was interpreted by using the “p” and “r” values. The correlation coefficient (r-value) ranged from -1.0 to +1. When it is close to +1, this means that a relationship exists between the quantitative variables, and that they vary similarly. If the r-value is close to zero, no relationship exists between the variables. For method 2, the IXS index was applied as follows: CM/CʹMʹ = CMʹ/CʹM and (CM/CʹMʹ) x (CʹM/CMʹ) = 1. Therefore, the interpretation of the bootstrapping results was similar. If symmetry of the points was found, the outcome did not differ significantly from 1.
Error of method
The measurements were evaluated twice by the same examiner in 50% of the digitized models, to analyze the error of the method 15 days after the first measurement. Systematic errors were evaluated using the repeated-measures t-test, with random errors calculated according to Dahlberg.19
RESULTS
No random or systematic errors were found (p ≥ 0.05).
The results were divided into the two methods, as shown in the tables and figures. In the first method,12 both children without orthodontic treatment and adults after orthodontic treatment had arch symmetry in the maxilla in all linear measurements, a paired t-test with no significant difference, and a strongly related correlation coefficient (r): for the child group, INC (r-value: 0.74), CM (r-value: 0.72), and INM (r-value: 0.85); and for the adult group, INC (r-value: 0.64), CM (r-value: 0.95), and INM (r-value: 0.86; Table 2). The opposite outcome was observed for the mandibular arch. Although the paired t-test did not indicate a statistically significant difference between the left and right sides, the correlation coefficient was not strongly related for most of the measures in both children and adults, except for the INC distance in the adults (r-value: 0.72; Table 2).
Table 2:Comparison and correlation coefficient between the left and right side of the children and adults.DimensionsRight sideLeft side Children (n=20)Mean±SD (mm)Mean±SD (mm)T paired valueCorrelation (r-value)Maxilla INC16.36 ± 1.01916.46 ± 0.960.560.74CM9.49 ± 0.589.53 ± 0.730.760.72INM24.35 ± 1.2724.57 ± 1.320.180.85Mandible INC12.44 ± 1.0512.28 ± 0.890.530.33CM9.80 ± 0.789.76 ± 0.660.810.45INM20.71 ± 1.2820.56 ± 1.240.600.51Adults (n=20)Mean±SD (mm)Mean±SD (mm)T paired valueCorrelation (r-value)Maxilla INC19.52 ± 1,2119.39 ± 1.270,580,64CM27.24 ± 1.7627.31 ± 1.810.600.95INM43.04 ± 2.5142.82 ± 2.670.470.86Mandible INC14.33 ± 0.9514.29 ± 0.930.790.72CM25.12 ± 2.7624.63 ± 2.530.430.46INM36.42 ± 2.5535.93 ± 2.640.460.35Statistically significant at P<0.01. INC: Incisor-canine distance, CM: Canine-molar distance, INM: Incisor-molar distance, SD: Standard deviation.
The second method evaluated was the IXS index,3 which is based on a mathematical equation evaluation involving the whole arch, with an IXS index of 1 indicating symmetry. The outcomes are presented in bootstrap-type resampling plots and a descriptive table. Plots in blue show evaluations of the maxillary and mandibular arch in children (Fig 3), which indicated more symmetry for the maxillary arch, with a mean of 1. However, the mandibular arch, even though it was considered symmetrical, exhibited a mean of 0.98±0.1 and variance of 0.01 (Table 3). Plots in green show evaluations of the maxillary and mandibular arch in adults (Fig 3), for which the outcome for both was arch symmetry, even though the bar graph distribution for the mandibular arch indicates more variance (value: 0.03), with a mean of 1±0.17 (Table 3).
Figure 3:The bootstrap diagram in the maxillary and mandibular arches in children (blue) and in adults (green).
Table 3:Descriptive bootstrap analysis resampling results in children and adults evaluated by IXS index.Observed sampleChildren Adults Mean ± SDVarianceSumMean ± SDVarianceSumIXS INDEX Maxillary1.00±0.050.00220.050.988±0.03210.00119.76IXS INDEX Mandibular0.98±0.100.0119.711.016±0.1740.03020.33Bootstrap samples for meanChildren Adults Mean ± SD95% CIpMean ± SD95% CIpIXS INDEX Maxillary1.00±0.010.97-1.020.790.988±0.000.973-1.000.15IXS INDEX Mandibular0.98±0.020.94-1.020.531.017±0.030.956-1.100.67
OUTCOME COMPARISON BETWEEN THE TWO EVALUATED METHODS
The maxillary arches in both children and adults were symmetrical when using both methods. When the mandibular arch in children and adults was evaluated using Method 1, no significant correlation was found between the right and left sides, indicating a tendency toward asymmetry. However, for the children and adults evaluated using Method 2, mandibular arch symmetry was determined for both groups.
Even though the assessment was not the same for both arches, the Bland-Altman graph showed concordance between the methods chosen, with most of the differences between the values of methods being close to zero, indicating method similarity (p=0.33; Fig 4).
Figure 4:The Bland-Altman graph to compare methods.
DISCUSSION
The present study assessed two methods for evaluating arch symmetry through linear measurements and proposed a critical discussion of their applicability and efficiency. This information will help researchers to choose a methodology based on the answers provided by these methods. The methods were chosen based on the relevant literature, with respect to the study design and statistical analysis provided by the authors.3 ^,^ 12 The selected sample covered different phases of dental treatment and dentition (deciduous and permanent).
The measurement methodology chosen in this study was based on stereophotogrammetry 3D analysis20, because it permits accurate measurements. When using calipers, it is necessary to repeat the measurements to apply the two methodologies. In stereophotogrammetry, the previously determined ratio can be used in both methods, reducing the risk of bias, and facilitating a comparison of the methods.
Previous studies have evaluated the prevalence of dentofacial skeletal mandibular asymmetry using computed tomography.21 ^,^ 22 The present study concluded that the mandibular arch tends to have more fluctuation asymmetry than does the maxillary arch, which is consistent with the results of other studies,4 ^,^ 23 although one study reported conflicting results.24
CRITICAL ANALYSIS OF THE APPLICABILITY AND EFFICIENCY OF METHODS
These methods have specific particularities, with the main difference between them being whether they cross the midline or palatal raphe.3 ^,^ 12 This comparative study conclusively demonstrated that both methods are effective for different types of dentitions (deciduous and permanent) and in Angle Class III cases that become Angle Class I after treatment. It could be relevant in addressing congenital asymmetries, highlighting the importance of comparing cleft and non-cleft sides. For these patients, method 1 is more appropriate and can contribute to future studies evaluating outcomes before and after orthognathic surgery and orthodontic treatment.
Both methods evaluated in this study efficiently assessed arch symmetry. Although Method 1 seems more difficult, the answers that it can provide are more specific, and this method can identify the asymmetrical area, once the comparison and correlation have been evaluated between the right and left sides of the arch. This method may be appropriate in the planning of orthodontic treatment, because once the asymmetric region has been identified, it can be corrected with tooth alignment. Diagnosing the arch and the side on which the asymmetry is located is necessary to determine the mechanics to be applied.25 In this way, Method 1 can aid orthodontists in treatment planning. Method 2 could not identify the asymmetric area. The IXS index does not allow the identification of where the curve is asymmetrical on the dental arch and how much expansion or constriction is required to improve symmetry;3 therefore, this assessment would be appropriate as a final evaluation after orthodontics, to determine the success of the treatment.
The differences between the methods are shown in Figure 4 (Bland-Altman). In the plot, differences close to zero demonstrate methods similarity and the widest range indicates the opposite. These divergences could be attributed to the mandibular arch because the IXS index method did not detect a fluctuating mandibular asymmetry, as in Method 1. Based on this analysis, the null hypothesis was partially rejected because the maxillae in children and adults presented symmetry, the mandible in Method 1 presented asymmetry, and the mandible in Method 2 presented symmetry.
The Bland-Altman method is usually used to compare different methodologies and was applied to the methods chosen because results close to 1 were expected, evidencing arch symmetry. Therefore, a comparison was performed by analyzing the results from the two methods (Method 1: correlation between the right and left sides, and Method 2: single-sample t-test).
The anterior component of occlusal force may be related to mandibular asymmetry, originating from the mesial inclination of the teeth to the occlusal plane, and may be related to the mesial migration of the teeth and late crowding of the mandibular incisors.26 Other factors may include the interproximal fibers, soft tissue changes, and growth.27 This anterior component of force may correlate with bite strength, masticatory function, age, sex, and craniofacial pattern.28
Missing teeth have been reported to cause asymmetry. However, a previous study29 found that mandibular asymmetry in adults was not associated with the absence of teeth in the posterior region of the dental arch.
In the present study, the adult group was classified as Angle Class III malocclusion, and one study detected the highest fluctuating asymmetry in Angle Class III malocclusion. Individuals with Class III malocclusion have been identified as having the highest levels of genetic and environmental stress during their early development.4
LIMITATIONS AND FUTURE PERSPECTIVES
The limitations of the present study included the groups evaluated (no craniofacial group, no mixed dentition, and no adolescents), the type of orthodontic treatment (RME, rapid maxillary expansion in the adult group), and methods used. The methodologies presented herein do not permit the diagnosis of which tooth was asymmetric. In the first method, the evaluation was based on the side (left or right) and the linear measurements. In the second method, the total arch was evaluated using a mathematical equation. This study focused on evaluating patients from Angle Class III (the most severe classification) to Class I; however, other classes and types of treatment should also be assessed. Future studies are necessary to compare other methodologies in participants of different ages and sexes or those who have received orthognathic surgery; these variables were excluded from the present study.
CONCLUSIONS
The two methods are useful for asymmetry analysis. Method 1 can evaluates the side on which the asymmetry is present, and Method 2 provides a complete-arch evaluation, based on a mathematical equation.
The reference list from the paper itself. Each links out to its DOI / PubMed record.
- 1Fischer B Asymmetries of the Dentofacial Complex Angle Orthod 1954244179192
- 2Lundström A Some asymmetries of the dental arches, jaws, and skull, and their etiological significance Am J Orthod 196147281106
- 3Mutinelli S Symmetry evaluation in the dental arch the IXS index Prog Orthod 20067224425117143350 · pubmed ↗
- 4ŠkrinjarićA Šlaj M Šlaj M Fluctuating dental arch asymmetry in different malocclusion groups Acta Stomatol Croat 20185221051133003400910.15644/asc 52/2/3PMC 6047597 · doi ↗ · pubmed ↗
- 5Veli I Yuksel B Uysal T Longitudinal evaluation of dental arch asymmetry in Class II subdivision malocclusion with 3-dimensional digital models Am J Orthod Dentofacial Orthop 201414567637702488084710.1016/j.ajodo.2014.01.023 · doi ↗ · pubmed ↗
- 6Bishara SE Burkey PS Kharouf JG Dental and facial asymmetries a review Angle Orthod 19946428998801052710.1043/0003-3219(1994)064<0089:DAFAAR>2.0.CO;2 · doi ↗ · pubmed ↗
- 7Burstone CJ Diagnosis and treatment planning of patients with asymmetries Semin Orthod 199843153164980715210.1016/s 1073-8746(98)80017-0 · doi ↗ · pubmed ↗
- 8Kusnoto J Evans CA Be Gole EA Obrez A Orthodontic correction of transverse arch asymmetries Am J Orthod Dentofacial Orthop 2002121138451178687010.1067/mod.2002.119803 · doi ↗ · pubmed ↗