Selection criteria and husbandry practices of indigenous chicken producers in Northwest Ethiopia
Bekalu Muluneh, Mengistie Taye, Tadelle Dessie, Dessie Salilew Wondim, Damitie Kebede, Andualem Tenagne

TL;DR
This study explores how chicken farmers in Ethiopia select and care for chickens, finding that egg production and appearance are key factors, and that practices vary by region.
Contribution
The study identifies region-specific selection criteria and husbandry practices of indigenous chicken producers in Ethiopia to inform targeted breeding programs.
Findings
Egg production is the top selection criterion for female chickens across all regions.
Plumage color, appearance, and growth rate are the main factors for selecting male chickens.
Reproductive performance and flock composition differ significantly among agro-ecologies.
Abstract
This study was conducted to identify the selection criteria and husbandry practices of chicken producers in different agro-ecological zones of Northwest Ethiopia as input for designing a breeding program. The study employed a purposive selection of districts and peasant associations with high indigenous chicken potential. The study areas were stratified based on the major agro-ecologies (highland, midland, and lowland). A total of 360 households were included in the study, and data on chicken breeding practices, selection criteria, and reproductive performance were collected and analyzed using SPSS software. In all agro-ecologies, egg production was prioritized by chicken owners when choosing female chickens. For male chickens, plumage color (index = 0.27), appearance (index = 0.24), and growth rate (index = 0.23) were the main selection factors. Farmers kept chickens primarily to…
Genes, proteins, chemicals, diseases, species, mutations and cell lines named across the full text — each resolved to its canonical identifier and authoritative record.
Click any figure to enlarge with its caption.
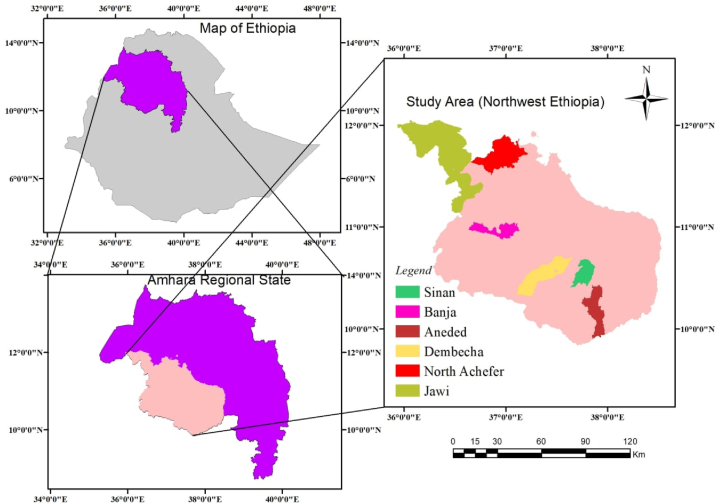 Figure 1
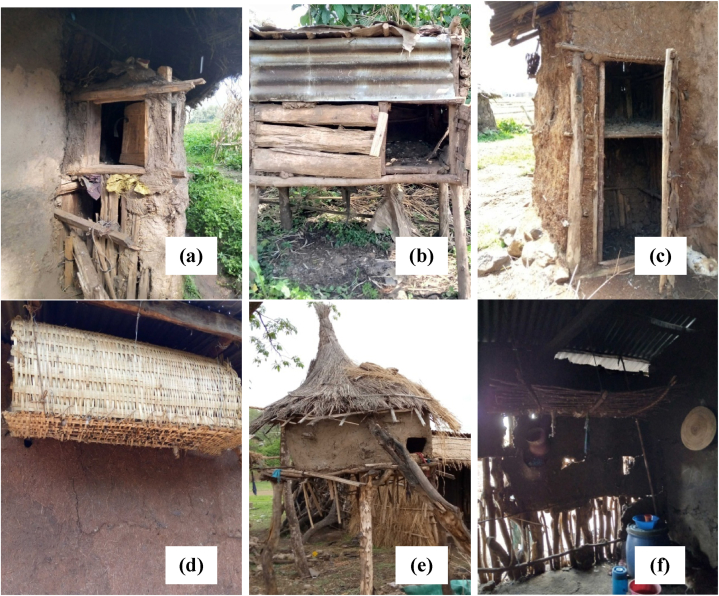 Figure 2
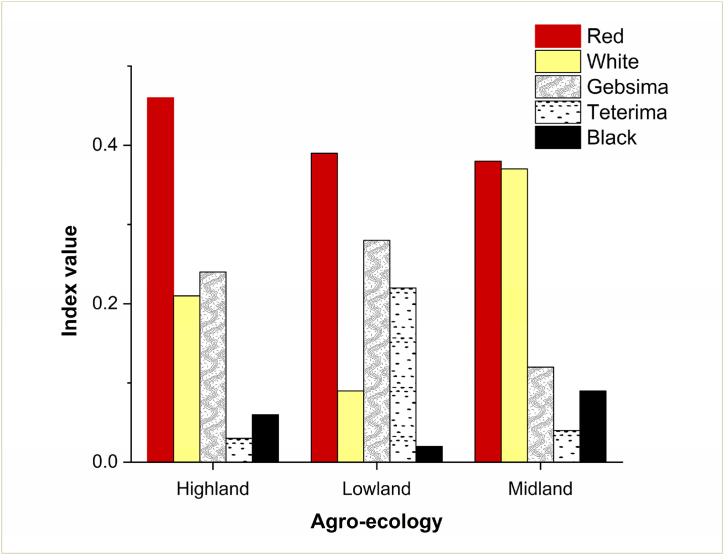 Figure 3
Peer Reviews
No public reviews on file for this paper yet. If you reviewed it on a platform where reviews are public (OpenReview, ICLR, NeurIPS, ICML), you can paste yours below so the community can read it here.
Videos
No videos yet. Explain this paper in a talk, walkthrough, or lecture? Add one.
Taxonomy
TopicsLivestock and Poultry Management · Animal Nutrition and Physiology · Silkworms and Sericulture Research
Introduction
1
Poultry production plays a crucial role in reducing poverty, ensuring food security, and generating income in developing countries [1,2]. It also provides opportunities for socio-economic improvement and inclusivity, benefiting low- and middle-income households, as well as vulnerable groups such as women, people with disabilities, orphans, and the unemployed [3,4]. Similarly, in Ethiopia, chickens hold significant socioeconomic importance, contributing to food security, income generation, religious rituals, and employment opportunities [5,6]. Rural Ethiopian families commonly raise both indigenous and exotic chicken breeds, with an estimated total poultry population of approximately 57 million, consisting of 78.85 % indigenous breeds, 9.14 % exotic breeds, and 12.03 % hybrid breeds [7].
Smallholder farmers maintain diverse flocks of indigenous chickens, meeting various economic, cultural, and religious needs [8,9]. Designing effective animal breeding programs for village chicken production requires a comprehensive understanding of farmers' management practices, production environment, breeding objectives, and trait preferences [10]. It is essential to incorporate economically significant traits into breeding programs to conserve chicken breeds, enhance productivity, and establish sustainable breeding strategies [11]. Although efforts have been made in Ethiopia to improve poultry productivity through the introduction of exotic breeds, these initiatives have faced challenges due to the intensive management requirements of such chickens [12]. Therefore, prioritizing indigenous breeds and considering the specific needs and preferences of smallholder farmers is a potential intervention strategy to enhance village poultry production.
The breeding objectives, husbandry practices, and trait preferences of chicken producers residing in diverse agro-ecological regions can vary due to differences in attitudes and environmental conditions, including area-specific farming practices. Moreover, variations in attitudes and market factors can lead to differences in these aspects between chicken owners living near urban areas and those in rural or remote locations. Several scholars have conducted studies to identify selection criteria, breeding objectives, and management practices of farmers who raise indigenous chickens in various parts of Ethiopia. However, there is a dearth of information available regarding the selection criteria and breeding objectives of farmers in the northwest region of Ethiopia, particularly in the Awi zone, West Gojjam zone, and East Gojjam zone, where a significant genetic resource of approximately 5.8 million indigenous chickens exists [7]. Furthermore, the previous studies have not addressed pocket or remote areas within the districts/zones, leaving a gap in knowledge. Therefore, the current study was set to identify the selection criteria and husbandry practices of farmers keeping indigenous chicken ecotypes found in different agro-ecologies of Northwest Ethiopia. The findings of this study will provide valuable input for the design of a sustainable breeding program tailored to the specific needs of farmers in the region.
Material and methods
2
Description of the study areas
2.1
The study was conducted in selected districts (Banja, Jawi, Sinan, Aneded, Dembecha, and North Achefer) from Amhara National Regional State, Ethiopia (Fig. 1). The agro-ecological description, the number of indigenous chickens found in the study area and the major feed resources for the chickens are presented in Table 1.Fig. 1. Map of the study areas.Fig. 1. Table 1Agro-ecological description, number of indigenous chickens, and major feed resources for chickens in northwest Ethiopia.Table 1. District/sitePA/KebeleAgro-ecologyAltitude (m.a.s.l.)Annual rainfall (mm)Annual temperature (^O^C)Indigenous Chicken numberMajor feed resources for chickensBanja1Highland30282200–25607–2536,894wheat, maize, barley, oat, injera2Highland26853Highland2723Jawi1Lowland995650–125012–40256,000sorghum, finger-millet, maize, rice, Gobe, groundnut2Lowland11713Lowland1365Sinan1Highland3214900–15000–1519,652barley, maize, wheat2Highland31923Highland3081Aneded1Midland22031200–166010–2348,440maize, wheat, injera, barley, Engido2Midland20713Midland2142Dembecha1Midland1857980–110018–27113,219wheat, maize, barley, finger-millet, teff2Midland22873Midland1979North Achefer1Lowland14801100–142023–33248,671finger-millet, maize, sorghum, injera2Lowland14953Lowland1386PA= Peasant Association; m.a.s.l. = meter above sea level.Source: districts agricultural bureau, 2021
Sampling method
2.2
For this study, districts and peasant associations were selected purposively based on the chicken potential as per the information obtained from zonal agricultural office. The districts that are known for high indigenous chicken production and not sufficiently studied earlier were considered for the study. The districts were stratified based on major agro-ecologies (highland, midland, and lowland). Secondly, potential peasant associations (six from each agro-ecology) were selected based on information on the dissemination of exotic chickens in the past. Peasant associations, particularly found in pocket areas with no/very low distribution of exotic chickens were considered for the study. Finally, random sampling was held with the aid of agricultural extension workers among indigenous chicken owners having relatively high indigenous chicken numbers to select a total of 360 households (120 from each agro-ecology) for interview based on [13] formula for sample size determination.
Data collection
2.3
At each sampling site, farmers were briefed about the objective of the study before starting the data collection. A semi-structured questionnaire was designed and translated in to local language (Amharic) to address the major management practices, chicken composition, and the purpose of keeping chickens. The data was collected by trained enumerators with close supervision of investigators. The major chicken breeding practices, culling practices, and trait preferences of farmers, including their criteria to select breeding cocks and hens, were assessed. In addition, information on the effective number of breeding animals and the reproductive and production performance of chickens was collected from the chicken owners using a semi-structured questionnaire and focal group discussions with extension workers and model farmers.
Data management and analysis
2.4
The data was organized and analyzed using MS Excel and Statistical Package for Social Sciences (SPSS) version 26 [14]. Origin software was used to construct graph. Preliminary data analysis, such as the normality test was employed before conducting the main data analysis. Descriptive statistics, such as mean, frequency, and percentage were utilized in analyses of the data. The Pearson Chi-square test was employed to compare the qualitative variables between different agro-ecologies and Cramer's V was used to determine the magnitude of the association between variables. According to Ref. [15], a Cramer's V value greater than 0.25 indicates a strong association, while a value greater than 0.15 suggests a strong association, a value greater than 0.10 indicates a moderate association, a value greater than 0.05 implies a weak association, and a value of 0 or very close to 0 indicates no or very weak association. Mean comparisons were made using Tukey test. Indices were calculated to provide a ranking of the reasons for keeping chickens, farmers' trait preferences, and selection criteria according to the formula given by Ref. [16];
For the analysis of chicken flock composition, and chicken performance traits, the Generalized Linear Model (GLM) was used fitting agro-ecology as a fixed effect.
where,
Y_ij_ = the response variables;
μ = overall mean;
A_i_ = effect of the ith agro-ecology (highland, midland, and lowland) on the respective variables;
Ɛ_ij_ = residual error term.
The coefficient of inbreeding (ΔF) was calculated from the effective number of breeding animals [17].
where, ΔF = the inbreeding coefficient; Ne = the effective population number; Nm = number of breeding males; Nf = number of breeding females.
Results and discussions
3
Major indigenous chicken management practices
3.1
There was a significant difference (p < 0.01) observed in the nutritional management of chickens across different agro-ecologies, as shown in Table 2. The majority of respondents (98.6 %) provided supplementary feed for their chickens. Similarly, more than 94 % of farmers in various parts of Ethiopia also offered supplementary feed to their chickens [18]. The availability of different grains resulting from mixed crop and livestock farming systems, along with farmers' desire to enhance productivity, likely contributes to the trend of supplementing chickens. Regarding housing, a significant difference (p < 0.01) was found among the agro-ecologies, possibly due to variations in farmers' perceptions and the availability of local construction materials for chicken housing. Fig. 2 illustrates distinct chicken housing structures in highland agro-ecology (a and b), midland agro-ecology (c and d), lowland agro-ecology (e), and a chicken shelter located within a family house in lowland agro-ecology (f). In the study area, a significant proportion of farmers (approximately 53.34 %) constructed separate shelters for their chickens (Table 2). This indicates their awareness of the importance of separate housing in minimizing the risk of transmissible and Zoonotic diseases. A similar finding was reported by Ref. [8], where the majority (80 %) of chicken owners in Konso had separate shelters for their chickens. In terms of vaccination, a higher proportion (71.9 %) of the respondents in the study area vaccinated their chickens, demonstrating a good understanding among farmers regarding the use of vaccination to prevent diseases. In contrast, a study by Ref. [8] revealed that about 95 % of respondents raising village chickens in Farta, Mandura, Horro, Konso, and Sheka did not immunize or vaccinate their chickens.Table 2. The major management practices of indigenous chicken producers in northwest Ethiopia.Table 2. Management PracticesAgro-ecologyHighlandN = 120MidlandN = 120LowlandN = 120OverallN%N%N%N%Nutritional management Scavenging00.0000.0054.251.4 Scavenging with supplement12010012010011595.835598.6 Complete ration00.0000.0000.0000.00χ^2^=10.14**; Cramer's V=0.168Housing In the family house2722.53831.7423510729.72 Separate shelter60506755.86554.219253.34 Separate house with other animals3327.51512.5108.35816.11 Others/Tree00.0000.0032.530.83χ^2^=24.93**; Cramer's V=0.186Vaccination Yes9276.77965.88873.325971.9 No2823.34134.23226.710128.1χ^2^=3.66^NS^; Cramer's V=0.101N= Number of households; χ^2^ and Cramer's V values shows the association of agro-ecology with specific management practice; NS=Non-significant; **P < 0.01.Fig. 2. Separate chicken house in highland (a and b), midland (c and d) and lowland (e) agro-ecology; chicken shelter inside the family house in lowland agro-ecology (f).Fig. 2
Composition of chicken flocks
3.2
There was a highly significant difference (p < 0.001) observed in the composition of chicken flocks among agro-ecologies, except for layers, as shown in Table 3. In contrast to the findings of this study [19], reported that the average number of chicken flocks per household did not differ between lowland and highland agro-ecologies in different regions of Ethiopia. In highland and midland agro-ecologies, a larger number of chicks and pullets were found in addition to layers. The higher number of layers suggests that farmers primarily keep indigenous chickens for egg production. However, in the lowland agro-ecology, a higher proportion of chicks (34.9 %) per household were recorded compared to layers (23.2 %) and pullets (19.7 %). Similarly, a higher number of young chicks, followed by hens, were reported in the Burie district of Northwest Ethiopia [20] and the Indian Himalayan region [21]. The higher proportion of layers and chicks in the study area may be attributed to the farmers' aim of producing a larger number of eggs for sale and hatching for stock replacement. The lower proportion of cocks, particularly in the highland agro-ecology, could be due to selling cockerels and cocks for income generation and/or utilizing neighboring cocks for breeding purposes. This lower proportion of cocks and cockerels in the area may lead to increased inbreeding and the production of more unfertile eggs. The significant difference in chicken flock composition among different agro-ecologies may be influenced by variations in the breeding objectives of farmers who keep the chicken flocks.Table 3. Average chicken flock holding per household in different agro-ecologies of northwest Ethiopia.Table 3. Chicken flockAgro-ecologyp-valueHighland (N = 120)Midland (N = 120Lowland (N = 120OverallMean ± SD %Mean ± SD %Mean ± SD %Mean ± SD %Layers4.38 ± 2.043.54.8 ± 2.6414.18 ± 2.7423.24.45 ± 2.4733.5NSCocks0.82 ± 0.89^b^8.11.24 ± 0.93^a^10.61.44 ± 0.99^a^7.991.17 ± 0.978.8Pullets1.29 ± 2.04^c^12.82.24 ± 2.09^b^19.23.55 ± 2.47^a^19.72.36 ± 2.3917.8Cockerel0.64 ± 1.15^b^6.41.12 ± 1.71^b^9.52.58 ± 2.46^a^14.31.44 ± 2.0210.9Chicks2.94 ± 4.37^b^29.22.31 ± 3.59^b^19.76.3 ± 6.68^a^34.93.85 ± 5.3429N= Number of households; SD=Standard deviation; NS=Non-significant; ^a,b,c^Means across a row with different superscript letters denote significant differences at P < 0.001; Flock: a group of chicken with different age and sex categories.
Purpose of keeping chickens
3.3
The table presented, Table 4, outlines the ranking of chicken production objectives as perceived by smallholder farmers. Across all agro-ecologies, the main reasons for keeping male chickens were income generation (0.36), breeding for replacement stock (0.30), and meat consumption (0.21). These findings align with the results of [20], who reported that the primary purposes of chicken rearing in the Burie district were income generation (51 %), breeding (45 %), and home consumption (44 %). In the highland and midland agro-ecologies, the primary reason for keeping female chickens was egg production for selling, with index values of 0.41 and 0.39, respectively. Similarly, in various agro-ecologies of Ethiopia, indigenous chickens were primarily kept for income generation through the sale of eggs [18]. In the lowland agro-ecology, the main purposes of keeping chickens were egg production for home consumption (0.27) and selling (0.26), followed by breeding (0.25). These findings consistent with [22], who reported that indigenous chicken rearing in the West Oromia region of Ethiopia primarily focused on egg consumption and egg selling. The variation in chicken functions among different agro-ecologies can be attributed to socio-economic, socio-cultural, and perception differences among chicken owners. For example, in some areas studied, there was no tradition of consuming eggs, and even during the fasting season, eggs intended for hatching purposes were observed to rot instead of being provided to babies.Table 4. Farmers' purpose of keeping male and female chickens in northwest Ethiopia.Table 4. PurposeAgro-ecologyHighland (N = 120)Midland (N = 120)Lowland (N = 120)Overall indexRankIndexRankIndexRankIndex1st2nd3rd1st2nd3rd1st2nd3rdMale chickens Income (animal sale)535680.39505550.373559150.330.36 Breeding5026230.316115140.323917470.280.30 Meat(home consumption)1431370.20626420.164028230.280.21 Saving36380.08314210.0726250.060.07 Manure0040.0101190.030060.010.02 Ceremony01100.0118180.0541040.050.04Female chickens Income (Egg sale)7724170.417229100.393828160.260.35 Egg (home consumption)2752140.282141210.242651170.270.26 Income (animal sale)427550.17836300.18718480.140.16 Breeding1013260.111411230.12485290.250.16 Meat (home)0050.0152120.0411450.050.03 Saving2130.0201140.020050.010.02 Manure0310.010060.010000.000.01 Ceremony0000.000040.013400.020.01N= Number of households or respondents.
Selection criteria for breeding cocks and hens
3.4
The selection criteria for breeding cocks varied among different agro-ecologies, with the highland agro-ecology prioritizing growth rate/body weight (0.29), appearance (0.28), and plumage color (0.24), as indicated in Table 5. In the midland agro-ecology, comb type (0.26), plumage color (0.23), and growth rate (0.21) were considered the most important traits for selecting breeding cocks. In the lowland agro-ecology, plumage color (0.33), appearance (0.25), and comb type (0.17) were the major criteria for selection. Consistent with the current study, farmers in the Amhara (Farta) and Oromia (Horro) regions also emphasized plumage color as the primary selection criterion [8]. However, farmers in Kenya [23] and Rwanda [24] did not prioritize plumage color in their selection of chickens, which contrasts with the findings of this study. The preference for morphological traits such as plumage color and comb type over growth and adaptive traits (disease resistance, mothering ability, and scavenging ability) in the current study area can be attributed to socio-cultural factors, where farmers place importance on the visual aesthetics of chickens. For instance, red plumage and a double comb are favored over other traits for male chickens in most surveyed areas, and these traits can significantly influence the market price of chickens.Table 5. Ranking of selection criteria for breeding cocks and hens in northwest Ethiopia.Table 5. Class and section criteriaAgro-ecologyHighland (N = 120)Midland (N = 120)Lowland (N = 120)Overall indexRankIndexRankIndexRankIndex1st2nd3rd1st2nd3rd1st2nd3rdBreeding cocks Plumage color2134390.243323180.235322310.330.27 Appearance3531330.281331260.181644450.250.24 Growth rate5024130.292719310.212324160.180.23 Comb type1421300.163624310.262626190.210.21 Disease resistance0830.0311570.060450.020.04 Scavenging ability0120.012660.030040.010.02 Longevity0200.018130.042000.010.02Breeding hens Egg number5626220.34745150.342226300.200.29 Appearance3017200.20618130.093219180.210.17 Plumage color1120150.12524160.113215230.210.15 Broodiness17100.04918220.121228100.140.10 Egg fertility91760.091519110.1381460.080.10 Comb type1117180.12119130.0919200.060.09 Mothering ability0890.03015200.0713440.070.06 Disease resistance15130.040940.030520.020.03 Longevity1250.020360.020060.010.02 Scavenging ability0130.010000.000010.0010.00N= Number of households or respondents.
In terms of selecting breeding hens, the most important traits were egg number (0.29), appearance (0.17), and plumage color (0.15), as shown in Table 5. This aligns with the findings of [22] in the BakoTibe district of the Western Oromia region, where respondents utilized egg production as a key criterion for selecting and retaining hens in the flock. The selection of chickens based on egg production traits indicates that the primary breeding objective of farmers in the study areas is focused on egg production. In the highland agro-ecology, the most important traits for selecting breeding hens were egg number (0.34), appearance (0.20), comb type (0.12), and plumage color (0.12). In the midland agro-ecology, egg number (0.34), egg fertility (0.13), and broodiness (0.12) were the primary considerations. Farmers in the midland agro-ecology preferred hens with low brooding frequency to maximize egg production. In the lowland agro-ecology, plumage color (0.21), appearance (0.21), and egg number (0.20) were the most important traits for selecting breeding hens. In contrast to the current study [10], reported that farmers in the Gurage zone of Ethiopia prioritized adaptive traits (disease and scavenging ability) over production traits in all agro-ecologies. Similarly, a study conducted in Kenya found that egg yield, mothering ability, and body size were the most preferred traits among chicken farmers [25]. Studies conducted in the Indian Himalayan region [21] revealed that most households chose to rear indigenous chickens due to their adaptability and survivability. This preference suggests that farmers, especially those in the sub-temperate agro-ecology of the Himalayan region, prioritize these traits when selecting indigenous chickens, considering the challenging climatic conditions. Ethiopia's indigenous chicken breeds are known for their mothering ability, disease resistance, and the taste of their meat and eggs [26]. The lack of emphasis on adaptive traits in the current study area might be due to the presence of these unique characteristics in the indigenous chickens, which directs farmers' focus towards other traits. Considering farmers' preferences for specific traits is vital in designing sustainable improvement programs [27]. Failure to incorporate stakeholders' needs in breeding programs can lead to rejection by end users, as highlighted by Ref. [28].
Fig. 3 shows the plumage color preferences of chicken owners. Across all agro-ecologies, the most favored color types were red, white, and Gebisma (wheaten strips on a black background, grayish with varying mixture, and red brownish with black). However, in the lowland agro-ecology, Teterima (black spot on white, black with white tips, and white with black or red spots) were more preferred than white. Likewise, the chicken owners in Benshangul-Gumuz (Mandura), Oromia (Horro), and Southern Regions (Konso and Sheka) preferred red plumage color, while farmers in Amhara (Farta) favored white plumage color, as noted by Ref. [8]. On the other study, farmers in Mezhenger, Sheka, and Benchi-Maji zones of southwestern Ethiopia predominantly preferred red plumage color [29]. However, the same study also reported black as the second most preferred color for selecting cocks, which contradicts the findings of the current study. In the present study, black plumage color was not preferred by farmers in any agro-ecology due to its cultural significance. Farmers generally avoid slaughtering chickens with black plumage color, especially during holidays, and these chickens tend to have lower market prices compared to others. In some areas, farmers refrain from choosing chickens with white plumage color because they are more visible and can be easily targeted by predators. Furthermore, some chicken owners hold the belief that white plumage color is attractive and that the "evil eye" of people could affect the growth and production of the chickens. These factors contribute to the dominance of red plumage color across all agro-ecologies.Fig. 3. Ranking index value for plumage color preference of farmers keeping indigenous chicken in different agro-ecologies of northwest Ethiopia. Gebsima = wheaten strips on a black background; Teterima = black spot on white.Fig. 3
Breeding and culling practices
3.5
A highly significant difference (p < 0.001) was observed across different agro-ecologies in terms of brood modification methods. In the highland and midland agro-ecologies, the majority of farmers (31.7 % and 56.7 %, respectively) practiced hanging their broody hen's upside-down to modify brooding (Table 6). This aligns with the findings of [29] in Mezhenger, Sheka, and Benchi-Maji zones of southwestern Ethiopia, where 38.2 % of chicken owners employed the upside-down hanging method for brood modification. In contrast, most lowland chicken owners in the current study (43.3 %) opted to change the brooding place as their preferred method. The variation in brood modification methods among agro-ecologies could be attributed to differences in farmers' perceptions. Some farmers in the study area consider hanging chickens for brooding modification as unethical, and there is a decreasing trend in the use of this method over time. The study revealed that almost all farmers practiced an uncontrolled (natural) mating system. Out of the households surveyed, 76.9 % owned their own breeding cock, and the majority (70 %) of these cocks was obtained from their own flock. While owning a breeding cock can positively impact the fertility of eggs from hens, utilizing cocks from their own flock can increase the risk of inbreeding. Similar findings were reported in the Burie district of Northwest Ethiopia, where 70.7 % of chicken owners had their own cocks, primarily sourced from their own flocks [20].Table 6. Breeding and culling practices of indigenous chicken producer farmers in northwest Ethiopia.Table 6. Breeding PracticesAgro-ecologyHighland (N = 120)Midland (N = 120)Lowland (N = 120)OverallN%N%N%N%Brood modification Hanging upside-down3831.76856.7121011832.78 Change brooding place (In house)36302722.55243.311531.94 Moving to neighbor houses3529.22218.34638.310328.61 Do nothing43.321.7108.3164.44 Submerge into water up to the breast6510.800.0071.94 Other/tie wings separately10.800.0000.0010.28χ^2^=74.06***; Cramer's V=0.321Own cock Yes6755.810385.810789.227776.9 No5344.21714.21310.88323.1χ^2^=45.597***; Cramer's V=0.356Sources of breeding cock Own (private flock)42357461.7786519470 Purchased (Market)2520.82924.22924.28330χ^2^=2.302^NS^; Cramer's V=0.091If no cock, how do you breed your hens From neighbor4940.81714.21310.87995.2 I do not need a cock for my hens43.300.0000.0044.8χ^2^=2.379^NS^; Cramer's V=0.169Culling criteria Old age4436.74134.24537.54436.1 Poor productivity4638.34033.34335.84335.8 Sickness2016.72520.81915.82117.8 Lack of broodiness108.31411.71310.81210.3χ^2^=2.29^NS^; Cramer's V=0.891Culling method Home consumption3529.24134.23932.511531.9 Sale8369.27461.77965.823665.6 Sacrifice/cultural purpose21.754.221.792.5χ^2^=3.004^NS^; Cramer's V=0.065Culling age (male) ≥2 years3935.52924.24638.311431.7 ≥3 years6856.75848.35243.317849.4 ≥4 years12101411.71613.34211.7 ≥5 years181915.865267.2χ^2^=43.584***; Cramer's V=0.246Culling age (female) ≥2 years30252924.24638.310529.2 ≥3 years7360.85848.35243.318350.8 ≥4 years1512.51411.71613.34512.5 ≥5 years21.71915.865277.5χ^2^=26.725**; Cramer's V=0.193*N=Number of households; χ^2^ and Cramer's V values shows the association of agro-ecology with specific breeding practice; NS=Non-significant; ***P < 0.001.
All chicken owners in the study practiced culling unwanted chickens from their flocks, primarily due to old age (36.1 %), poor productivity (35.8 %), sickness (17.8 %), or lack of broodiness (10.3 %). A similar study conducted in different agro-ecologies of Ethiopia reported that the majority (91 %) of farmers practiced culling their chickens due to old age, sickness, low production, and brooding frequency [18]. The majority of respondents culled male (49.4 %) and female (50.8 %) chickens when they reached more than three years of age, as indicated in Table 6. This corresponds with the overall mean culling age of 3.37 ± 1.24 years found in southwestern Ethiopia [29]. In contrast, larger (4.3 years) and smaller (2.7 years) average culling ages were reported in Southern Ethiopia [30] and Northwest Ethiopia [20], respectively. The variation in culling age among different areas reflects the differing purposes and functions of chickens for farmers. Some farmers may choose to cull chickens earlier than expected for income generation purposes. The primary purposes for culling chickens among chicken owners were selling (65.6 %) and home consumption (31.9 %). This aligns with previous studies conducted in the Haramaya district of Eastern Ethiopia [31], where selling and home consumption were identified as the major reasons for culling.
Reproductive and production performance of indigenous chickens
3.6
All the reproductive and production performance traits showed a highly significant difference (p < 0.001) among the agro-ecologies (Table 7). The average age at first mating for hens was 5.07 ± 0.74 months in the highland area, 4.93 ± 0.65 months in the midland area, and 5.39 ± 1.22 months in the lowland area. These findings are consistent with [32], who reported an average age of 5.2 months for indigenous pullets at first mating in Northwest Ethiopia. Other studies also reported ages at first mating of 6.51 months in Horro district [33] and 26.15 weeks in BakoTibe and Dano districts [22]. The estimated average age for male chickens to reach sexual maturity was 4.81 ± 0.79 months in the highland area, 4.86 ± 0.78 months in the midland area, and 5.31 ± 1.11 months in the lowland area (Table 7). In comparison [29], reported an overall mean age of 4.9 months for cocks at first mating in southwestern Ethiopia. The observed differences in the age of sexual maturity for hens and cocks among the agro-ecologies could be attributed to genetic and environmental factors. In this study, the average age for chickens to lay their first egg was 5.61 ± 0.93 months. This is shorter than the findings of [18], who reported an average of 6.54 ± 0.063 months for pullets to lay their first egg in different agro-ecologies of Ethiopia.Table 7. The mean reproductive and production performance of indigenous chickens as estimated by farmers among different agro-ecologies in northwest Ethiopia.Table 7. ParametersAgro-ecologyp-valueHighlandN = 120MidlandN = 120LowlandN = 120OverallN = 360Mean ± SDMean ± SDMean ± SDMean ± SDAFM (months, female)5.07 ± 0.74^b^4.93 ± 0.65^b^5.39 ± 1.22^a^5.13 ± 0.93AFM (months, male)4.81 ± 0.79^b^4.86 ± 0.78^b^5.31 ± 1.11^a^4.99 ± 0.93Age at first egg (months)5.49 ± 0.73^b^5.38 ± 0.69^b^5.95 ± 1.12^a^5.61 ± 0.93Eggs per hen per clutch16.48 ± 3.13^a^15.38 ± 4.02^b^14.1 ± 2.61^c^14.99 ± 3.59Eggs per hen per year83.39 ± 32.29^a^82.27 ± 23.37^a^64.36 ± 15.9^b^76.67 ± 26.2***N=Number of households; AFM = Age at 1^st^mating; SD=Standard deviation; ^a,b,c^Means across a row with different superscript letters denote significant differences at P < 0.001.
The highland agro-ecology exhibited a higher number of eggs per hen per clutch (16.48 ± 3.13) compared to other agro-ecologies, with an overall value of 14.99 ± 3.59 eggs. This is higher than the reported value of 13.38 eggs per hen per clutch in the Western Oromia region of Ethiopia [22]. According to the respondents, the total number of eggs per hen per year was higher in the highland agro-ecology (83.4 ± 32.29) compared to the midland and lowland areas (82.27 ± 23.37 and 64.36 ± 15.9, respectively), as shown in Table 7. In contrast [18], reported that the midland agro-ecology had a higher number of eggs compared to other agro-ecologies, with a total annual egg production of 61.89 eggs. A study conducted by Ref. [29] reported a relatively lower number of eggs per hen per year (54.7) in southwestern Ethiopia. The improved performance of chickens in the current study compared to previous studies could be attributed to better management and breeding practices by farmers, as well as genetic variations among indigenous chickens.
Effective population size and level of inbreeding
3.7
The number of breeding male and female chickens, the effective population size, and the rate of inbreeding of indigenous chickens in the study area are presented in Table 8. The lowland agro-ecology exhibited a lower inbreeding coefficient (0.12) compared to other agro-ecologies. In contrast, the highland agro-ecology showed a higher coefficient of inbreeding (0.18). The higher inbreeding coefficient in the highland agro-ecology could be attributed to the presence of a smaller number of chickens within households. Increasing the number of chickens would result in a larger effective population size, as it would increase the likelihood of having a greater number of breeding animals. This finding differs from a study conducted in the highland agro-ecology of the Gurage zone, which reported a smaller inbreeding coefficient (0.06) compared to other agro-ecologies [10]. However, the present study consistent with the findings of [18] for the midland agro-ecology, which reported a 12.8 % inbreeding coefficient. Nevertheless, the inbreeding coefficients in the highland (7 %) and lowland (11.3 %) agro-ecologies were lower than those found in the current study. Another study by Ref. [8] reported inbreeding coefficients of 0.096, 0.10, 0.12, 0.144, and 0.157 for Konso, Horro, Mandura, Farta, and Sheka chickens, respectively. The significant variation in inbreeding coefficient values among agro-ecologies and different studies may be attributed to variations in estimation methods and breeding practices employed by farmers. Factors such as the absence of a breeding male within the flock, uncontrolled mating, limited awareness about inbreeding, and small flock sizes can contribute to the accumulation of inbreeding and a decrease in genetic diversity [17]. The inbreeding coefficient values obtained in the current study exceeded the maximum acceptable level of 0.063 [34]. Therefore, increasing the effective population size would be essential to mitigate the risk of inbreeding.Table 8. Effective population size and level of inbreeding in indigenous chickens found in different agro-ecologies of northwest Ethiopia.Table 8. Agro-ecologyNmNfNeΔFHighland0.824.382.760.18Midland1.244.83.940.13Lowland1.444.184.280.12Nm = Number of males; Nf = Number of females; Ne = Effective population size; ΔF= Inbreeding rate.
Conclusion
4
In conclusion, this study emphasizes that farmers prioritize egg production and growth rate when selecting chickens for income generation. Agro-ecology has a slight influence on trait preferences, management practices, and breeding objectives among households raising indigenous chickens. To achieve sustainable improvements in indigenous chicken productivity, it is crucial to consider farmers' production objectives and trait preferences within their specific production environment and agro-ecology.
Data availability
The data relevant to this study is unrestricted and provided as supplementary material with this manuscript. The data associated with this article has not been archived in a publicly accessible repository.
CRediT authorship contribution statement
Bekalu Muluneh: Writing – review & editing, Writing – original draft, Visualization, Validation, Software, Resources, Project administration, Methodology, Investigation, Funding acquisition, Formal analysis, Data curation, Conceptualization. Mengistie Taye: Writing – review & editing, Writing – original draft, Visualization, Validation, Supervision, Resources, Methodology, Data curation, Conceptualization. Tadelle Dessie: Writing – review & editing, Writing – original draft, Visualization, Validation, Supervision, Methodology, Investigation. Dessie Salilew Wondim: Writing – review & editing, Writing – original draft, Validation, Supervision, Methodology, Investigation. Damitie Kebede: Writing – review & editing, Writing – original draft, Visualization, Methodology, Investigation, Data curation. Andualem Tenagne: Writing – review & editing, Writing – original draft, Software, Methodology, Investigation, Formal analysis, Data curation, Conceptualization.
Declaration of competing interest
The authors declare that they have no known competing financial interests or personal relationships that could have appeared to influence the work reported in this paper.
The reference list from the paper itself. Each links out to its DOI / PubMed record.
- 1Bettridge J.M.Psifidi A.Terfa Z.G.Desta T.T.Lozano-Jaramillo M.Dessie T.Kaiser P.Wigley P.Hanotte O.Christley R.M.The role of local adaptation in sustainable production of village chickens Nat. Sustain.110201857458210.1038/s 41893-018-0150-930411000 PMC 6217978 · doi ↗ · pubmed ↗
- 2Zelleke G.Urge M.Animut G.Esatu W.Dessie T.Comparative growth performance and carcass characteristics of Guinea fowl (Numida meleagris) and three chicken genotypes Ethiopian Journal of Science and Technology 1512022819910.1007/s 11250-010-9747-3 · doi ↗
- 3Manyelo T.G.Selaledi L.Hassan Z.M.Mabelebele M.Local chicken breeds of Africa: their description, uses and conservation methods Animals 10122020225710.3390/ani 1012225733266253 PMC 7760642 · doi ↗ · pubmed ↗
- 4Kleyn F.Ciacciariello M.Future demands of the poultry industry: will we meet our commitments sustainably in developed and developing economies?World Poultry Sci. J.772202126727810.1080/00439339.2021.1904314 · doi ↗
- 5Gulilat L.Tegegne F.Demeke S.Hatchery and broody technologies and least cost ration practice for poultry production improvement in Ethiopia Cogent Food Agric.71202110.1080/23311932.2021.1913793 · doi ↗
- 6Tolasa B.Current status of indigenous and highly productive chicken breeds in Ethiopia Advances in Agriculture 2021202110.1155/2021/8848388 · doi ↗
- 7Central Statistical Agency (CSA)Agricultural Sample Survey 2020/21 (2013 E.C). Report on Livestock and Livestock Characteristics 2021 II 589
- 8Dana N.Van der Waaij L.H.Dessie T.Van Arendonk J.A.Production objectives and trait preferences of village poultry producers of Ethiopia: implications for designing breeding schemes utilizing indigenous chicken genetic resources Trop. Anim. Health Prod.4272010151915292051241110.1007/s 11250-010-9602-6PMC 2929342 · doi ↗ · pubmed ↗