Effect of nucleos(t)ide analogue discontinuation on the prognosis of HBeAg‐negative hepatitis B virus‐related hepatocellular carcinoma after hepatectomy: A propensity score matching analysis
Ting Sun, Yiwen Qiu, Tao Wang, Yi Yang, Haizhou Qiu, Shu Shen, Huasheng Pang, Wentao Wang

TL;DR
This study finds that discontinuing antiviral drugs may improve outcomes for some hepatitis B-related liver cancer patients after surgery.
Contribution
Identifies HBsAg-negative patients with hepatitis B-related liver cancer may benefit from stopping nucleos(t)ide analogues after surgery.
Findings
Nucleos(t)ide analogue continuation was an independent risk factor for recurrence-free survival in HBsAg-negative patients.
NA discontinuation was associated with better recurrence-free survival and comparable overall survival in HBsAg-negative patients.
HBsAg status significantly interacted with nucleos(t)ide analogue continuation or discontinuation outcomes.
Abstract
Although nucleos(t)ide analogues (NAs) are thought to reduce the risk of hepatitis B virus (HBV)‐related hepatocellular carcinoma (HCC), the effect of NA discontinuation on the prognosis of HBV‐related HCC after hepatectomy is rarely reported. We aimed to investigate the potential for hepatitis B virus e antigen (HBeAg)‐negative HBV‐related HCC patients to discontinue NAs based on preoperative hepatitis B virus surface antigen (HBsAg) status. This historical cohort study involved 1232 NA‐treated HBeAg‐negative patients who underwent curative hepatectomy for HBV‐related HCC from 2014 to 2019. The recurrence‐free survival (RFS) and overall survival (OS) of patients discontinuing NAs before surgery were compared with those continuing NAs. Propensity score matching (PSM) was used to balance baseline characteristics. Of all enrolled patients, 839 (68.1%) patients continued NAs, and 393…
Genes, proteins, chemicals, diseases, species, mutations and cell lines named across the full text — each resolved to its canonical identifier and authoritative record.
Click any figure to enlarge with its caption.
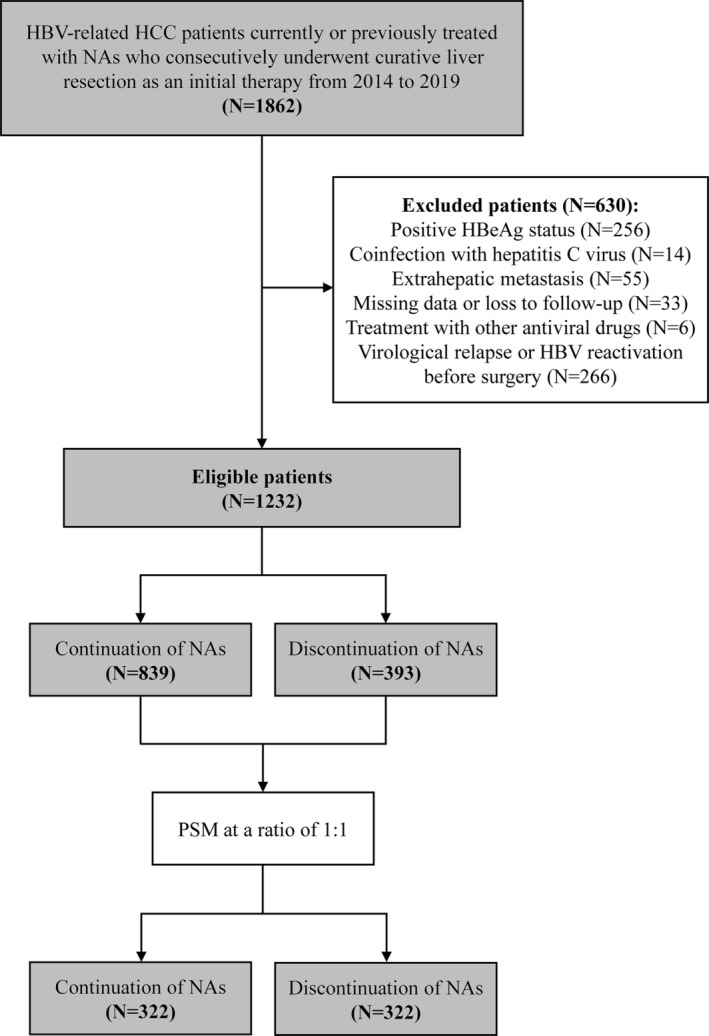 FIGURE 1
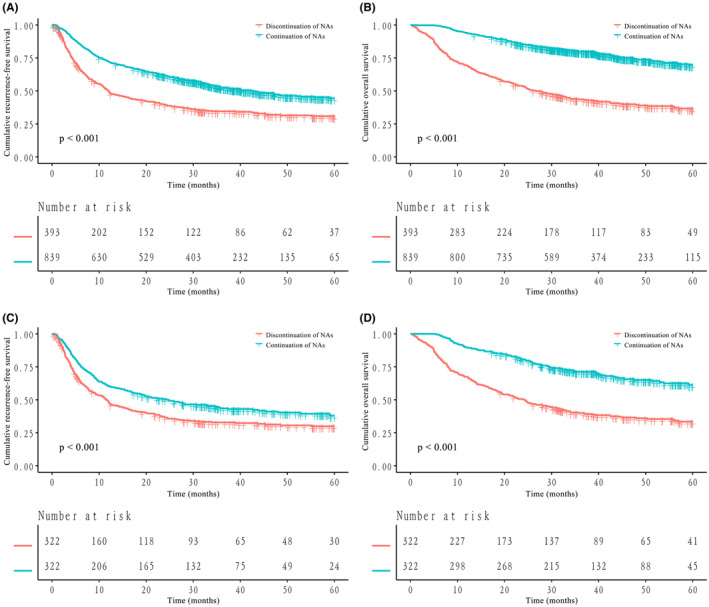 FIGURE 2
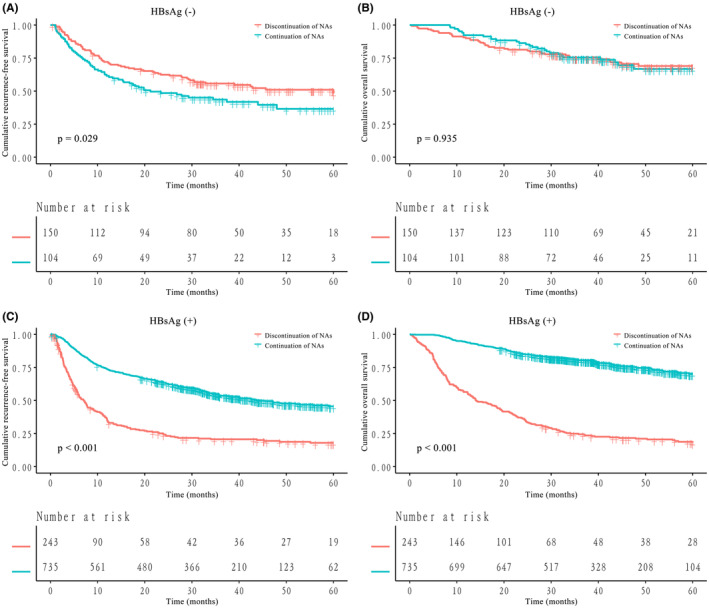 FIGURE 3
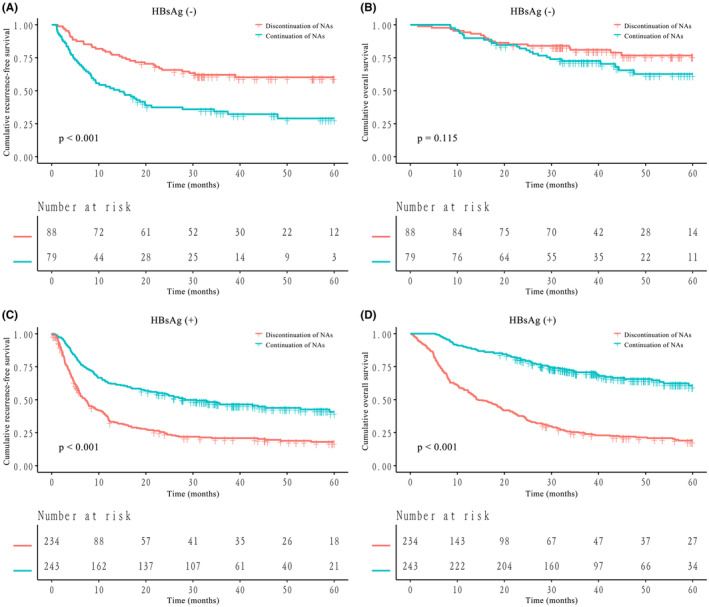 FIGURE 4
| Variables | Before PSM | After PSM | ||||
|---|---|---|---|---|---|---|
| Continuation of NAs ( | Discontinuation of NAs ( |
| Continuation of NAs ( | Discontinuation of NAs ( |
| |
|
| ||||||
| Age, years | 53.5 ± 11.1 | 55.1 ± 12.0 |
| 54.5 ± 12.0 | 54.9 ± 12.1 | 0.598 |
| Male sex | 721 (85.9%) | 345 (87.8%) | 0.375 | 280 (87.0%) | 279 (86.6%) | 0.907 |
| BMI, kg/m2 | 23.1 ± 3.1 | 23.2 ± 3.3 | 0.670 | 23.2 ± 3.2 | 23.1 ± 3.2 | 0.641 |
| Alcohol consumption | 330 (39.3%) | 170 (43.3%) | 0.191 | 138 (42.9%) | 134 (41.6%) | 0.750 |
| Cigarette smoking | 434 (51.7%) | 221 (56.2%) | 0.140 | 171 (53.1%) | 177 (55.0%) | 0.635 |
| Diabetes mellitus | 62 (7.4%) | 37 (9.4%) | 0.223 | 28 (8.7%) | 33 (10.2%) | 0.501 |
| Hypertension | 150 (17.9%) | 66 (16.8%) | 0.641 | 68 (21.1%) | 57 (17.7%) | 0.273 |
| Type of NA | ||||||
| ETV | 668 (79.6%) | 316 (80.4%) | 0.915 | 256 (79.5%) | 253 (78.6%) | 0.941 |
| TDF | 39 (4.6%) | 16 (4.1%) | 12 (3.7%) | 15 (4.7%) | ||
| Other | 32 (3.8%) | 17 (4.3%) | 14 (4.3%) | 15 (4.7%) | ||
| Exposure to two or more types of NAs | 100 (11.9%) | 44 (11.2%) | 40 (12.4%) | 39 (12.1%) | ||
|
| ||||||
| HBsAg‐positive | 735 (87.6%) | 243 (61.8%) |
| 243 (75.5%) | 234 (72.7%) | 0.418 |
| HBsAb‐positive | 121 (14.4%) | 117 (29.8%) |
| 72 (22.4%) | 78 (24.2%) | 0.576 |
| HBeAb‐positive | 750 (89.4%) | 337 (85.8%) | 0.065 | 272 (84.5%) | 285 (88.5%) | 0.134 |
| HBV DNA, IU/mL | ||||||
| ≤103 | 465 (55.4%) | 247 (62.8%) |
| 183 (56.8%) | 187 (58.1%) | 0.750 |
| >103 | 374 (44.6%) | 146 (37.2%) | 139 (43.2%) | 135 (41.9%) | ||
| AFP, ng/mL | ||||||
| ≤400 | 540 (64.4%) | 221 (56.2%) |
| 194 (60.2%) | 189 (58.7%) | 0.688 |
| >400 | 299 (35.6%) | 172 (43.8%) | 128 (39.8%) | 133 (41.3%) | ||
| Hemoglobin, g/L | 144.0 [133.0–155.0] | 143.0 [132.0–153.0] | 0.355 | 144.0 [132.0–155.0] | 143.0 [132.0–153.0] | 0.789 |
| Platelets, 109/L | 129.0 [94.0–175.5] | 150.0 [104.0–200.0] |
| 148.5 [103.0–197.0] | 144.0 [99.0–193.0] | 0.458 |
| ALT, IU/L | 34.0 [24.0–50.0] | 33.0 [21.0–52.0] | 0.547 | 35.0 [24.0–51.8] | 32.0 [21.0–49.0] | 0.416 |
| AST, IU/L | 34.0 [27.0–47.0] | 37.0 [27.0–58.0] |
| 38.0 [27.0–52.0] | 37.0 [27.0–55.0] | 0.991 |
| TBIL, μmol/L | 13.4 [10.3–17.7] | 13.6 [10.6–18.0] | 0.415 | 13.4 [10.0–18.0] | 13.7 [10.6–17.7] | 0.549 |
| Albumin, g/L | 42.9 [40.3–45.6] | 42.1 [39.6–44.8] |
| 42.2 [39.7–45.0] | 42.1 [39.4–44.6] | 0.893 |
| PT, s | 12.0 [11.4–12.7] | 12.1 [11.4–12.7] | 0.651 | 12.0 [11.4–12.6] | 12.1 [11.4–12.7] | 0.259 |
| Child–Pugh grade | ||||||
| A | 831 (99.0%) | 389 (99.0%) | 0.915 | 320 (99.4%) | 320 (99.4%) | 1.000 |
| B | 8 (1.0%) | 4 (1.0%) | 2 (0.6%) | 2 (0.6%) | ||
|
| ||||||
| ASA grade | ||||||
| I | 550 (65.6%) | 238 (60.6%) | 0.089 | 194 (60.2%) | 196 (60.9%) | 0.872 |
| II | 289 (34.4%) | 155 (39.4%) | 128 (39.8%) | 126 (39.1%) | ||
| Blood loss, mL | 200.0 [100.0–400.0] | 300.0 [200.0–500.0] |
| 300.0 [200.0–400.0] | 300.0 [200.0–500.0] | 0.796 |
| Operation time, min | 200.0 [160.0–250.0] | 220.0 [175.0–270.0] |
| 225.0 [175.0–273.8] | 215.0 [175.0–265.0] | 0.476 |
| Blood transfusion | 52 (6.2%) | 27 (6.9%) | 0.653 | 27 (8.4%) | 23 (7.1%) | 0.556 |
| Anatomic resection | 269 (32.1%) | 156 (39.7%) |
| 115 (35.7%) | 127 (39.4%) | 0.329 |
|
| ||||||
| Single tumor | 731 (87.1%) | 320 (81.4%) |
| 266 (82.6%) | 268 (83.2%) | 0.834 |
| Tumor size, cm | ||||||
| ≤5 | 504 (60.1%) | 152 (38.7%) |
| 134 (41.6%) | 141 (43.8%) | 0.577 |
| >5 | 335 (39.9%) | 241 (61.3%) | 188 (58.4%) | 181 (56.2%) | ||
| MVI | 224 (26.7%) | 142 (36.1%) |
| 110 (34.2%) | 107 (33.2%) | 0.803 |
| Satellite nodule | 78 (9.3%) | 44 (11.2%) | 0.298 | 44 (13.7%) | 36 (11.2%) | 0.339 |
| PVTT | 49 (5.8%) | 51 (13.0%) |
| 41 (12.7%) | 37 (11.5%) | 0.629 |
| Cirrhosis | 443 (52.8%) | 173 (44.0%) |
| 155 (48.1%) | 161 (50.0%) | 0.636 |
| Edmondson‐Steiner grade | ||||||
| ≤II | 452 (53.9%) | 212 (53.9%) | 0.982 | 155 (48.1%) | 174 (54.0%) | 0.134 |
| ≥III | 387 (46.1%) | 181 (46.1%) | 167 (51.9%) | 148 (46.0%) | ||
| BCLC stage | ||||||
| 0/A | 718 (85.6%) | 289 (73.5%) |
| 242 (75.2%) | 245 (76.1%) | 0.783 |
| B/C | 121 (14.4%) | 104 (26.5%) | 80 (24.8%) | 77 (23.9%) | ||
| Variables | RFS | OS | ||||||
|---|---|---|---|---|---|---|---|---|
| Univariate | Multivariate | Univariate | Multivariate | |||||
| HR (95% CI) |
| HR (95% CI) |
| HR (95% CI) |
| HR (95% CI) |
| |
| Age, years | 0.991 (0.984–0.997) |
| 0.989 (0.982–0.996) |
| 0.981 (0.973–0.990) |
| 0.989 (0.979–0.999) |
|
| Male sex | 1.146 (0.912–1.441) | 0.243 | 1.156 (0.869–1.538) | 0.318 | ||||
| BMI, kg/m2 | 0.993 (0.970–1.017) | 0.550 | 0.976 (0.947–1.005) | 0.105 | ||||
| Alcohol consumption | 1.013 (0.868–1.184) | 0.867 | 1.104 (0.912–1.335) | 0.310 | ||||
| Cigarette smoking | 1.147 (0.985–1.337) | 0.078 | 1.295 (1.070–1.567) |
| 1.283 (1.054–1.563) |
| ||
| Diabetes mellitus | 1.029 (0.773–1.370) | 0.844 | 1.144 (0.820–1.596) | 0.429 | ||||
| Hypertension | 0.855 (0.696–1.051) | 0.137 | 0.691 (0.524–0.911) |
| 1.177 (0.822–1.684) | 0.373 | ||
| ETV monotherapy | 1.121 (0.923–1.361) | 0.248 | 1.145 (0.896–1.463) | 0.278 | ||||
| NAs, continuation vs. discontinuation | 0.563 (0.481–0.659) |
| 0.623 (0.526–0.737) |
| 0.287 (0.238–0.347) |
| 0.243 (0.198–0.297) |
|
| HBsAg‐positive | 1.123 (0.927–1.362) | 0.235 | 1.489 (1.151–1.927) |
| 2.279 (1.667–3.116) |
| ||
| HBsAb‐positive | 0.919 (0.753–1.120) | 0.402 | 0.802 (0.622–1.034) | 0.088 | ||||
| HBeAb‐positive | 1.173 (0.922–1.491) | 0.194 | 1.663 (1.177–2.349) |
| 0.905 (0.621–1.317) | 0.601 | ||
| HBV DNA, IU/mL, >103 vs. ≤103 | 1.300 (1.116–1.515) |
| 1.161 (0.985–1.368) | 0.075 | 1.612 (1.335–1.945) |
| 1.258 (1.016–1.558) |
|
| AFP, ng/mL, >400 vs. ≤400 | 1.843 (1.581–2.149) |
| 1.297 (1.097–1.534) |
| 2.457 (2.033–2.970) |
| 1.562 (1.271–1.920) |
|
| Hemoglobin, g/L | 0.992 (0.988–0.997) |
| 0.996 (0.991–1.000) | 0.057 | 0.995 (0.990–1.001) | 0.083 | ||
| Platelets, 109/L | 1.003 (1.002–1.004) |
| 1.000 (0.999–1.001) | 0.666 | 1.003 (1.002–1.005) |
| 0.999 (0.998–1.001) | 0.442 |
| ALT, IU/L | 1.001 (1.000–1.002) |
| 1.000 (0.997–1.003) | 0.967 | 1.002 (1.001–1.003) |
| 0.998 (0.995–1.002) | 0.331 |
| AST, IU/L | 1.002 (1.001–1.003) |
| 1.000 (0.997–1.003) | 0.869 | 1.003 (1.002–1.004) |
| 1.001 (0.998–1.005) | 0.459 |
| TBIL, μmol/L | 1.001 (0.990–1.012) | 0.865 | 1.011 (1.005–1.018) |
| 1.007 (1.001–1.014) |
| ||
| Albumin, g/L | 0.941 (0.924–0.958) |
| 0.970 (0.950–0.989) |
| 0.925 (0.904–0.945) |
| 0.967 (0.942–0.992) |
|
| PT, s | 1.053 (0.995–1.114) | 0.072 | 1.114 (1.044–1.189) |
| 1.028 (0.945–1.117) | 0.526 | ||
| Child–Pugh grade, A vs. B | 1.459 (0.605–3.519) | 0.400 | 1.059 (0.396–2.835) | 0.909 | ||||
| ASA grade, II vs. I | 0.935 (0.797–1.096) | 0.407 | 0.766 (0.625–0.938) |
| 0.933 (0.701–1.240) | 0.632 | ||
| Blood loss, mL | 1.000 (1.000–1.000) |
| 1.000 (1.000–1.000) | 0.488 | 1.000 (1.000–1.000) |
| 1.000 (1.000–1.000) | 0.078 |
| Operation time, min | 1.003 (1.002–1.004) |
| 1.001 (1.000–1.002) | 0.100 | 1.004 (1.003–1.005) |
| 1.001 (0.999–1.002) | 0.274 |
| Blood transfusion | 1.620 (1.220–2.150) |
| 0.894 (0.632–1.266) | 0.529 | 1.869 (1.354–2.579) |
| 0.929 (0.621–1.389) | 0.718 |
| Anatomic resection | 1.078 (0.919–1.264) | 0.354 | 1.171 (0.964–1.423) | 0.111 | ||||
| Single tumor | 0.549 (0.452–0.666) |
| 0.916 (0.651–1.288) | 0.613 | 0.560 (0.445–0.706) |
| 1.188 (0.765–1.846) | 0.442 |
| Tumor size, cm, >5 vs. ≤5 | 2.745 (2.345–3.213) |
| 1.859 (1.551–2.229) |
| 2.952 (2.415–3.609) |
| 1.618 (1.289–2.030) |
|
| MVI | 2.105 (1.797, 2.467) |
| 1.355 (1.139–1.612) |
| 2.543 (2.101–3.079) |
| 1.492 (1.202–1.851) |
|
| Satellite nodule | 2.617 (2.114–3.241) |
| 1.825 (1.458–2.284) |
| 2.094 (1.626–2.698) |
| 1.417 (1.079–1.861) |
|
| PVTT | 2.656 (2.083–3.387) |
| 0.933 (0.629–1.383) | 0.729 | 3.816 (2.963–4.913) |
| 0.925 (0.566–1.510) | 0.754 |
| Cirrhosis | 1.025 (0.880–1.193) | 0.754 | 1.020 (0.845–1.231) | 0.838 | ||||
| Edmondson‐Steiner grade, ≥III vs. ≤II | 1.550 (1.330–1.805) |
| 1.296 (1.101–1.524) |
| 1.963 (1.621–2.376) |
| 1.557 (1.268–1.911) |
|
| BCLC stage, 0/A vs. B/C | 0.376 (0.315–0.448) |
| 0.609 (0.418–0.889) |
| 0.307 (0.251–0.375) |
| 0.461 (0.283–0.752) |
|
| Variables | RFS | OS | ||||||
|---|---|---|---|---|---|---|---|---|
| Univariate | Multivariate | Univariate | Multivariate | |||||
| HR (95% CI) |
| HR (95% CI) |
| HR (95% CI) |
| HR (95% CI) |
| |
| Age, years | 0.980 (0.972–0.989) |
| 0.983 (0.973–0.993) |
| 0.973 (0.964–0.982) |
| 0.986 (0.974–0.998) |
|
| Male sex | 1.234 (0.909–1.674) | 0.177 | 1.102 (0.788–1.543) | 0.570 | ||||
| BMI, kg/m2 | 0.970 (0.940–1.001) | 0.059 | 0.947 (0.913–0.982) |
| 0.997 (0.959–1.036) | 0.868 | ||
| Alcohol consumption | 0.983 (0.805–1.201) | 0.867 | 0.988 (0.787–1.239) | 0.913 | ||||
| Cigarette smoking | 1.098 (0.900–1.339) | 0.358 | 1.134 (0.905–1.419) | 0.275 | ||||
| Diabetes mellitus | 0.784 (0.546–1.126) | 0.187 | 0.799 (0.531–1.202) | 0.281 | ||||
| Hypertension | 0.768 (0.591–0.999) |
| 1.004 (0.749–1.348) | 0.976 | 0.589 (0.425–0.816) |
| 0.913 (0.587–1.421) | 0.686 |
| ETV monotherapy | 1.184 (0.922–1.521) | 0.186 | 1.176 (0.882–1.568) | 0.270 | ||||
| NAs, continuation vs. discontinuation | 0.716 (0.587–0.873) |
| 0.569 (0.463–0.700) |
| 0.375 (0.296–0.475) |
| 0.270 (0.211–0.345) |
|
| HBsAg‐positive | 1.507 (1.188–1.913) |
| 0.909 (0.648–1.277) | 0.583 | 2.760 (1.999–3.810) |
| 1.577 (1.014–2.454) |
|
| HBsAb‐positive | 0.684 (0.533–0.876) |
| 0.941 (0.681–1.300) | 0.710 | 0.480 (0.350–0.658) |
| 0.924 (0.626–1.363) | 0.689 |
| HBeAb‐positive | 1.293 (0.963–1.736) | 0.087 | 2.232 (1.471–3.387) |
| 0.898 (0.565–1.427) | 0.649 | ||
| HBV DNA, IU/mL, >103 vs. ≤103 | 1.412 (1.159–1.721) |
| 1.059 (0.847–1.324) | 0.613 | 1.951 (1.559–2.441) |
| 1.210 (0.937–1.564) | 0.144 |
| AFP, ng/mL, >400 vs. ≤400 | 1.957 (1.605–2.386) |
| 1.395 (1.118–1.740) |
| 2.194 (1.753–2.747) |
| 1.443 (1.130–1.842) |
|
| Hemoglobin, g/L | 0.991 (0.985–0.996) |
| 0.992 (0.986–0.998) |
| 0.994 (0.988–1.001) | 0.072 | ||
| Platelets, 109/L | 1.002 (1.001–1.004) |
| 1.000 (0.998–1.001) | 0.583 | 1.002 (1.001–1.004) |
| 1.000 (0.998–1.001) | 0.839 |
| ALT, IU/L | 1.001 (1.000–1.002) | 0.130 | 1.001 (1.000–1.002) | 0.154 | ||||
| AST, IU/L | 1.002 (1.001–1.003) |
| 1.000 (0.998–1.002) | 0.824 | 1.002 (1.001–1.003) |
| 1.000 (0.998–1.002) | 0.819 |
| TBIL, μmol/L | 0.992 (0.977–1.007) | 0.304 | 1.002 (0.986–1.018) | 0.842 | ||||
| Albumin, g/L | 0.956 (0.934–0.978) |
| 0.977 (0.952–1.003) | 0.086 | 0.939 (0.915–0.963) |
| 0.965 (0.936–0.993) |
|
| PT, s | 1.123 (1.020–1.237) |
| 1.005 (0.905–1.117) | 0.920 | 1.283 (1.158–1.423) |
| 1.088 (0.969–1.222) | 0.154 |
| Child–Pugh grade, A vs. B | 0.866 (0.278–2.699) | 0.805 | 0.966 (0.240–3.880) | 0.961 | ||||
| ASA grade, II vs. I | 0.817 (0.667–1.002) | 0.053 | 0.624 (0.490–0.793) |
| 1.073 (0.763–1.508) | 0.687 | ||
| Blood loss, mL | 1.000 (1.000–1.000) |
| 1.000 (1.000–1.000) | 0.760 | 1.000 (1.000–1.000) |
| 1.000 (1.000–1.000) | 0.453 |
| Operation time, min | 1.002 (1.001–1.004) |
| 1.001 (0.999–1.002) | 0.293 | 1.003 (1.002–1.005) |
| 1.001 (1.000, 1.003) | 0.172 |
| Blood transfusion | 1.537 (1.091–2.166) |
| 1.044 (0.657–1.658) | 0.855 | 1.716 (1.189–2.475) |
| 0.882 (0.520–1.497) | 0.642 |
| Anatomic resection | 0.932 (0.758–1.145) | 0.500 | 1.080 (0.859–1.359) | 0.509 | ||||
| Single tumor | 0.670 (0.525–0.857) |
| 0.892 (0.547–1.454) | 0.646 | 0.633 (0.482–0.830) |
| 1.104 (0.611–1.997) | 0.742 |
| Tumor size, cm, >5 vs. ≤5 | 2.529 (2.037–3.140) |
| 1.975 (1.548–2.519) |
| 2.347 (1.835–3.003) |
| 1.622 (1.234–2.131) |
|
| MVI | 2.091 (1.708–2.559) |
| 1.442 (1.149–1.809) |
| 2.416 (1.926–3.029) |
| 1.574 (1.212–2.044) |
|
| Satellite nodule | 2.413 (1.856–3.138) |
| 1.607 (1.199–2.152) |
| 1.717 (1.279–2.305) |
| 1.212 (0.865–1.698) | 0.265 |
| PVTT | 2.532 (1.923–3.335) |
| 0.997 (0.565–1.760) | 0.993 | 2.938 (2.208–3.911) |
| 0.815 (0.417–1.591) | 0.548 |
| Cirrhosis | 0.976 (0.801–1.189) | 0.806 | 1.114 (0.891–1.392) | 0.345 | ||||
| Edmondson‐Steiner grade, ≥III vs. ≤II | 1.657 (1.358–2.022) |
| 1.378 (1.112–1.707) |
| 2.118 (1.682–2.666) |
| 1.822 (1.428–2.325) |
|
| BCLC stage, 0/A vs. B/C | 0.420 (0.338–0.520) |
| 0.626 (0.363–1.079) | 0.092 | 0.350 (0.277–0.442) |
| 0.421 (0.221–0.802) |
|
| Variables | Discontinuation of NAs | Continuation of NAs |
| ||||
|---|---|---|---|---|---|---|---|
|
| HR (95% CI) |
|
| HR (95% CI) |
| ||
|
| |||||||
| RFS | |||||||
| HBsAg status | |||||||
| HBsAg‐negative | 150 | Reference | – | 104 | 1.468 (1.038–2.075) |
|
|
| HBsAg‐positive | 243 | 2.932 (2.220–3.873) |
| 735 | 1.027 (0.794–1.330) | 0.838 | |
| OS | |||||||
| HBsAg status | |||||||
| HBsAg‐negative | 150 | Reference | – | 104 | 0.976 (0.603–1.578) | 0.920 |
|
| HBsAg‐positive | 243 | 4.960 (3.538–6.953) |
| 735 | 0.820 (0.583–1.153) | 0.254 | |
|
| |||||||
| RFS | |||||||
| HBsAg status | |||||||
| HBsAg‐negative | 88 | Reference | – | 79 | 2.377 (1.544–3.658) |
|
|
| HBsAg‐positive | 234 | 3.528 (2.440–5.103) |
| 243 | 1.619 (1.110–2.360) |
| |
| OS | |||||||
| HBsAg status | |||||||
| HBsAg‐negative | 88 | Reference | – | 79 | 1.605 (0.876–2.942) | 0.126 |
|
| HBsAg‐positive | 234 | 6.752 (4.158–10.966) |
| 243 | 1.687 (1.011–2.814) |
| |
- —National Natural Science Foundation of China 10.13039/501100001809
- —NHC Key Laboratory of Echinococcosis Prevention and Control
- —Health Commission of the Tibet Autonomous Region
- —Science and Technology Program of Sichuan Science and Technology Department
Peer Reviews
No public reviews on file for this paper yet. If you reviewed it on a platform where reviews are public (OpenReview, ICLR, NeurIPS, ICML), you can paste yours below so the community can read it here.
Videos
No videos yet. Explain this paper in a talk, walkthrough, or lecture? Add one.
Taxonomy
TopicsHepatitis B Virus Studies · Hepatitis C virus research · Liver Disease Diagnosis and Treatment
INTRODUCTION
1
Hepatocellular carcinoma (HCC) accounts for approximately 75%–85% of primary liver cancer, which was the third leading cause of cancer death worldwide in 2020, with approximately 830,000 deaths.1 Patients with HCC have a dismal prognosis, with median overall survival (OS) ranging from 3 to 60 months.2 Chronic infection with hepatitis B virus (HBV) or chronic hepatitis B (CHB) is the main risk factor for HCC and the top contributor to HCC in Asia.3 In China, approximately 23 million patients were infected with HBV, and the number of HBV‐associated deaths was nearly 162,000 in 2019.4 Because HBV infection accounts for the majority of liver cancer deaths worldwide, control of HBV is one of the major strategies for the treatment of HCC.5
Chronic infection with HBV is a dynamic process and tends to present hepatitis B virus e antigen (HBeAg) seroclearance followed by hepatitis B virus surface antigen (HBsAg) seroclearance when patients are undergoing antiviral therapy. It is generally believed that the loss of HBsAg, also called “functional cure,” is the optimal treatment endpoint in CHB patients.3 Several studies and guidelines also stated that HBsAg seroclearance is associated with a reduced risk of HCC development.6, 7 Currently, nucleos(t)ide analogues (NAs), including entecavir (ETV), tenofovir disoproxil fumarate (TDF), etc., are recommended as the first‐line antiviral treatment for CHB in clinical practice due to their low drug resistance.3, 8, 9 However, the uniform criteria for the discontinuation of NAs are still less well established and need to be further improved because of insufficient evidence and limitations of the clinical circumstances. For example, the American Association for the Study of Liver Diseases (AASLD) suggested indefinite antiviral therapy for HBeAg‐negative, immune‐active CHB patients, but the European Association for the Study of the Liver (EASL) recommended that NAs should be discontinued after HBsAg loss.3, 8 Nevertheless, some clinicians may still recommend the continuation of NAs to prevent relapse for CHB patients regardless of their serological assay results.
It is normally assumed that the prognosis of HCC is primarily associated with the biological behavior of cancer cells and tumor stage, including vascular invasion, satellite nodules, tumor biomarkers, multiple tumor nodules, and tumor size.10, 11 Moreover, a growing number of studies have indicated that serological indicators may be effective predictors for the prognosis of HBV‐related HCC patients. On the one hand, previous studies have found that positive serum HBeAg was associated with recurrence and poor survival in HBV‐related HCC patients undergoing liver resection.12, 13 On the other hand, some researchers have also reported the impact of HBsAg seroclearance or preoperative HBsAg levels on the recurrence of HBV‐related HCC after curative resection.14, 15, 16 Considering that NAs are widely used for CHB treatment and contribute to HBeAg/HBsAg seroclearance, NAs are usually essential for HBV‐related HCC patients. However, there is a lack of research regarding the effect of NA discontinuation on the prognosis of HBeAg‐negative HBV‐related HCC and the discontinuation criteria of NAs in HBeAg‐negative patients with HBV‐related HCC.
In this historical cohort study, we aimed to assess the effect of NA discontinuation before liver resection on recurrence and overall survival of HBeAg‐negative HBV‐related HCC patients undergoing liver resection and tried to investigate the potential for them to discontinue NAs based on preoperative serum HBsAg status.
MATERIALS AND METHODS
2
Patients
2.1
The present historical cohort study was conducted on consecutive HBeAg‐negative HBV‐related HCC patients who underwent curative liver resection as first‐line therapy at West China Hospital, Sichuan University, from January 2014 to December 2019.
The inclusion criteria were as follows: (1) patients who received R0 liver resection as an initial treatment and had not received any other antitumor therapies before surgery; (2) patients with a histopathological diagnosis of HCC; and (3) patients who (1) underwent continuous antiviral treatment with NAs before surgery for at least 3 years and consistently continued NAs for the entire follow‐up period (continuation of NAs group) or (2) had previously undergone antiviral treatment with NAs for at least 3 years but had discontinued NAs before surgery for at least 1 year and were in the NA‐withdrawal state for the entire follow‐up period (discontinuation of NAs group). Continuation or discontinuation of NAs was performed and the period of discontinuation mentioned above was set according to the EASL guidelines3 or the Asian Pacific Association for the Study of the Liver (APASL) guidelines.9, 17 Specifically, treatment could be stopped (1) after HBsAg loss, with or without anti‐HBs seroconversion, (2) after at least 1 year of additional therapy after HBeAg seroconversion with undetectable HBV DNA, or (3) after treatment for at least 2 years with undetectable HBV DNA. The stopping of NA treatment could be considered in cirrhotic patients under strict monitoring. After stopping of NAs, patients should be monitored monthly for the initial 3 months and then every 3–6 months.
The exclusion criteria were as follows: (1) positive HBeAg status in preoperative assessments; (2) coinfection with hepatitis C virus; (3) extrahepatic metastasis; (4) missing data or loss to follow‐up; (5) treatment with antiviral drugs for HBV other than NAs (e.g., interferon); and (6) virological relapse or HBV reactivation before surgery.
Perioperative data
2.2
All relevant demographic characteristics and medication use were ascertained from self‐reports and medical record abstraction. Alcohol consumption and cigarette smoking were categorized on the basis of current or past use. Diabetes mellitus/hypertension was defined as a diabetes/hypertension diagnosis by a physician or other health professional. Routine preoperative assessments consisted of serological tests and imaging examinations. Hepatitis B serology, HBV DNA load, serum alphafetoprotein (AFP), liver function test, etc., were included. All patients underwent preoperative contrast‐enhanced computed tomography (CT) and/or magnetic resonance imaging (MRI), and tumor resectability was carefully evaluated by experienced surgeons.
Intraoperative data, including physical status, blood loss, operation time, blood transfusion and hepatectomy method (anatomical liver resection or nonanatomic liver resection), were recorded. Physical status was evaluated according to the American Society of Anesthesiologists (ASA) grading system. Anatomical liver resection was defined by the Brisbane 2000 nomenclature of liver anatomy.18
Professional pathologists examined all resected specimens and characterized pathologic findings, including tumor number and size, the presence of microvascular invasion and cirrhosis, tumor differentiation, etc.
Follow‐up and study outcomes
2.3
All patients were followed up once every 2 months for the first 2 years after surgery and once every 3 months thereafter until death or dropout from follow‐up. Contrast‐enhanced CT, MRI and serum AFP were included in follow‐up examinations and were mainly used to diagnose tumor recurrence. Treatment choices for patients diagnosed with tumor recurrence included repeat liver resection, transarterial chemoembolization, radiofrequency ablation, systemic therapy, liver transplantation or supportive treatment based on general conditions of patients and patterns of tumor recurrence. The primary endpoint was recurrence‐free survival (RFS) and the secondary endpoint was OS. RFS was defined as the period from surgery to first recurrence. OS was defined as the interval time between surgery and death.
Statistical analysis
2.4
Parametric continuous data are summarized as the mean ± standard deviation (SD), and nonparametric continuous data are summarized as the median and interquartile range (Q1–Q3). Categorical data are summarized as frequencies and percentages. Statistical comparison of continuous variables was performed using Student's t‐test or the Mann–Whitney U test as appropriate. Statistical comparison of categorical variables was performed using the Chi‐square test or Fisher's exact test as appropriate. Survival analyses were performed using the Kaplan–Meier method, and the log‐rank test was used for comparison. The Cox proportional hazards regression model was utilized to identify independent prognostic factors of OS and RFS. Propensity score matching (PSM) was used to balance important baseline characteristics between all patients or HBsAg‐negative patients continuing NAs and discontinuing NAs. A 1:1 matching on the propensity score was performed using the nearest‐neighbor matching algorithm with a caliper width equal to 0.01 (for all patients) or 0.1 (for HBsAg‐negative patients) of the SD of the logit of the propensity score. Interactions of subgroups were evaluated by the likelihood ratio test. All the reported p‐values are two‐tailed, and p < 0.05 was considered statistically significant. All statistical analyses were performed using Empower® (www.empowerstats.com, X&Y Solutions Inc., Boston MA).
RESULTS
3
Baseline characteristics
3.1
According to the inclusion and exclusion criteria, we enrolled 1232 eligible patients, of whom 839 (68.1%) patients continued NA therapy and 393 (31.9%) patients discontinued NA therapy before surgery (Figure 1). The median follow‐up time for all patients was 34.7 months (interquartile range, 22.3–50.5 months). As shown in Table 1, compared with patients in the discontinuation of NAs group, patients in the continuation of NAs group had more instances of preoperative positive HBsAg status (87.6% vs. 61.8%, p < 0.001), fewer instances of positive HBsAb status (14.4% vs. 29.8%, p < 0.001) and a higher percentage of HBV DNA > 10^3^ IU/mL (44.6% vs. 37.2%, p = 0.014). Some other baseline characteristics of the patients were also significantly different between the two groups before PSM. After PSM, 322 pairs of patients who continued and discontinued NAs were matched, and there were no significant differences between the two groups (Table 1).
Flow chart of patient selection and propensity score matching (PSM) process.
Univariate and multivariate Cox regression analyses of RFS and OS before and after PSM
3.2
Before PSM, univariate and multivariate Cox regression analyses were performed to identify independent prognostic factors for RFS and OS in all HCC patients (Table 2). The results showed that the continuation of NAs (HR 0.623, 95% CI 0.526–0.737, p < 0.001) was an independent predictor of RFS. Continuation of NAs (HR 0.243, 95% CI 0.198–0.297, p < 0.001), positive HBsAg status (HR 2.279, 95% CI 1.667–3.116, p < 0.001), etc., were independent prognostic factors for OS. Moreover, we performed Cox regression analysis of RFS and OS stratified by preoperative HBsAg status before PSM. Notably, we found that the continuation of NAs was an independent risk factor for RFS (HR 2.047, 95% CI 1.348–3.109, p < 0.001) and not an independent predictor for OS in HBsAg‐negative HCC patients (Table S1). However, the continuation of NAs was still an independent protective factor for RFS (HR 0.419, 95% CI 0.347–0.507, p < 0.001) and OS (HR 0.190, 95% CI 0.153–0.237, p < 0.001) in HBsAg‐positive HCC patients (Table S2).
After PSM, the results of the Cox regression analysis (Table 3) identified that the continuation of NAs (HR 0.569, 95% CI 0.463–0.700, p < 0.001) was an independent prognostic factor for RFS. Continuation of NAs (HR 0.270, 95% CI 0.211–0.345, p < 0.001), positive HBsAg status (HR 1.577, 95% CI 1.014–2.454, p = 0.043), etc., were independent predictors for OS. In addition, we also performed Cox regression analysis of RFS and OS stratified by preoperative HBsAg status after PSM. Similarly, the continuation of NAs was identified as an independent risk factor for RFS (HR 2.756, 95% CI 1.537–4.942, p < 0.001) and not an independent predictor for OS in HBsAg‐negative HCC patients (Table S3). However, the continuation of NAs was an independent protective factor for RFS (HR 0.400, 95% CI 0.315–0.506, p < 0.001) and OS (HR 0.218, 95% CI 0.166–0.287, p < 0.001) in HBsAg‐positive HCC patients (Table S4).
Overall impact of continuation of NAs or discontinuation of NAs on RFS and OS before and after PSM
3.3
Before PSM, the 1‐year, 3‐year and 5‐year RFS rates were 72.2%, 52.5% and 44.4% in the continuation of NAs group and 50.0%, 34.5% and 30.0% in the discontinuation of NAs group, respectively (p < 0.001, Figure 2A). The 1‐year, 3‐year and 5‐year OS rates were 93.9%, 79.8% and 69.7% in the continuation of NAs group and 69.2%, 43.5% and 35.9% in the discontinuation of NAs group, respectively (p < 0.001, Figure 2B). The results suggested that long‐term outcomes were significantly better in the continuation of NAs group than in the discontinuation of NAs group before PSM.
Kaplan–Meier curves for recurrence‐free survival (RFS) and overall survival (OS) of all hepatocellular carcinoma (HCC) patients stratified by nucleos(t)ide analogue (NA) therapy before and after propensity score matching (PSM). (A) RFS of all patients before PSM; (B) OS of all patients before PSM; (C) RFS of all patients after PSM; (D) OS of all patients after PSM.
After PSM, the 1‐year, 3‐year and 5‐year RFS rates were 60.3%, 43.5% and 38.0% in the continuation of NAs group and 48.7%, 32.8% and 29.9% in the discontinuation of NAs group, respectively (p < 0.001, Figure 2C). The 1‐year, 3‐year and 5‐year OS rates were 89.8%, 71.2% and 61.2% in the continuation of NAs group and 67.4%, 39.9% and 33.4% in the discontinuation of NAs group, respectively (p < 0.001, Figure 2D). Similarly, long‐term outcomes were better for HCC patients in the NA continuation group than in the NA discontinuation group after PSM.
The detailed median times, 1‐year, 3‐year, and 5‐year rates and corresponding p values are shown in Table S5.
Impact of continuation of NAs or discontinuation of NAs on RFS and OS based on preoperative HBsAg status before and after PSM
3.4
Before PSM, among HBsAg‐negative patients, the RFS in the discontinuation of NAs group was significantly better than that in the continuation of NAs group (1‐year, 3‐year and 5‐year RFS, 72.1%, 55.7% and 48.2% vs. 61.5%, 43.6% and 36.6%, p = 0.029, Figure 3A). There were no significant differences between the OS of HBsAg‐negative patients in the discontinuation of NAs group and in the continuation of NAs group (1‐year, 3‐year and 5‐year OS, 90.0%, 75.2% and 69.0% vs. 92.3%, 75.4% and 66.8%, p = 0.935, Figure 3B). For HBsAg‐positive patients, the RFS and OS in the continuation of NAs group were significantly better than those in the discontinuation of NAs group (1‐year, 3‐year and 5‐year RFS, 73.7%, 53.8% and 45.5% vs. 35.8%, 20.6% and 17.9%, p < 0.001, Figure 3C; 1‐year, 3‐year and 5‐year OS, 94.2%, 80.4% and 70.1% vs. 56.4%, 24.4% and 18.0%, p < 0.001, Figure 3D). Kaplan–Meier curves for RFS and OS of all the subgroups before PSM are shown in Figure S1A,B, respectively (both p < 0.001).
Kaplan–Meier curves for recurrence‐free survival (RFS) and overall survival (OS) of HBsAg‐negative or HBsAg‐positive hepatocellular carcinoma (HCC) patients stratified by nucleos(t)ide analogue (NA) therapy before propensity score matching (PSM). (A) RFS of HBsAg‐negative patients; (B) OS of HBsAg‐negative patients; (C) RFS of HBsAg‐positive patients; (D) OS of HBsAg‐positive patients.
After PSM, among HBsAg‐negative patients, the discontinuation of NAs group was associated with better RFS than the continuation of NAs group (1‐year, 3‐year and 5‐year RFS, 79.6%, 62.1% and 60.2% vs. 53.2%, 34.3% and 29.0%, p < 0.001, Figure 4A). There were also no significant differences between the OS of HBsAg‐negative patients in the discontinuation of NAs group and in the continuation of NAs group (1‐year, 3‐year and 5‐year OS, 94.3%, 81.0% and 76.7% vs. 89.9%, 72.6% and 62.7%, p = 0.115, Figure 4B). Similarly, the RFS and OS of HBsAg‐positive patients in the continuation of NAs group were significantly better than those in the discontinuation of NAs group (1‐year, 3‐year and 5‐year RFS, 62.6%, 46.4% and 40.8% vs. 36.1%, 20.9% and 18.0%, p < 0.001, Figure 4C; 1‐year, 3‐year and 5‐year OS, 89.7%, 70.7% and 60.6% vs. 57.3%, 24.9% and 18.9%, p < 0.001, Figure 4D). Kaplan–Meier curves for RFS and OS values in all subgroups after PSM are shown in Figure S1C,D, respectively (both p < 0.001).
Kaplan–Meier curves for recurrence‐free survival (RFS) and overall survival (OS) of HBsAg‐negative or HBsAg‐positive hepatocellular carcinoma (HCC) patients stratified by nucleos(t)ide analogue (NA) therapy after propensity score matching (PSM). (A) RFS of HBsAg‐negative patients; (B) OS of HBsAg‐negative patients; (C) RFS of HBsAg‐positive patients; (D) OS of HBsAg‐positive patients.
The detailed median times, 1‐year, 3‐year, and 5‐year rates and corresponding p values of the above subgroup analyses are shown in Table S5.
Furthermore, PSM was specially performed for HBsAg‐negative patients to balance the differences between HBsAg‐negative patients who continued and discontinued NAs. As shown in Table S6, 70 matched pairs of patients were obtained by PSM, and there were no significant differences between the two cohorts. After PSM, HBsAg‐negative patients who discontinued NAs was associated with better RFS than those who continued NAs (1‐year, 3‐year and 5‐year RFS, 72.9%, 59.8% and 51.2% vs. 57.1%, 46.9% and 36.7%, p = 0.032, Figure S2A). There were no significant differences between the OS of HBsAg‐negative patients who discontinued and continued NAs (1‐year, 3‐year and 5‐year OS, 91.4%, 77.8% and 72.6% vs. 92.9%, 74.1% and 71.4%, p = 0.764, Figure S2B).
Stratified analyses and interaction tests of associations between continuation of NAs or discontinuation of NAs and long‐term outcomes based on preoperative HBsAg status before and after PSM
3.5
As shown in Table 4, stratified analyses and interaction tests were performed to further assess the interactive effect of HBsAg status on associations between the continuation of NAs or the discontinuation of NAs and long‐term outcomes in HBeAg‐negative HBV‐related HCC patients. Interaction tests indicated that HBsAg status and continuation of NAs or discontinuation of NAs played an interactive role in the RFS and OS of patients both before PSM and after PSM (all p for interaction <0.001). Of note, the RFS of HBsAg‐negative patients in the continuation of NAs group was significantly worse than that in the discontinuation of NAs group both before PSM (HR 1.468, 95% CI 1.038–2.075, p = 0.030) and after PSM (HR 2.377, 95% CI 1.544–3.658, p < 0.001). However, the results of OS analysis between the discontinuation of NAs group and the continuation of NAs group for HBsAg‐negative patients were not statistically significant both before PSM (p = 0.920) and after PSM (p = 0.126).
DISCUSSION
4
In recent years, several researchers have studied the potential for CHB patients to discontinue NA therapy from immunological and virological viewpoints.19, 20 However, from guidelines and clinical practice, there is no clearly established consensus on the criteria for discontinuation of NA therapy in HBV‐related HCC patients. Moreover, scholars in numerous studies have elucidated associations between hepatitis B seromarkers and the risk of HBV‐related HCC, but relatively few studies have focused on the role of preoperative hepatitis B seromarkers in the postoperative outcomes of HBV‐related HCC.6, 21, 22 To our knowledge, this is the first large‐scale historical cohort study to investigate the potential for HBeAg‐negative HBV‐related HCC patients to discontinue NA therapy from a postoperative prognostic standpoint. In the present study, we found that compared with the discontinuation of NAs, the continuation of NAs was an independent protective factor and was significantly related to a better prognosis for all enrolled patients, which was not unexpected. Intriguingly, when stratified analyses were performed based on preoperative serum HBsAg status, the continuation of NAs was demonstrated to be an independent risk factor for RFS and was associated with worse RFS in HBsAg‐negative patients. Interaction tests also confirmed a significant effect of the interaction between the continuation of NAs or the discontinuation of NAs and HBsAg status on the long‐term outcomes of HBV‐related HCC. The results were confirmed by PSM analyses and presented the potential for clinicians to discontinue NAs in HBeAg‐negative HBV‐related HCC patients who had achieved HBsAg seroclearance before surgery.
As common antiviral drugs, NAs, represented by ETV and TDF, were demonstrated to be able to dramatically inhibit viral replication and effectively decrease the incidence of HBV‐related HCC,23, 24, 25 which might be a major concern among CHB patients. However, HBV‐related HCC patients are more concerned about the effect of NA therapy on long‐term outcomes after HCC surgery. Fortunately, NAs were also reported to be associated with reduced HBV‐related HCC recurrence and better postoperative survival for HBsAg‐positive patients.26, 27, 28 Nevertheless, NA therapy is not a perfect antiviral treatment for HBV patients thus far. Some younger patients or those planning pregnancy may be reluctant to receive life‐long antiviral treatment when considering safety issues and possible adverse effects.29 Moreover, infinite treatment may lead to reduced patient compliance and may not be conducive to improved cost‐effectiveness. Therefore, in recent years, an increasing number of scholars have begun to focus on the indication and feasibility of NA discontinuation for CHB patients.30, 31, 32 A multicenter study from Korea indicated that for CHB patients who achieved HBsAg seroclearance with NAs, the discontinuation of NAs was not associated with an increased risk of HCC development.30 Another longitudinal cohort study including Caucasians and Asians suggested that discontinuation of long‐term NA therapy was not associated with higher HCC risk for noncirrhotic HBeAg‐negative CHB patients.31 However, associations between the continuation of NAs or the discontinuation of NAs and postoperative prognosis have hardly been reported to provide guidance on NA discontinuation for HBV‐related HCC patients, which prompted us to conduct the present study.
We only included preoperative HBeAg‐negative HBV‐related HCC patients during the study. This is because the phases of chronic HBV infection are generally divided based on HBeAg status.3, 9 Furthermore, HBeAg seroclearance has often been regarded as an important milestone during antiviral treatment and is associated with good prognosis in CHB patients.12, 22, 33 It would be of great practical and theoretical importance to focus on HBeAg‐negative patients. In our entire cohort, the continuation of NAs group accounted for the majority of patients (68.1%), reflecting a relatively conservative antiviral treatment strategy for HBV‐related HCC patients. This proportion was similar to that observed in a previous study from Asia, although the inclusion and exclusion criteria of the two studies were not fully consistent.14 We found that patients in the continuation of NAs group had more incidents of positive HBsAg status, fewer incidents of positive HBsAb status and a higher percentage of HBV DNA > 10^3^ IU/mL in preoperative assessment, which might explain why they continued NA therapy. Considering the imbalanced baseline characteristics between the two crude groups, PSM was used to create statistically matched pairs in the continuation of NAs group and the discontinuation of NAs group. A strict caliper width equal to 0.01 of the SD for PSM guarantees good comparability between the two groups after PSM.
When we performed multivariate Cox regression analyses and log‐rank tests for comparisons of Kaplan–Meier curves in all HCC patients before and after PSM, we found that the continuation of NAs was always an independent protective factor for RFS and OS and that patients continuing NA therapy had better long‐term outcomes. These results are expected and similar to the conclusions from three previous randomized controlled trials (RCTs).26, 27, 28 However, the three RCTs only included HBsAg‐positive HBV‐related HCC patients and could not sufficiently conduct subgroup analyses due to limited sample size. Given that loss of HBsAg is the optimal treatment endpoint of CHB patients and that positive HBsAg status was an independent risk factor for OS both before and after PSM, subgroup analyses were subsequently conducted based on preoperative HBsAg status in more detail. Notably, the continuation of NAs was associated with a better long‐term prognosis in HBsAg‐positive HBV‐related HCC patients, whereas it seemed to play an almost opposite role in HBsAg‐negative patients. No matter before or after PSM, the continuation of NAs was an independent risk factor for RFS and was also not a protective factor for OS in HBsAg‐negative patients. Furthermore, HBsAg‐negative patients continuing NA therapy achieved worse RFS and comparable OS when compared with those discontinuing NA therapy both before and after PSM, regardless of PSM for all patients or PSM for HBsAg‐negative patients. These findings may provide a potential for preoperative HBsAg‐negative HBV‐related HCC patients to discontinue NA therapy under strict monitoring and may suggest a novel individualized therapeutic strategy to further improve the postoperative prognosis of HBV‐related HCC patients.
However, the reasons for the results in this study are not fully understood, and we can only speculate as to the mechanisms underlying the clinical findings. On the one hand, these findings may be attributed to successful viral control contributed by HBV‐specific immune T‐cell responses after antiviral treatment discontinuation.20, 34, 35 On the other hand, continuation of NAs for HBsAg‐negative patients may not always be beneficial due to potential side effects of long‐term medication.29, 36, 37 Therefore, our results should be interpreted with caution, and clinicians should fully weigh the benefits and risks of NA discontinuation in patients with HBV.
Another feature of the present study is the significant interaction between preoperative HBsAg status and continuation of NAs or discontinuation of NAs. As an effect modifier, HBsAg status markedly modified the effects of the continuation or discontinuation of NAs on the long‐term outcomes of HBV‐related HCC patients, which is a finding that has rarely been reported before. The results are understandable given that HBV replication can be suppressed by antiviral treatment and continuation or discontinuation of NAs is largely dependent on HBsAg status.3, 38 Clinicians should notice that the combined effects of HBsAg status and continuation or discontinuation of NAs may be greater than additive and realize the importance of individualized treatment.
The present study has several limitations. First, there were some potential confounding factors and unavoidable biases due to the retrospective nature of the study. To resolve this issue, we applied strict inclusion and exclusion criteria and used PSM, multivariable models and sensitivity analyses to minimize the confounding effects. Nevertheless, more prospective and randomized studies are warranted to confirm our findings and further develop well‐recognized discontinuation criteria for NA therapy. Second, this was a single‐center study only including HBV‐related HCC patients from China. Although we tried to keep the sample size as large as possible, the conclusions may not reflect the clinical practice of other medical centers or other ethnic groups. Third, considering that patients with virological relapse or HBV reactivation before surgery were a highly complex population and might require more complicated treatment strategies, we excluded them in the study. Effective strategies for this population would be an important topic for future studies. Fourth, despite our efforts, there were limited postoperative follow‐up data on HBV serological and virological indicators. Thus, we were unable to further analyze virological relapse after surgery. Detailed information on cause of death was also not available for all patients and analyses to assess the competing risk of death were not performed. Fifth, the median survival in some subgroups was not reached because of their relatively good prognosis and relatively short follow‐up times. We will conduct more studies targeting the correlated patients with longer follow‐up times in the future. Finally, the current study focused specifically on the interaction between HBsAg status and the continuation or discontinuation of NAs. Further studies are needed to better understand the interactions between the continuation or discontinuation of NAs and other key factors of HBV‐related HCC.
Taken together, among NA‐treated HBeAg‐negative patients who underwent curative liver resection for HBV‐related HCC, NA discontinuation was associated with better RFS and comparable OS than NA continuation in preoperative HBsAg‐negative patients. For HBsAg‐positive patients, NA continuation remained associated with better survival. From the perspective of postoperative prognosis, these results represent an important step in exploring the feasibility of NA discontinuation for those who have achieved HBsAg seroclearance before surgery and suggest the potential of discontinuing antiviral treatment with NAs in selected patients under conditions of strict monitoring.
AUTHOR CONTRIBUTIONS
Ting Sun: Conceptualization (lead); data curation (lead); formal analysis (lead); writing – original draft (lead). Yiwen Qiu: Conceptualization (supporting); data curation (supporting); formal analysis (supporting); writing – original draft (supporting). Tao Wang: Data curation (supporting); investigation (equal); methodology (equal). Yi Yang: Data curation (supporting); investigation (equal); methodology (equal). Haizhou Qiu: Visualization (equal). Shu Shen: Visualization (equal). Huasheng Pang: Visualization (equal). Wentao Wang: Funding acquisition (equal); project administration (equal); supervision (equal).
FUNDING INFORMATION
This research was supported by the Science and Technology Program of Sichuan Science and Technology Department (No. 2019YFS0576 & No. 2023YFS0229), the National Natural Science Foundation of China (No. 82170543 & No. 82000599), Health Commission of the Tibet Autonomous Region (No. 311220432) and NHC Key Laboratory of Echinococcosis Prevention and Control (No. 2021WZK1004). Corresponding author Wentao Wang is the guarantor. The funding body financed the costs of the study and contributed to the design of the study, interpretation of data, and revising the manuscript.
CONFLICT OF INTEREST STATEMENT
The authors report no conflict of interest.
ETHICS STATEMENT
The study was conducted in accordance with the Declaration of Helsinki and was approved by the Ethics Committee of West China Hospital of Sichuan University (No. 2021–1151). The requirement for informed consent was waived because the study was retrospective and the data were anonymized.
Supporting information
Figure S1.
Figure S2.
Table S1.
Table S2.
Table S3.
Table S4.
Table S5.
Table S6.
The reference list from the paper itself. Each links out to its DOI / PubMed record.
- 1Sung H , Ferlay J , Siegel RL , et al. Global cancer statistics 2020: GLOBOCAN estimates of incidence and mortality worldwide for 36 cancers in 185 countries. CA Cancer J Clin. 2021;71(3):209‐249.33538338 10.3322/caac.21660 · doi ↗ · pubmed ↗
- 2Yang JD , Hainaut P , Gores GJ , Amadou A , Plymoth A , Roberts LR . A global view of hepatocellular carcinoma: trends, risk, prevention and management. Nat Rev Gastroenterol Hepatol. 2019;16(10):589‐604.31439937 10.1038/s 41575-019-0186-y PMC 6813818 · doi ↗ · pubmed ↗
- 3EASL . 2017 clinical practice guidelines on the management of hepatitis B virus infection. J Hepatol. 2017;67(2):370‐398.28427875 10.1016/j.jhep.2017.03.021 · doi ↗ · pubmed ↗
- 4Yue T , Zhang Q , Cai T , et al. Trends in the disease burden of HBV and HCV infection in China from 1990–2019. Int J Infect Dis. 2022;122:476‐485.35724827 10.1016/j.ijid.2022.06.017 · doi ↗ · pubmed ↗
- 5Plummer M , de Martel C , Vignat J , Ferlay J , Bray F , Franceschi S . Global burden of cancers attributable to infections in 2012: a synthetic analysis. Lancet Glob Health. 2016;4(9):e 609‐e 616.27470177 10.1016/S 2214-109X(16)30143-7 · doi ↗ · pubmed ↗
- 6Yip TC , Wong GL , Chan HL , et al. H Bs Ag seroclearance further reduces hepatocellular carcinoma risk after complete viral suppression with nucleos(t)ide analogues. J Hepatol. 2019;70(3):361‐370.30367899 10.1016/j.jhep.2018.10.014 · doi ↗ · pubmed ↗
- 7Marrero JA , Kulik LM , Sirlin CB , et al. Diagnosis, staging, and Management of Hepatocellular Carcinoma: 2018 practice guidance by the American Association for the Study of Liver Diseases. Hepatology. 2018;68(2):723‐750.29624699 10.1002/hep.29913 · doi ↗ · pubmed ↗
- 8Terrault NA , Lok A , Mc Mahon BJ , et al. Update on prevention, diagnosis, and treatment of chronic hepatitis B: AASLD 2018 hepatitis B guidance. Hepatology. 2018;67(4):1560‐1599.29405329 10.1002/hep.29800 PMC 5975958 · doi ↗ · pubmed ↗