Exploring the mitochondrial genomes and phylogenetic relationships of trans-Andean Bryconidae species (Actinopterygii: Ostariophysi: Characiformes)
Edna Judith Márquez, Daniel Alfredo Gómez-Chavarría, Juan Fernando Alzate, Roberto E. Reis, Roberto E. Reis, Roberto E. Reis, Roberto E. Reis

TL;DR
This study explores mitochondrial genomes of Bryconidae fish species to better understand their evolutionary relationships and classification.
Contribution
The study provides new mitogenome data and phylogenetic insights for trans-Andean Bryconidae species.
Findings
Salminus mitogenomes are significantly larger than others in the study.
Trans-Andean species form two distinct sister clades based on phylogenetic analysis.
Current classification of Bryconidae may need revision due to genetic divergence.
Abstract
Comparative mitogenomics and its evolutionary relationships within Bryconidae remains largely unexplored. To bridge this gap, this study assembled 15 mitogenomes from 11 Bryconidae species, including five newly sequenced. Salminus mitogenomes, exceeding 17,700 bp, exhibited the largest size, contrasting with a median size of 16,848 bp in the remaining species (Brycon and Chilobrycon). These mitogenomes encode 37 typical mitochondrial genes, including 13 protein-coding, 2 ribosomal RNA, and 22 transfer RNA genes, and exhibit the conserved gene arrangement found in most fish species. Phylogenetic relationships, based on the maximum-likelihood method, revealed that the trans-Andean species (found in northwestern South America) clustered into two main sister clades. One clade comprised the trans-Andean species from the Pacific slope, Brycon chagrensis and Chilobrycon deuterodon. The other…
Genes, proteins, chemicals, diseases, species, mutations and cell lines named across the full text — each resolved to its canonical identifier and authoritative record.
Click any figure to enlarge with its caption.
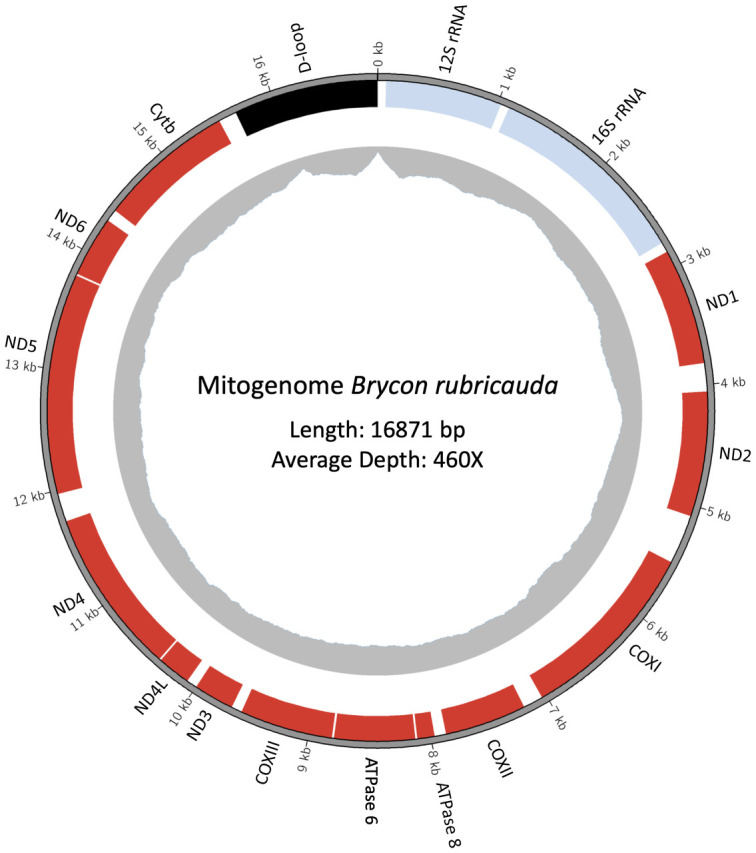 Fig 1
Fig 1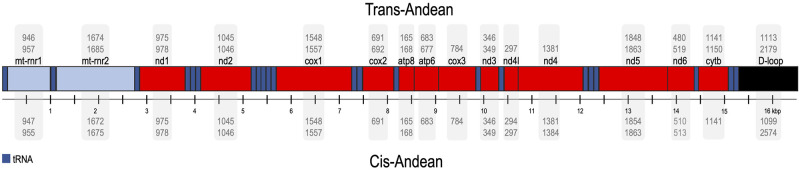 Fig 2
Fig 2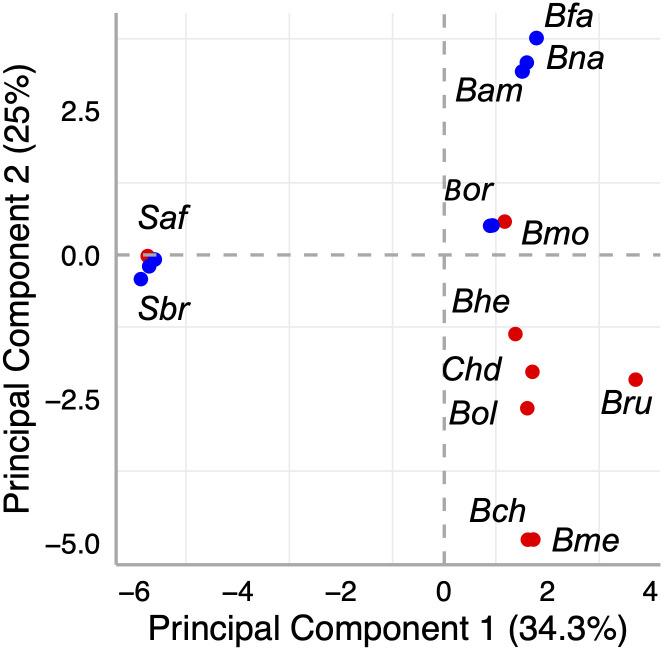 Fig 3
Fig 3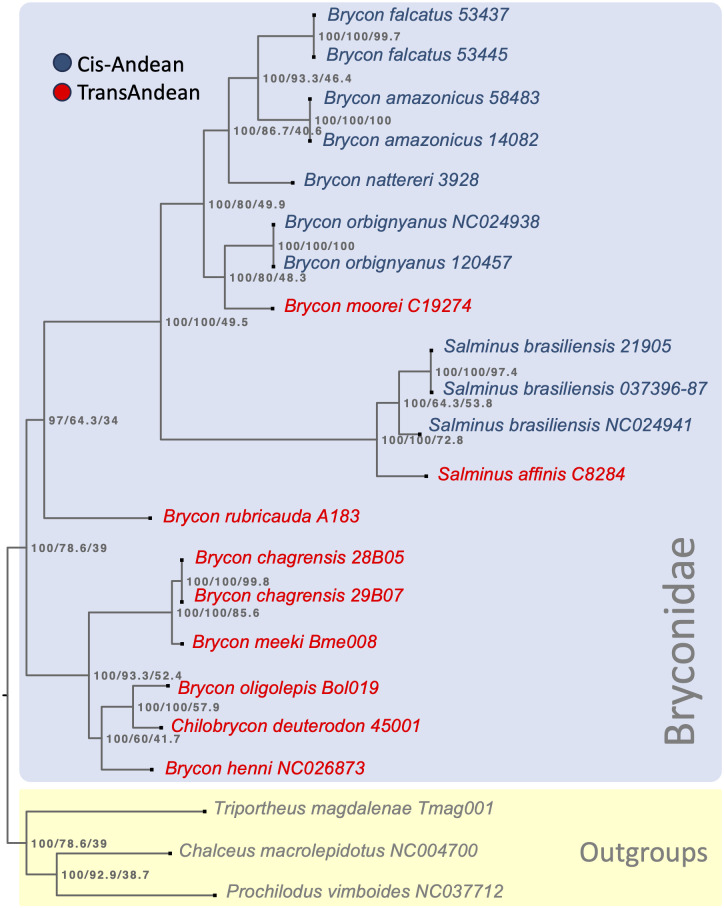 Fig 4
Fig 4- —Empresas Públicas de Medellín and Universidad Nacional de Colombia, Sede Medellín
Peer Reviews
No public reviews on file for this paper yet. If you reviewed it on a platform where reviews are public (OpenReview, ICLR, NeurIPS, ICML), you can paste yours below so the community can read it here.
Videos
No videos yet. Explain this paper in a talk, walkthrough, or lecture? Add one.
Taxonomy
TopicsFish biology, ecology, and behavior · Ichthyology and Marine Biology · Genomics and Phylogenetic Studies
Introduction
Mitochondrial DNA is considered a valuable molecular tool for teleostean fishes genetic diversity studies as well as for addressing interspecific and intraspecific evolutionary relationships due to its rapid evolutionary rate, short coalescence times, high gene diversity, low molecular weight, haploidic condition, and uniparental inheritance [1–5]. The fish mitogenome shows a highly conserved gene array, although some exceptions have been detected [6]. Since the differential evolutionary rate of its genes may reveal different evolutionary histories, compared with the partial sequences of a few mitochondrial genes [5], the fishes mitogenome has been used to solve inter- and intraspecific relationships [7–9], historical biogeography [10], evolutionary origin [11, 12], and comparative mitogenomics [6, 13], among other aplications.
Bryconidae comprises five main clades arranged in four genera Brycon, Chilobrycon, Henochilus, and Salminus [14]. Brycon is non-monophyletic [14] and encompasses 44 valid species distributed from southern Mexico to northern Argentina [15], being also a key economical resource in Central and South America by supporting subsistence and commercial fisheries, sport fishing, and aquaculture [16]. However, unresolved taxonomic problems and highly divergent mitochondrial lineages of Brycon stimulate the search for more informative genes [17]. Chilobrycon and Henochilus are two monotypic genera restricted to the Pacific slope of northern Peru and Ecuador, and eastern Brazil, respectively. Salminus comprises six species with distribution across the main basins of South America: Amazon, Orinoco, Paraná-Paraguay, São Francisco, and Magdalena River basins [18].
Additionally, the controversial phylogenetic relationships within the family and among families of the order Characiformes [19, 20] and taxonomic sampling incompleteness in phylogenetic analysis stimulate the necessity to obtain new information that provides insights into its evolutionary history. Comparative mitogenomics and its evolutionary relationships among Bryconidae remains unexplored so far. Consequently, in line with the idea that a wider sampling of taxa and individuals is required to improve the relationships understanding within Bryconidae, this study provides the complete mitogenome of five species from north-western South America, Brycon meeki Eigenmann & Hildebrand, 1918, Brycon moorei Steindachner, 1878, Brycon oligolepis Regan, 1913, Brycon rubricauda Steindachner, 1879 and Salminus affinis Steindachner, 1880. The four complete mitogenomes already available so far include Brycon orbignyanus (Valenciennes 1850) [21], Brycon henni Eigenmann, 1913 [22], Brycon nattereri Günther 1864 [23], and Salminus brasiliensis (Cuvier 1816) [24]. This study further assembled, by data mining, 10 mitogenomes from other species including Brycon amazonicus (Agassiz, 1829), Brycon chagrensis (Kner 1863), Brycon falcatus Müller & Troschel, 1844, Brycon orbignyanus, Chilobrycon deuterodon Géry & de Rham 1981, and S. brasiliensis.
Material and methods
This study assembled a total of 15 mitogenomes corresponding to 11 species of Bryconidae. For obtaining and sequencing the mitochondrial genome of five species from north-western South America, this study analyzed muscle or caudal fin samples preserved in 95% ethanol from Brycon moorei, B. rubricauda and Salminus affinis, collected in the middle and lower Cauca River by the Universidad de Córdoba and the Universidad de Antioquia. This study also included caudal fin samples preserved in 70% ethanol of B. meeki and B. oligolepis, collected in the Anchicayá River, Pacific slope.
Isolation of total genomic DNA from tissues was performed with the QIAamp DNA Mini Kit (Qiagen), following the manufacturer’s recommendations for muscle tissue. DNA integrity was evaluated by agarose gel electrophoresis, and its concentration was quantified by light absorption at 260nm using the NanoDrop^™^ 2000-Thermo Scientific^™^ and the Picogreen fluorescent method. The Next Generation Sequencing (NGS) for S. affinis and the north-western Brycon species was performed on an Illumina MiSeq instrument reading 300 paired end reads. Whole genome shotgun libraries were prepared with the Illumina Truseq Nano DNA kit. Raw reads were filtered using the CUTADAPT software v2.10 [25], eliminating remaining Truseq adapter sequences, read ends below Q30 quality threshold, and reads with ambiguous bases. Genomic assembly was performed with SPADES assembler v3.14.1 [26], using default parameters. The scaffold containing the mitochondrial genomes was detected using BLASTN [27] and customed database of fish mitochondrial genomes.
The remaining 10 mitochondrial genomes were generated by downloading NGS genomic or transcriptomic data from the Sequence Read Archive (SRA) database, followed by read cleaning and subsequent assembly (see Table 1). The sample listed under the SRA accession SRR10079810 was originally labeled as Brycon falcatus, while the library name was labeled as brycon_amazonicus58483 (https://www.ncbi.nlm.nih.gov/sra/?term=SRR10079810). However, the phylogenomic analysis confirmed its correct taxonomic position as B. amazonicus, as listed in Table 1.
Table 1: List of mitogenomes of Bryconidae included in this study.
The mitochondrial genomes were annotated using the MITO-ANNOTATOR TOOL of the MITOFISH webserver v3.86 (10.1093/molbev/msy074). The synteny of the mitogenomes was assessed using the MAUVE genome aligning and visualization tool [28]. The other new reference mitogenomes were generated by downloading and assembling NGS raw read data, available at the SRA database, as described in Table 1. Read quality filtering, genomic assembly, and mitochondrial genome detection and annotation were performed as described above for the DNA-seq experiments. As for the RNA-seq data of B. falcatus, de novo transcriptome assembly was performed with the Trinity package [29], applying default parameters. NGS reads were mapped against the respective mitogenome scaffold using BOWTIE2, and the average sequencing depth was calculated to assess the sequencing coverage obtained for the newly generated mitochondrial genomes using SAMTOOLS software. The strand asymmetry was determined using the formula AT skew = (A-T)/(A+T) [30].
For comparative and evolutionary analysis purposes, this study included four mitogenomes previously published for the following species: Salminus brasiliensis [24], Brycon orbignyanus [21], B. nattereri [23], and B. henni [22]. As outgroups, this study included the mitogenome of the related species Triportheus magdalenae (Tmagd001; GenBank accession OR168946), which was sequenced and assembled as described above for the other species, Prochilodus vimboides (NC037712), and Chalceus macrolepidotus (NC004700).
A Principal Component Analysis (PCA) was conducted by examining variant features within the genomic annotations of Bryconidae mitogenomes, including gene lengths (CDS, rRNA, tRNA), and D-loop region lengths. A comprehensive table encompassing all genome features exhibiting variations in base pair lengths was imported into the R statistical package, [31] and underwent processing using the scale and prcomp functions. The resulting geometric point graph was generated utilizing ggplot2.
The phylogenetic relationships among Brycon species from northwestern South America and other Bryconidae species were inferred using the maximum likelihood method with the IQTREE2 program. This study constructed a super matrix consisting of 15 mitochondrial genes, including 13 CDSs and two mitochondrial rRNAs. Each gene individually extracted was aligned with its respective homologous loci using MAFFT. Subsequently, the 15 individual alignments were concatenated with the program catsequences (https://github.com/ChrisCreevey/catsequences). IQTREE2 running parameters included the partitions option, treating each individual gene as a partition, the search for the best substitution model for each partition, and 5000 ultra-fast bootstrap (UFB) pseudo replicates. Additionally, this study calculated two concordance factors [32, 33]: gene concordance factor (GCF) and site concordance factor (SCF). The tree visualization and graphical editing were performed in the FIGTREE program v1.4.4 (http://tree.bio.ed.ac.uk/software/figtree/).
Results
The Bryconidae mitogenomes (Figs 1 and 2) showed the same mitochondrial genome structure and gene arrangement, although trnF and the D-loop sequences were not recovered for one of the B. chagrensis mitogenome (29B07). The protein coding gene nad6 and eight tRNAs (trnA, trnC, trnE, trnN, trnP, trnQ, trnS2, trnY) are coded by the N-strand, while the remaining genes, including the D-loop region, are coded by the J-strand (nad1, nad2, cox1, cox2, atp6, atp8, cox3, nad3, nad4l, nad4, nad5, cytb, 14 tRNAs and 2 rRNAs).
Mitochondrial genome of Brycon rubricauda spanning 16,871 base pairs (bp).The outermost gray ring represents the DNA molecule and serves as a kilobases (kb) size scale. Protein-coding sequences (CDS) are highlighted in red boxes, rRNA genes are denoted in light blue, and the D-loop region is marked in black. The innermost gray plot represents the sequencing depth, indicating a median coverage of 460X.
Synteny and structural variation analysis of mitochondrial genomes in the Bryconidae family.The mitochondrial genome structure within the Bryconidae family reveals conserved synteny across all members, accompanied by variations in gene and D-loop region sizes. Coding genes are highlighted in red, ribosomal RNA genes in light blue, transfer RNA genes in dark blue, and the D-loop region in black. Genome feature lengths are presented as ranges from minimum to maximum values. Single values denote genes maintaining consistent lengths across all analyzed species. Feature lengths for Trans-Andean species are located at the top of the Figure while their cis-Andean counterparts are at the bottom.
The median sequencing depth for the 15 mitogenome scaffolds was 134X, with values ranging from 4785X to 23X, for Brycon chagrensis 29B07 and B. meeki, respectively (Table 2). The higher coverage values, both over 4000X, were obtained for the B. chagrensis scaffolds that came from RNA-seq data. The GC content ranged from 41.96% to 44.88% (Median: 43.68%) and the overall AT skews ranged from 0.015 to 0.071 (Median: 0.057).
Table 2: Summarized mitogenomic and assemble characteristics of the 13 Bryconidae species.
In terms of mitochondrial genome sizes (Table 2), the largest were the Salminus mitogenomes (over 17,700 bp; Median: 17,799 bp) compared with the other species (Brycon and Chilobrycon, median mitogenome size: 16,848 bp). The Bryconidae mitogenomes from northwestern South America (Mean: 16894.29; Median: 16,884) were larger than those from southeastern South America (Mean: 16823.57; Median: 16,837; p = 0.011). The B. meeki mitogenome was similar in length to B. chagrensis, followed by B. henni, B. oligolepis, Ch. deuterodon, B. rubricauda and B. moorei (Table 3). Regarding the gene lengths variation (Table 3), Ch. deuterodon showed notable differences with the other Bryconidae mitogenomes in D-loop, mt-rnr2, and nd6, whereas B. moorei showed variation patterns more similar to B. orbignyanus from southeastern South America. In general, the gene length was more similar in mitogenomes of southeastern South America species. The PCA of gene lengths variation showed that the first principal component, which explains 34.3% of the total variation, separates Salminus from Brycon and Chilobyrcon mitogenomes (Fig 3). Additionally, the second principal component, which explains 25% of the total variation, separates trans-Andean from cis-Andean species, except B. moorei and S. affinis that were clustered with cis-Andean species.
Plot of the two first principal components based on the length variations of Coding Sequences (CDSs), ribosomal RNA (rRNA), transfer RNA (tRNA), and the D-loop region of Bryconidae mitogenomes.Cis- and trans-Andean species are denoted in blue and red, respectively. Bam: Brycon amazonicus; Bch: Brycon chagrensis; Bfa: Brycon falcatus; Bhe: Brycon henni; Bme: Brycon meeki; Bmo: Brycon moorei; Bna: Brycon nattereri; Bol: Brycon oligolepis; Bor: Brycon orbignyanus; Bru: Brycon rubricauda; Chd: Chilobrycon deuterodon; Saf: Salminus affinis; Sbr: Salminus brasiliensis.
Table 3: Gene sizes of Dloop, rRNA and tRNA genes in19 mitogenomes of Bryconidae species.
The greatest differences in length among non-protein-coding genes or regions were observed in the D-loop region (Ch. deuterodon: 1113; Brycon: 1,099–1285; Salminus: 2128–2574) even within the same species (S. brasiliensis, B. orbignyanus, and B. amazonicus, Table 3). In contrast, the variations in mt-rnr1 gene (946–992 bp; Median: 953 bp) and mt-rnr2 gene (1,672–1,687 bp; Median 1,675 bp) were stable within the species. Minor differences in lengths (1–4 bp; Table 3) were observed in 15 of 22 tRNAs genes, whereas seven had the same length in all studied species (trnN: 73 bp, trnV: 72 bp, trnI: 72 bp, trnQ: 71 bp, trnS: 71, trnA: 69 bp, trnE: 69 bp).
In the coding protein genes (Table 4), the greatest differences in length were observed in the CDSs of the genes nd6 (480–519 pb), nd5 (1,848–1,863 pb), cytb (1,141 bp, slightly longer with 1,150 bp for B. meeki and B. chagrensis), cox1 (1,557 bp, slightly shorter with 1,548 bp in B. amazonicus, B. henni and B. nattereri), and atp6 (683 bp., slightly shorter with 677 bp for B. moorei). Minor variations were found in the length of the CDSs of the genes nd1 (975 bp, one extra codon is annotated in Brycon nattereri, B. amazonicus, B. falcatus, B. orbignyanus, and B. moorei), atp8 (165 bp, with one extra codon annotated for B. rubricauda, B. nattereri, B. amazonicus, and B. falcatus), nd4l (294–297 bp), nd4 (1384 bp in B. amazonicus and B. falcatus, with one triplet shorter in the other species), nd3 (349 bp in the trans-Andean species, with one triplet shorter in the cis-Andean species), nd2 (1,045–1,046 bp; the partial stop codon is completed by the addition of A residues at the 3’ end of the mRNA, doi:10.1093/gbe/evw195), and cox2 (691–692 bp). Only one of 13 coding protein genes exhibited the same length in all studied species (cox3: 784 bp).
Table 4: Gene sizes of protein coding genes in19 mitogenomes of 13 Bryconidae species.
The phylogenetic relationships based on the 19 mitochondrial genomes of 13 Bryconidae species, 13 concatenated CDSs and two rRNAs, depict the family as a well-supported monophyletic group (100 UFB support, 100 gene concordance factor -GCF, and 43.3 site concordance factor -SCF; Fig 4). Furthermore, two main sister clades can be observed: 1) trans-Andean Brycon (north-western South America) from the Pacific slope + Brycon chagrensis + Chilobrycon; and 2) cis-Andean Brycon + Salminus (eastern South America) + congeners from the Magdalena-Cauca Basin, with UFB support values of 100% and 99%, respectively.
Mitochondrial Genome Evolution in Bryconidae: A Maximum Likelihood Phylogenetic Tree was constructed from the alignment of 13 protein-coding sequences (CDS) and 2 mitochondrial ribosomal RNAs (rRNAs) across 19 mitogenomes of 13 species within the Bryconidae. The tree is rooted using Triportheus magdalenae, Chalceus macrolepidotus, and Prochilodus vimboides as outgroups and is annotated with supports indicated by concordance factors (UFB/gcf/scf), specifically using UFB 5000. Species from the cis-Andean region are color-coded in blue, while those from the trans-Andean region are highlighted in red.
Discussion
This study assembled, compared, and explored the phylogenetic relationships of 15 mitogenomes corresponding to 11 species of Bryconidae. This included the de novo sequencing of mitochondrial genomes for five species from north-western South America, as well as the assembly of 10 mitochondrial genomes from NGS genomic or transcriptomic data obtained from the SRA database. All the expected protein-coding, rRNA, and tRNA genes were annotated in the Bryconidae mitogenomes. However, in B. chagrensis (29B07) it was not possible to detect the D-loop region and a tRNA in the contig assembled from RNA-seq data.
The mitogenome annotation results indicate the same mitochondrial genome structure and synteny among Bryconidae and other Characiformes mitogenomes [21, 22, 24, 34–38]. The overall AT skews (0.015–0.071; Median: 0.057) indicate a greater AT bias compared to that previously observed in Characidae [36–40].
Salminus mitogenomes were the largest followed by Bryconidae from northwestern and southeastern South America. Differences in length are mainly explained by variations among the D-loop regions, which exhibited variations even in mitogenomes from the same species as observed in S. brasiliensis, B. orbignyanus, and B. amazonicus. These D-loop region lengths are also larger than in other fish species that exhibited ranges from 724 to 1,401 nts [37, 41–44]. Differences in the control region length explain variations in mitochondrial genome size in most vertebrates [45–47] and copy number variations have also been found even within the same individuals [42].
The extension of the mt-rnr1 and mt-rnr2 genes showed variations typical of the species. Both genes have been demonstrated to exhibit regions with large variation in length and sequence [44]. An additional variation source was observed in 15 tRNAs and 12 coding protein genes, specially nd6, nd5, cytb, cox1, and atp6. The tRNA size variation has been documented for D-loop, T-loop, V-loop and even D stem [44]. Additionally, high gene length variation levels were also found in nd5, cytb, and cox1 in other fish species, and was attributed to both gene size and gene rearrangement [44]. However, contrasting those results, nd2 in Bryconidae does not show high size variation levels, whereas nd5 and atp6 showed high length variation levels, suggesting that these patterns may be related to the evolutionary trajectories of the taxa. As shown by the PCA, the mitogenomes size variation pattern is highly congruent with their phylogenetic relationships [14, this study] indicating that these differences represent an evolutionary signal. Moreover, the mitogenome size variation pattern showed the closer relationship in the mitogenomes size variation pattern among B. moorei and southeastern South America, which is consistent with their closer phylogenetic relationships.
Since only 19 mitogenomes corresponding to 13 species of Bryconidae were included in our analysis, the phylogenetic relationships found may be influenced by an incomplete sampling. Despite this limitation, the current analysis recovers the phylogenetic relationships previously reported and offers new insights into the origin and diversification of Bryconidae groups. The trans-Andean species from the Pacific slope drainages were grouped, with B. meeki and B. chagrensis as sister species (UFB: 100, GCF: 100; SCF: 85.3), while B. oligolepis was clustered with Chilobrycon (UFB: 100, GCF: 100, SCF 57.6). Brycon henni appears as an ancestral lineage in this last clade, also with 100% UFB support. Previously described phylogenetic relationships of B. chagrensis as the sister clade of Chilobrycon and B. henni [14] indicate that B. chagrensis + B. meeki is also a sister clade of (B. henni + (Chilobrycon + B. oligolepis)).
On the other hand, in the cis-Andean + Magdalena-Cauca Basin (Brycon moorei and Salminus affinis) clade, the remaining eight species were clustered, displaying 100% UFB support, with 100% and 49.5% concordance factors for genes and sites, respectively. It is noteworthy that B. rubricauda was positioned as the basal lineage of the cis-Andean clade. Furthermore, two main lineages were formed within this clade: one encompasses the Salminus species (UFB 100, GCF 100, SCF 72.8), and the other comprises the species B. orbignyanus, B. moorei, B. nattereri, B. falcatus, and B. amazonicus (with UFB 100, GCF 80.0, SCF 49.9).
Furthermore, B. moorei was found to be clustered with B. orbignyanus (UFB: 100, GCF: 80; SCF: 48), and S. affinis was grouped with S. brasiliensis (UFB: 100, GCF: 100; SCF: 72.9). This agrees with previous report based on cytb and cox1 [14], according to which B. moorei is phylogenetically related to the cis-Andean congeners closely related to Salminus. Several other authors have also previously proposed the close relationships among Brycon and Salminus [14, 20, 48–51]. Despite this close phylogenetic relationship, Salminus can be unequivocally recognized using alternatively morphological [18] and molecular characters [14, 52, this study].
This mitochondrial phylogenomic analysis supports the monophyly of Bryconidae and Salminus. However, as reported by other authors, current members of Brycon are split in separated lineages [14, 49]. Interestingly, members from Pacific slopes drainages are more closely related to the monotypic Chilobrycon than the remaining congeners, corroborating the need to revise the taxonomy of trans-Andean Brycon. A plausible alternative would be to expand the current concept of Chilobrycon to include B. chagrensis, B. henni, B. meeki and B. oligolepis, but this action requires a further comprehensive taxonomic and morphological revision.
Based on the similar topology with a previous study [14], one general hypothesis that can be drawn based on this mitochondrial phylogenomic analysis is that the diversification of the ancestor of Bryconidae originated in north-western South America, followed by vicariant events that isolated the Pacific clade, which subsequently invaded Central America. The hypothesis suggesting a potential invasion of Central America by Bryconidae, as previously proposed [14], aligns well with the notion of a stepwise colonization of Hyphessobrycon from the Pacific slope of northwestern South America to middle America [53]. This reinforces the need for continued investigation and exploration to refine the historical biogeography and evolutionary dynamics understanding within the Bryconidae family.
The expansion of Bryconidae in South America was proposed by Abe et al. (2014) [14] based on the hypothesis of López-Fernández and Alberts (2011) [54] according to which substantial marine regressions in the Oligocene, akin to earlier periods, revealed extensive interior floodplains, a scenario that is believed to have expedited the rapid expansion of freshwater habitats. The common ancestor of the clade that includes B. rubricauda, Salminus, and the remaining Brycon species suggests that the expansion occurred from northwestern towards the eastern and southern South America. This hypothetical scenario should be examined in future biogeographic studies using mitochondrial and nuclear markers with a wider taxonomic and geographic representation.
In conclusion, prior to this study, only four mitogenomes were available for 52 Bryconidae species. This study, in addition to shedding new light on mitogenomic characteristics and evolutionary trajectories among Bryconidae fishes and providing a valuable resource for environmental DNA applications, molecular ecology, and phylogenetics, provided 15 additional mitogenomes, for a total of 19 mitogenomes corresponding to 13 species. Despite the latter, the inclusion of further mitogenomes and the examination of multiple nuclear loci within this family are imperative for a holistic understanding of their diversity and evolutionary panorama.
The reference list from the paper itself. Each links out to its DOI / PubMed record.
- 1Birky CW Jr. Transmission genetics of mitochondria and chloroplasts. Annu Rev Genet. 1978; 12(1):471–512. doi: 10.1146/annurev.ge.12.120178.002351 371532 · doi ↗ · pubmed ↗
- 2Harrison RG. Animal mitochondrial DNA as a genetic marker in population and evolutionary biology. Trends Ecol Evol. 1989; 4(1): 6–11. doi: 10.1016/0169-5347(89)90006-2 21227301 · doi ↗ · pubmed ↗
- 3Curole J, Kocher T. Mitogenomics: digging deeper with complete mitochondrial genomes. Trends Ecol Evol. 1999; 14:394–8. doi: 10.1016/s 0169-5347(99)01660-2 10481201 · doi ↗ · pubmed ↗
- 4Springer MS, Amrine HM, Burk A, Stanhope MJ. Additional support for Afrotheria and Paenungulata, the performance of mitochondrial versus nuclear genes, and the impact of data partitions with heterogeneous base composition. Syst Biol. 1999; 48(1):65–75. doi: 10.1080/106351599260445 12078646 · doi ↗ · pubmed ↗
- 5Miya M, Nishida M. The mitogenomic contributions to molecular phylogenetics and evolution of fishes: a 15-year retrospect. Ichthyol Res. 2015; 62(1):29–71. doi: 10.1007/s 10228-014-0440-9 · doi ↗
- 6Inoue JG, Miya M, Tsukamoto K, Nishida M. Basal actinopterygian relationships: a mitogenomic perspective on the phylogeny of the “ancient fish”. Mol Phylogenet Evol. 2003; 26:110–20.12470943 10.1016/s 1055-7903(02)00331-7 · doi ↗ · pubmed ↗
- 7Mabuchi K, Senou H, Suzuki ANT, Nishida DM. Discovery of an ancient lineage of Cyprinus carpio from Lake Biwa, central Japan, based on mt DNA sequence data, with reference to possible multiple origins of koi. J. Fish Biol. 2005; 66:1516–28. doi: 10.1111/j.1095-8649.2005.00676.x · doi ↗
- 8Minegishi Y, Aoyama J, Inoue JG, Miya M, Nishida M, Tsukamoto K. Molecular phylogeny and evolution of the freshwater eels genus Anguilla based on the whole mitochondrial genome sequences. Mol Phylogenet Evol. 2005; 34(1):134–46. doi: 10.1016/j.ympev.2004.09.003 15579387 · doi ↗ · pubmed ↗