Transcriptomics integrated with metabolomics reveals partial molecular mechanisms of nutritional risk and neurodevelopment in children with congenital heart disease
Minglei Gao, Yang Shen, Ping Yang, Chang Yuan, Yanan Sun, Zipu Li

TL;DR
This study combines gene and metabolite analysis to uncover molecular links between nutrition and brain development in children with heart defects.
Contribution
Integration of transcriptomics and metabolomics reveals novel genes and pathways linked to nutritional risk and neurodevelopment in CHD children.
Findings
Genes like NSUN7, SLC6A8, CXCL1, and LCN8 are associated with neurodevelopment in CHD children.
Tryptophan and glycerophospholipid metabolism are linked to neurodevelopment and nutritional risk.
DEGs and DEMs were identified across three CHD groups, revealing distinct molecular patterns.
Abstract
To explore molecular mechanisms affecting nutritional risk and neurodevelopment in children with congenital heart disease (CHD) by combining transcriptome and metabolome analysis. A total of 26 blood and serum samples from 3 groups of children with CHD low nutritional risk combined with normal neurodevelopment (group A), low nutritional risk combined with neurodevelopmental disorders (group B) and high nutritional risk combined with normal neurodevelopment (group C) were analyzed by transcriptome and metabolomics to search for differentially expressed genes (DEGs) and metabolites (DEMs). Functional analysis was conducted for DEGs and DEMs. Further, the joint pathway analysis and correlation analysis of DEGs and DEMs were performed. A total of 362 and 1,351 DEGs were detected in group B and C compared to A, respectively. A total of 6 and 7 DEMs were detected in group B and C compared…
Genes, proteins, chemicals, diseases, species, mutations and cell lines named across the full text — each resolved to its canonical identifier and authoritative record.
Click any figure to enlarge with its caption.
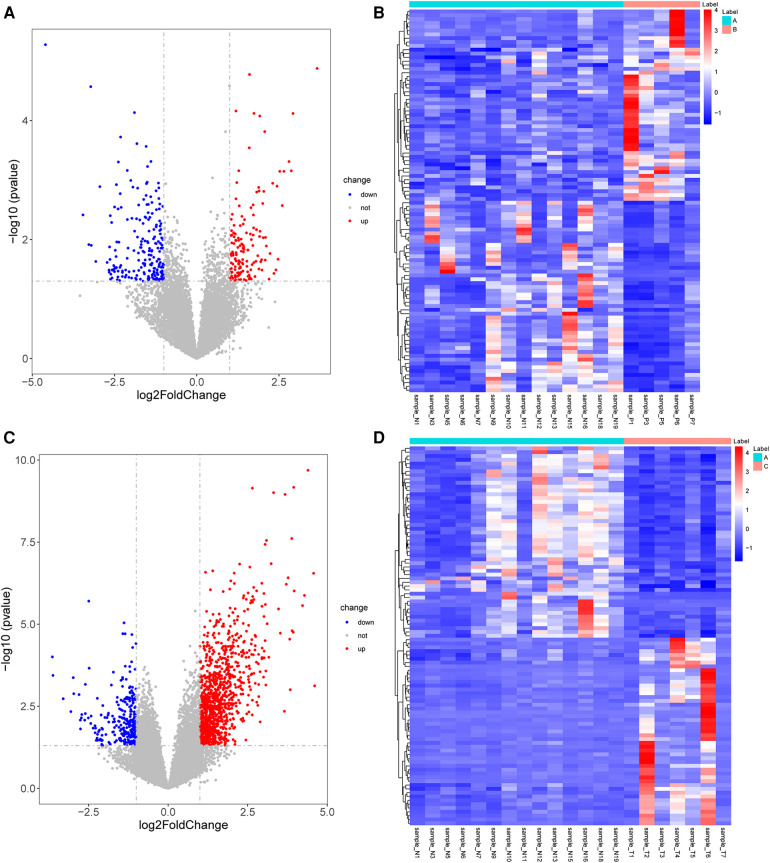 Figure 1
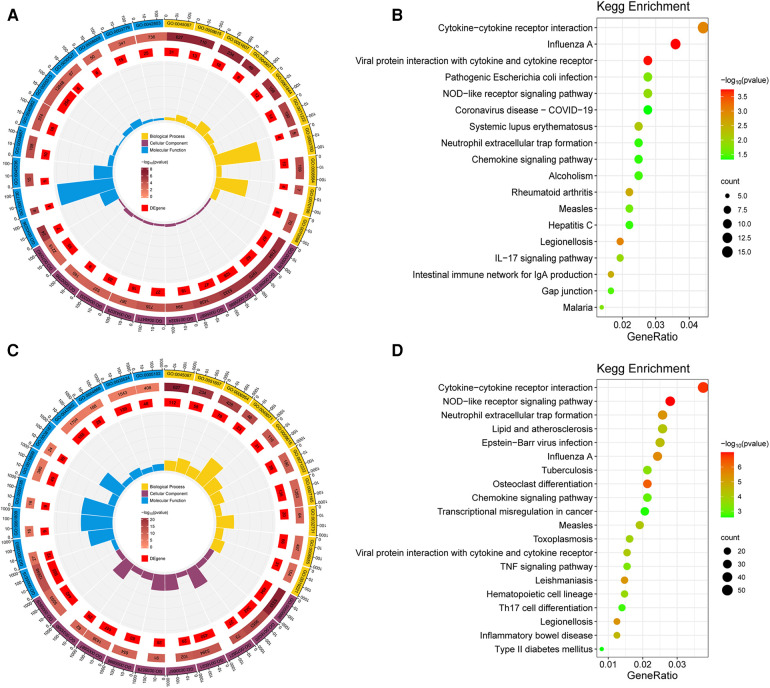 Figure 2
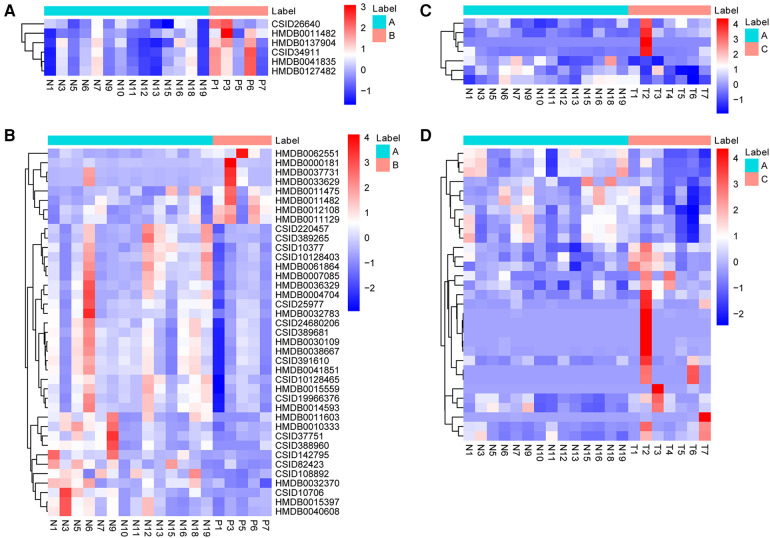 Figure 3
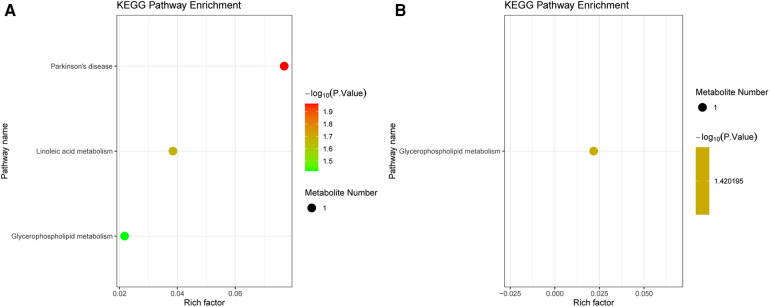 Figure 4
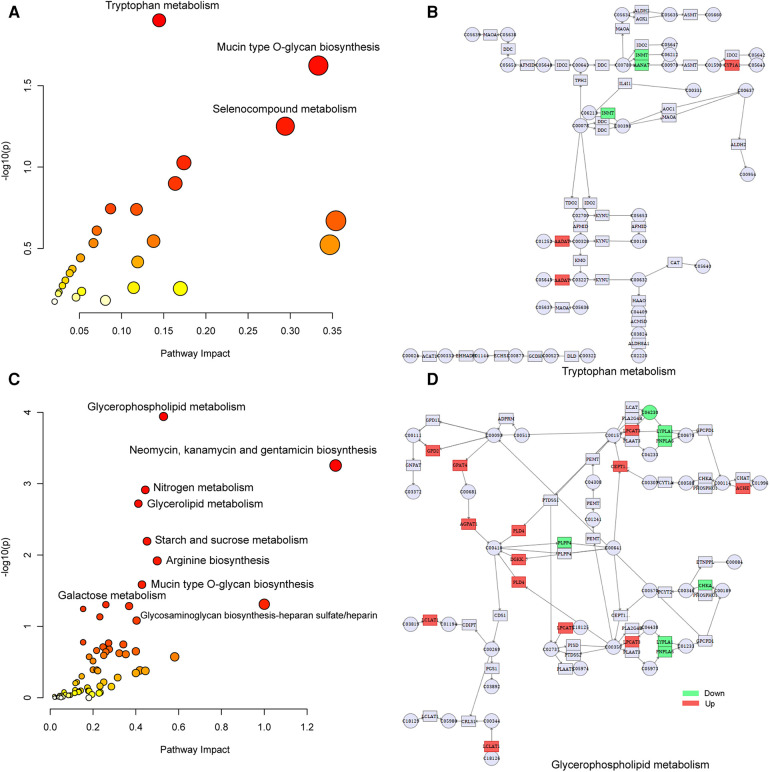 Figure 5
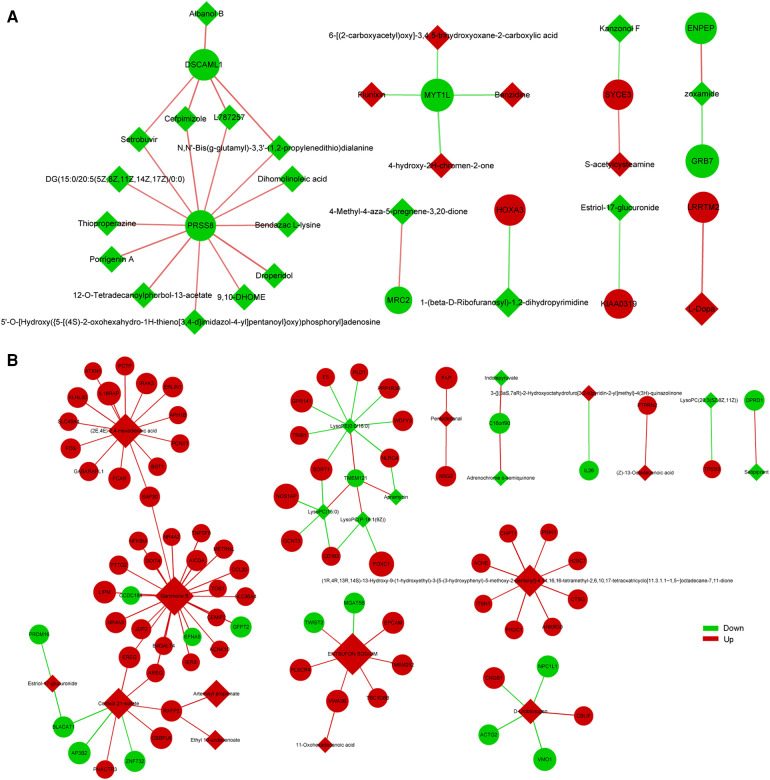 Figure 6
| Gene | log2foldchange | Regulation | |
|---|---|---|---|
| XKR3 | 3.660188629 | 1.34 × 10−05 | Up |
| NSUN7 | 1.605486283 | 1.69 × 10−05 | Up |
| TNFRSF12A | 1.192398703 | 6.92 × 10−05 | Up |
| VSIG4 | 1.740256735 | 7.59 × 10−05 | Up |
| RXFP2 | 2.926853126 | 7.62 × 10−05 | Up |
| CXCL1 | 1.915904565 | 8.39 × 10−05 | Up |
| KIAA0319 | 2.066134462 | 0.000153784 | Up |
| FAM118A | 1.597664361 | 0.000288011 | Up |
| H2BC17 | 2.805629365 | 0.000489592 | Up |
| SPACA6 | 1.279218851 | 0.000699556 | Up |
| LCN8 | −4.599140337 | 5.32 × 10−06 | Down |
| RAP1GAP | −3.222966552 | 2.70 × 10−05 | Down |
| SLC6A8 | −1.89378474 | 7.36 × 10−05 | Down |
| TUBB2A | −2.316078348 | 0.000189687 | Down |
| SLC4A1 | −1.818465674 | 0.000244753 | Down |
| AQP1 | −1.537989591 | 0.000272528 | Down |
| AGRN | −1.391133482 | 0.000488191 | Down |
| SPTB | −2.383261022 | 0.00049809 | Down |
| DMTN | −1.495462112 | 0.000593119 | Down |
| MX1 | −2.111932078 | 0.000692207 | Down |
| Gene | log2foldchange | Regulation | |
|---|---|---|---|
| SLC1A3 | 4.39683 | 2.06 × 10⁻¹⁰ | Up |
| IL18R1 | 3.94469 | 6.79 × 10⁻¹⁰ | Up |
| FKBP5 | 2.64747 | 7.20 × 10⁻¹⁰ | Up |
| PFKFB2 | 3.31390 | 9.84 × 10⁻¹⁰ | Up |
| ECHDC3 | 3.67517 | 1.12 × 10−09 | Up |
| IL1R2 | 3.88479 | 2.46 × 10−08 | Up |
| SOCS3 | 3.09022 | 2.81 × 10−08 | Up |
| SIPA1L2 | 3.04663 | 3.70 × 10−08 | Up |
| IL18RAP | 3.23829 | 1.43 × 10−07 | Up |
| FPR2 | 2.24746 | 1.47 × 10−07 | Up |
| KCNG1 | −2.49326 | 1.99 × 10−06 | Down |
| IL32 | −1.38511 | 9.10 × 10−06 | Down |
| C2orf92 | −1.42335 | 1.95 × 10−05 | Down |
| RTN4R | −1.35111 | 1.96 × 10−05 | Down |
| NAA80 | −1.13880 | 2.07 × 10−05 | Down |
| BCAS4 | −1.00919 | 3.88 × 10−05 | Down |
| NPIPB15 | −1.11527 | 5.12 × 10−05 | Down |
| LCN8 | −3.63616 | 9.89 × 10−05 | Down |
| LYPD3 | −1.14690 | 0.000139592 | Down |
| SPATC1l | −1.34686 | 0.000190124 | Down |
| ID | Metabolites | Mass-to-charge ratio | Retention time (min) | VIP value | Fold change | Regulation | ||
|---|---|---|---|---|---|---|---|---|
| B vs. A | HMDB0011482 | LysoPE[0:0/20:1 (11Z)] | 508.339 | 9.83 | 1.1446 | 1.732 | 0.0361307 | Up |
| CSID34911 | Flunixin | 297.082 | 9.84 | 1.2712 | 1.546 | 0.0319379 | Up | |
| HMDB0041835 | Benzidine | 223.063 | 9.83 | 1.4013 | 1.497 | 0.0461483 | Up | |
| HMDB0137904 | 4-hydroxy-2H-chromen-2-one | 163.038 | 7.14 | 1.6213 | 1.430 | 0.0317435 | Up | |
| HMDB0127482 | 6-[(2-carboxyacetyl)oxy]-3,4,5-trihydroxyoxane-2-carboxylic acid | 281.050 | 9.83 | 1.1966 | 1.409 | 0.0469276 | Up | |
| CSID26640 | S-acetylcysteamine | 239.088 | 13.43 | 1.4357 | 1.319 | 0.0128131 | Up | |
| C vs. A | HMDB0029581 | (2E,4E)-2,4-Hexadienoic acid | 135.043 | 1.13 | 1.4834 | 142.146 | 0.0458151 | Up |
| CSID2298569 | J4CLF34O60 | 633.254 | 7.80 | 1.0549 | 2.752 | 0.0394431 | Up | |
| HMDB0005065 | Oleoylcarnitine | 426.357 | 9.87 | 4.1512 | 1.512 | 0.0094583 | Up | |
| CSID391217 | 3-{[(3aS,7aR)-2-Hydroxyoctahydrofuro[3,2-b]pyridin-2-yl]methyl}-4 (3H)-quinazolinone | 603.292 | 10.47 | 1.0548 | 1.389 | 0.0471863 | Up | |
| HMDB0010408 | LysoPC[P-18:1 (9Z)] | 506.363 | 11.43 | 1.2934 | 0.725 | 0.0270095 | Down | |
| HMDB0010393 | LysoPC[20:3 (5Z,8Z,11Z)] | 546.355 | 10.11 | 3.5653 | 0.656 | 0.0468882 | Down | |
| HMDB0010581 | PG[16:0/22:4 (7Z,10Z,13Z,16Z)] | 799.548 | 13.44 | 2.3672 | 0.608 | 0.0351869 | Down |
| ID | Metabolites | Mass-to-charge ratio | Retention time (min) | VIP value | Fold change | Regulation | ||
|---|---|---|---|---|---|---|---|---|
| B vs. A | HMDB0000181 | L-Dopa | 178.050 | 4.13 | 3.0002 | 10.822 | 0.0264023 | Up |
| HMDB0062551 | 4-ethylphenylsulfate | 201.021 | 5.64 | 1.6227 | 5.595 | 0.0105276 | Up | |
| HMDB0037731 | S-(2-Furanylmethyl) methanethioate | 187.007 | 4.77 | 6.6878 | 4.175 | 0.0375045 | Up | |
| HMDB0033629 | xi-4-Hydroxy-4-methyl-2-cyclohexen-1-one | 107.049 | 4.77 | 1.6498 | 3.775 | 0.0389009 | Up | |
| HMDB0012108 | LysoPC(17:0) | 554.346 | 10.58 | 4.5436 | 1.675 | 0.0414659 | Up | |
| HMDB0011482 | LysoPE[0:0/20:1 (11Z)] | 552.330 | 9.81 | 2.4413 | 1.529 | 0.0225322 | Up | |
| HMDB0011129 | LysoPE(0:0/18:0) | 526.314 | 9.46 | 4.7880 | 1.523 | 0.0378447 | Up | |
| HMDB0011475 | LysoPE[0:0/18:1 (11Z)] | 478.293 | 9.24 | 2.0505 | 1.393 | 0.0497672 | Up | |
| CSID108892 | zoxamide | 669.036 | 12.80 | 1.0700 | 0.783 | 0.0302921 | Down | |
| CSID10128465 | 6alpha-Fluorotestosterone acetate | 393.213 | 13.58 | 2.1775 | 0.735 | 0.0408695 | Down | |
| HMDB0032370 | L-Menthyl (R,S)-3-hydroxybutyrate | 241.180 | 12.56 | 1.1991 | 0.731 | 0.0022804 | Down | |
| HMDB0015559 | Thioproperazine | 427.163 | 13.59 | 3.9359 | 0.721 | 0.0338609 | Down | |
| HMDB0030109 | Albanol B | 557.120 | 13.60 | 1.7918 | 0.703 | 0.0442844 | Down | |
| CSID19966376 | Bendazac L-lysine | 409.190 | 13.59 | 4.9536 | 0.676 | 0.0273167 | Down | |
| CSID10377 | Benzoyl-y-tropeine | 489.277 | 13.51 | 2.4271 | 0.674 | 0.0219379 | Down | |
| HMDB0038667 | N,N'-Bis(g-glutamyl)-3,3'-(1,2-propylenedithio)dialanine | 539.148 | 13.60 | 2.2162 | 0.673 | 0.0327456 | Down | |
| CSID389681 | 5'-O-[Hydroxy({5-[(4S)-2-oxohexahydro-1H-thieno[3,4-d]imidazol-4-yl]pentanoyl}oxy)phosphoryl]adenosine | 554.123 | 13.60 | 2.0477 | 0.671 | 0.0389264 | Down | |
| HMDB0014593 | Droperidol | 424.165 | 13.59 | 4.5164 | 0.663 | 0.0221951 | Down | |
| CSID24680206 | Setrobuvir | 559.117 | 13.60 | 1.3963 | 0.659 | 0.0416337 | Down | |
| CSID391610 | L787257 | 687.079 | 13.60 | 1.3611 | 0.652 | 0.0374926 | Down | |
| HMDB0041851 | Cefpimizole | 669.106 | 13.60 | 1.2637 | 0.617 | 0.0282558 | Down | |
| CSID25977 | 12-O-Tetradecanoylphorbol-13-acetate | 661.399 | 13.52 | 4.6158 | 0.602 | 0.0403694 | Down | |
| HMDB0036329 | Homocapsaicin | 364.210 | 13.49 | 2.2724 | 0.571 | 0.0192239 | Down | |
| CSID220457 | acetate2?,3?-(difluoromethylene)-5?-androstan-17?-ol | 347.220 | 13.49 | 7.6807 | 0.570 | 0.0373371 | Down | |
| HMDB0004704 | 9,10-DHOME | 627.450 | 13.51 | 3.1355 | 0.524 | 0.0394049 | Down | |
| HMDB0010333 | Estriol-17-glucuronide | 445.190 | 5.49 | 1.8111 | 0.514 | 0.0252590 | Down | |
| HMDB0061864 | Dihomolinoleic acid | 279.234 | 13.50 | 24.7971 | 0.486 | 0.0214515 | Down | |
| HMDB0032783 | Porrigenin A | 895.634 | 13.51 | 3.6606 | 0.485 | 0.0384935 | Down | |
| CSID10128403 | 4-Methyl-4-aza-5-pregnene-3,20-dione | 328.225 | 13.49 | 1.4316 | 0.485 | 0.0248330 | Down | |
| HMDB0007085 | DG[15:0/20:5 (5Z,8Z,11Z,14Z,17Z)/0:0] | 581.455 | 13.49 | 5.6945 | 0.476 | 0.0343696 | Down | |
| HMDB0015397 | Sunitinib | 397.205 | 7.15 | 4.0719 | 0.444 | 0.0399618 | Down | |
| CSID389265 | N-benzoyl-D-arginine-4-nitroanilide | 379.157 | 13.50 | 4.1639 | 0.391 | 0.0460232 | Down | |
| CSID37751 | triafungin | 443.174 | 5.60 | 1.3673 | 0.350 | 0.0080564 | Down | |
| HMDB0040608 | Kanzonol F | 465.192 | 7.15 | 1.1935 | 0.337 | 0.0272227 | Down | |
| CSID142795 | momilactone A | 627.375 | 7.28 | 1.9674 | 0.306 | 0.0030993 | Down | |
| CSID10706 | Tineafax | 429.194 | 5.93 | 1.4772 | 0.253 | 0.0126354 | Down | |
| CSID82423 | Roxatidine | 611.380 | 8.27 | 1.0168 | 0.246 | 0.0050683 | Down | |
| CSID388960 | 1-(beta-D-Ribofuranosyl)-1,2-dihydropyrimidine | 427.179 | 5.96 | 1.2803 | 0.224 | 0.0022988 | Down | |
| HMDB0011603 | 4-(Methylnitrosamino)-1-(3-pyridyl)-1-butanone | 413.199 | 5.68 | 1.0836 | 0.210 | 0.0244314 | Down | |
| C vs. A | CSID2338563 | CLONIXIN LYSINE | 453.158 | 6.45 | 2.8602 | 0.0410226 | Up | |
| HMDB0013636 | Pyrroloquinoline quinone | 329.000 | 6.67 | 5.4404 | 0.0188619 | Up | ||
| CSID142662 | Furosemide sodium | 396.987 | 6.67 | 2.1791 | 61302.968 | 0.0367756 | Up | |
| CSID17021 | ENTSUFON SODIUM | 423.184 | 7.64 | 5.6277 | 949.957 | 0.0178690 | Up | |
| HMDB0029510 | Garcinone B | 439.142 | 5.34 | 1.7964 | 453.719 | 0.0084223 | Up | |
| CSID389476 | (1R,4R,13R,14S)-13-Hydroxy-9-(1-hydroxyethyl)-3-[5-(3-hydroxyphenyl)-5-methoxy-2-pentanyl]-4,14,16,16-tetramethyl-2,6,10,17-tetraoxatricyclo[11.3.1.1∼1,5∼]octadecane-7,11-dione | 591.318 | 8.39 | 1.1143 | 79.163 | 0.0124371 | Up | |
| HMDB0062779 | Cortisol 21-sulfate | 441.158 | 4.79 | 1.3637 | 61.756 | 0.0201343 | Up | |
| HMDB0041554 | Artemisyl propionate | 255.160 | 8.00 | 1.4197 | 25.256 | 0.0387194 | Up | |
| HMDB0004158 | D-Urobilinogen | 589.302 | 5.72 | 2.0553 | 13.969 | 0.0285637 | Up | |
| HMDB0034286 | Ethyl 10-undecenoate | 257.175 | 8.41 | 1.0486 | 3.665 | 0.0465114 | Up | |
| CSID29271896 | Liafensine | 411.183 | 6.66 | 1.9145 | 3.126 | 0.0471294 | Up | |
| CSID4939099 | PYRANTEL (+)-TARTRATE SALT | 355.098 | 1.26 | 1.0240 | 3.048 | 0.0300985 | Up | |
| HMDB0039340 | Ichangin 4-glucoside | 631.241 | 7.80 | 1.9204 | 2.374 | 0.0176500 | Up | |
| HMDB0010333 | Estriol-17-glucuronide | 445.189 | 5.28 | 1.1167 | 2.054 | 0.0073601 | Up | |
| CSID390381 | Bruceoside A | 663.230 | 8.20 | 1.1202 | 1.905 | 0.0185666 | Up | |
| HMDB0041480 | (Z)-13-Octadecenoic acid | 281.248 | 9.82 | 1.0403 | 1.467 | 0.0125231 | Up | |
| HMDB0010333 | Estriol-17-glucuronide | 445.190 | 5.49 | 1.2568 | 1.456 | 0.0439706 | Up | |
| HMDB0031078 | Pentadecanal | 271.228 | 10.03 | 1.0618 | 1.456 | 0.0098243 | Up | |
| HMDB0030978 | 11-Oxohexadecanoic acid | 269.212 | 11.11 | 1.2436 | 1.350 | 0.0019975 | Up | |
| HMDB0112190 | 12-Hydroxyhexadecanoic acid | 271.227 | 12.37 | 1.3358 | 1.209 | 0.0186780 | Up | |
| HMDB0031039 | Heptadecanal | 299.259 | 11.34 | 1.8027 | 1.129 | 0.0321475 | Up | |
| HMDB0011473 | LysoPE(0:0/16:0) | 452.278 | 10.01 | 3.3141 | 0.762 | 0.0398565 | Down | |
| HMDB0012883 | Adrenochrome o-semiquinone | 180.067 | 1.16 | 2.3428 | 0.756 | 0.0327723 | Down | |
| HMDB0010381 | LysoPC(15:0) | 480.308 | 11.09 | 1.0645 | 0.744 | 0.0239564 | Down | |
| HMDB0011473 | LysoPE(0:0/16:0) | 452.277 | 9.79 | 1.1885 | 0.743 | 0.0450400 | Down | |
| HMDB0010393 | LysoPC[20:3 (5Z,8Z,11Z)] | 590.346 | 9.92 | 1.4171 | 0.715 | 0.0152067 | Down | |
| HMDB0011475 | LysoPE[0:0/18:1 (11Z)] | 478.293 | 9.24 | 1.2834 | 0.712 | 0.0375563 | Down | |
| HMDB0060484 | Indolepyruvate | 248.054 | 1.16 | 1.2608 | 0.699 | 0.0036761 | Down | |
| CSID2339128 | Apramycin | 520.265 | 10.01 | 1.2542 | 0.686 | 0.0172288 | Down | |
| HMDB0010393 | LysoPC[20:3 (5Z,8Z,11Z)] | 590.347 | 10.10 | 4.6386 | 0.658 | 0.0028978 | Down | |
| CSID29738718 | Setipiprant | 383.122 | 1.16 | 1.1363 | 0.494 | 0.0211778 | Down |
- —Natural Science Foundation of Liaoning Province
Peer Reviews
No public reviews on file for this paper yet. If you reviewed it on a platform where reviews are public (OpenReview, ICLR, NeurIPS, ICML), you can paste yours below so the community can read it here.
Videos
No videos yet. Explain this paper in a talk, walkthrough, or lecture? Add one.
Taxonomy
TopicsCongenital Heart Disease Studies · Congenital heart defects research · Birth, Development, and Health
Introduction
1
Congenital heart disease (CHD) is a congenital heart malformation caused by abnormal development of fetal heart and large blood vessels, and is the most common heart disease in children (1, 2). CHD is the most common birth defect, and prevalence of CHD in live born infants is 1%–1.2% (1, 3). Due to the variety, complexity and difficulty in treating CHD, its mortality is on the rise in China (4). CHD increases the risk of neurodevelopmental disorders, including cognitive, motor, social adjustment, and behavior disorders (5–7). Neurodevelopmental delays may reduce the lifespan of children with CHD and cause cognitive or intellectual impairment (8). This not only increase the risk of worse prognosis, but also has serious impact on the entire life, including academic performance, employment opportunities, psychological and overall quality of life (8, 9). Hence, it is essential to explore the molecular mechanism of neurodevelopment in children with CHD and the interventions targeted at the early stage of the development to improve the quality of life. Growth failure is also a common problem in children with CHD (10, 11). The etiology and pathological mechanism of slow physical and mental development in infants with CHD remain unclear, but there are many risk factors associated with it, including severity of cyanosis, chronic hypoxia, hemodynamic changes, repeated infections and heart failure, repeated hospitalization, and feeding disorders (11, 12). Nutrition, parents’ education level, living environment, social and family environment, living style and economic level will also affect the physical and intellectual development of children with CHD (11, 13). Perioperative young children required more caloric and nutrient intake to promote adequate growth and psychomotor development, and energy and protein deficiencies can increase infections and inflammatory responses, impair wound healing, prolong hospital stays, and may increase the incidence of postoperative complications (14, 15). Therefore, optimal nutrition is crucial to improve the short- and long-term prognosis of children with CHD.
Omics analysis techniques are increasingly used to identify potential biomarkers and elucidate causes and mechanisms associated with disease (16, 17). Metabolomics can analysis small molecule metabolites to reflect the biological metabolic characteristics of disease states and is used extensively in biomarker discovery (18). Dong S et al. analyzed the heart's metabolic remodeling to hypoxia using metabolomics and found protein synthesis and aerobic energy production were reduced in patients with cyanotic CHD and NAD may play an important role in response to hypoxia (19). Jin N et al. found S-Adenosyl methionine, guanine and N-terminal pro-brain natriuretic peptide could be used as biomarkers for pulmonary arterial hypertension associated with CHD from CHD (20). Transcriptome research can study gene function and gene structure at the whole level and reveal the molecular mechanism of specific biological processes and disease occurrence (21). Liu G et al. identified genes and enriched pathways associated with radiotherapy in nasopharyngeal carcinoma, revealing the molecular mechanism of radiotherapy resistance, which is helpful for future research on radiotherapy resistance function (22). The combined transcriptomics and metabolomic analysis of high-risk neuroblastoma and low and intermediate-risk neuroblastoma identified 4 aberrant pathways and developed a risk classification diagnostic model, providing insights for high-risk neuroblastoma early diagnosis (23). Therefore, transcriptomics and metabolomics play an important role in diagnosis of diseases, and their molecular mechanisms can be deeply explored.
In this study, transcriptomic and metabolomic analysis of blood and serum samples from 26 children with CHD was performed to search for key DEGs and DEMs, and explore molecular mechanisms affecting nutritional risk and neurodevelopment in children with CHD.
Methods and materials
2
Sample collection
2.1
A total of 26 blood and serum samples were collected from hospitalized children with CHD in the Dalian Children's Hospital. Blood samples (2 ml/sample) were used for transcriptomic analysis and serum samples (1 ml/sample) were used for metabolomics analysis. Main inclusion criteria: (1) confirmed diagnosis of CHD; (2) aged 0–24 months; (3) written informed consent was obtained from child's guardians. Main exclusion criteria: (1) children with nutritional impairments due to major non-cardiac diseases; (2) multiple pregnancy; (3) chromosomal abnormality; (4) structural brain malformation; (5) placental dysfunction; (6) intrauterine growth retardation of the fetus; (7) received the prescribed nutrition supply and blood transfusion half a month before hospitalization. Blood and serum samples were collected 24 h before discharge from the hospital (or after surgery). The children with CHD were divided into three groups according to the nutritional risk and neurodevelopmental status: low nutritional risk combined with normal neurodevelopment (n = 14, group A), low nutritional risk combined with neurodevelopmental disorders (n = 5, group B), high nutritional risk combined with normal neurodevelopment (n = 7, group C). The screen tool for risk on nutritional status and growth (STRONGkids) was used for nutritional risk screening and nutritional assessment of hospitalized children over 1 month. The Revised Gesell Developmental Schedules were used to assess the neurodevelopmental status of CHD children aged 6 months to 24 months. This study was approved by the Ethics Committee of Dalian Children's Hospital (19015).
Transcriptomics detection through RNA-Sequencing (RNA-Seq) analysis
2.2
Total RNA was extracted from the samples with TRIzol. Sequencing By Synthesis (SBS) technology was used to sequence the cDNA library using Illumina's high-throughput sequencing platform. The raw data obtained by sequencing were converted into FASTQ format sequence data by base calling. The raw data was analyzed using a bioinformatic workflow, which includes quality control with MultiQC, adapter and quality trimming with Cutadapt, transcript quantification with featureCounts (GRCh38.primary_assembly.genome.fa). Differential expression analysis was performed using the DESeq2 in R package (4.0.5) (p value < 0.05 and |log_2_foldchange| > 1). The Gene Ontology (GO) and Kyoto Encyclopedia of Genes and Genomes (KEGG) function enrichment analysis of differentially expressed genes (DEGs) were performed using the David database (https://david.ncifcrf.gov/tools.jsp).
Non-targeted metabolomics analysis via liquid chromatograph with tandem mass spectrometer (Lc–Ms/Ms)
2.3
The 300 μl acetonitrile was added to 100 μl serum at 4℃. After 20 min of centrifugation at 12,000 r/min (4℃), 100 μl supernatant was carefully extracted. Take 50 μl as quality control (QC) samples. All of the extracts were analyzed using LC–MS/MS technology with a high performance liquid chromatography (HPLC) and a high resolution mass spectrometer (HRMS). The chromatographic separation was performed on a Waters HSS T3 column. Metabolomics data were collected as follows: a column temperature of 45°C and the flow rate of 0.3 ml/min. mobile phase: A = 0.1% formic acid water, B = 0.1% formic acid acetonitrile. Mass spectrometry (MS) negative and positive mode conditions: sheath gas flow rates 30 arb, atomization pressure 50 psi. capillary voltage: positive mode 5,500 V, negative mode −4,500 V. Based on the MS detection, the original files were imported into Progenesis QI (Waters) software for data pre-processing and identification, and then the data quality control analysis was carried out to ensure the accuracy and reliability of the data. Multivariate statistical analysis was performed on the data to reveal the differences of metabolites of different components, the biological significance of metabolites was discovered through functional analysis. Orthogonal partial least squares discrimination analysis (OPLS-DA) was used to filter signals that are not relevant to classification. Potential metabolites were analyzed according to predicted value (VIP) and significance of variables in Student's t-test. VIP > 1 and *p *< 0.05 were considered as statistically significant. Differentially expressed metabolites (DEMs) were selected using KEGG (https://www.genome.jp/kegg/) and human metabolome database (HMDB) (https://hmdb.ca/), and further annotated in the KEGG com-pound database. The annotated metabolic pathways were classified according to the KEGG pathway database (https://www.kegg.jp/kegg/pathway.html).
Joint analysis of the metabolomics and transcriptomics
2.4
Combined pathway analysis of DEMs and DEGs were performed using MetaboAnalyst 6.0 (https://www.metaboanalyst.ca/). The cor.test function in R software was used to calculate Pearson correlation coefficient to construct the correlation analysis between the above metabolites and genes.
Results
3
Transcriptome sequencing analysis and identification of DEGs
3.1
To explore the correlation between nutritional risk and neurodevelopment in children with CHD, we performed transcriptomic analysis of the three groups. Principal component analysis (PCA) was used to test the reliability of the experiment and the rationality of sample selection. Pearson correlation coefficient, R^2 ^> 0.8 was considered as good repeatability sample. As shown in Supplementary Figure S1, samples within the group have good repeatability, and samples between the groups have large differences. Sample N14 was significantly different from other samples, so it was excluded in the subsequent analysis.
A total of 362 DEGs were screened in group B compared to A, of which 145 up-regulated genes and 217 down-regulated genes were detected (Figures 1A,B). The top 20 up-regulated and down-regulated genes in group B compared to A are shown in Table 1. A total of 1,351 DEGs were screened in group C compared to A, of which 1,079 up-regulated genes and 272 down-regulated genes were detected (Figures 1C,D). The top 20 up-regulated and down-regulated genes in group C compared to A are shown in Table 2.
Identification of DEGs. (A) The volcano plot shows DEGs between group B and A. (B) The heatmap shows DEGs between group B and A. (C) The volcano plot shows DEGs between group C and A. (D) The heatmap shows DEGs between group C and A. DEGs, differentially expressed genes.
GO analysis and KEGG pathway analysis
3.2
GO and KEGG enrichment analysis of the obtained DEGs was performed to analyze the key functions and metabolic pathways (Figure 2; Supplementary Table S1). The top three significantly enriched terms were innate immune response, response to virus and defense response to virus in biological processes in group B compared with group A. The top three significantly enriched terms were extracellular region, extracellular space and plasma membrane in cellular component in group B compared with group A. The top three significantly enriched terms were laminin binding, oligoadenylate synthetase activity and CXCR chemokine receptor binding in molecular function in group B compared with group A (Figure 2A). The top three significantly enriched terms were innate immune response, defense response to virus and inflammatory response in biological processes in group C compared with group A. The top three significantly enriched terms were plasma membrane, membrane and tertiary granule membrane in group C compared with group A. The top three significantly enriched terms were protein binding, NAD^+^ nucleosidase activity and NAD^+^ nucleotidase, cyclic ADP-ribose generating in molecular function in group C compared with group A (Figure 2C). KEGG analysis found that the top three altered pathways were influenza A, viral protein interaction with cytokine and cytokine receptor and cytokine-cytokine receptor interaction in group B compared with group A (Figure 2B), and the top three altered pathways were NOD-like receptor signaling pathway, cytokine-cytokine receptor interaction and osteoclast differentiation in group C compared with group A (Figure 2D). In summary, compared with group A, the key functions of both groups B and C are significantly enriched innate immune response and defense response to virus and plasma membrane, and the significant enrichment pathway is cytokine-cytokine receptor interaction.Metabolomics analysis and identification of DEMs.
Go and KEGG analysis of DEGs. (A) GO analysis of biological processes, cellular components and molecular functions of DEGs between group B and A. (B) Pathway enrichment of the DEGs between group B and A. (C) GO analysis between group C and A. (D) Pathway enrichment of the DEGs between group C and A. The dot color represents the p-value and the dot size represents the number of DEGs. DEGs, differentially expressed genes.
Correlation analysis of the QC samples showed that R^2^ values were greater than 0.8 (Supplementary Figures 2A,B), indicating that the entire analysis process was stable and reproducible. OPLS-DA was performed to screen the reliable metabolites that lead to the classification difference. The results showed that the metabolites of the two groups with low nutritional risk combined with neurodevelopmental disorders and high nutritional risk combined with normal neurodevelopment were significantly different from those of the healthy control group in both positive and negative modes (Supplementary Figures 2C–F).
Metabolites with VIP > 1 and *p *< 0.05 in QC samples were selected as DEMs. In positive mode, 6 DEMs were identified in group B compared to A, all of which were up-regulated metabolites (Figure 3A; Table 3). A total of 39 metabolites changed significantly in negative mode in group B compared to A, including 8 up-regulated and 31 down-regulated metabolites (Figure 3B; Table 4). Similarly, compared with A, we found a total of 7 DEMs in positive mode in group C, 4 of which were up-regulated and 3 down-regulated (Figure 3C; Table 3). In negative mode, 31 DEMs were identified in group C compared to A, including 21 up-regulated and 10 down-regulated metabolites (Figure 3D; Table 4).
Identification of DEMs. (A) The heatmap shows DEMs in positive mode between group B and A. (B) The heatmap shows DEMs in negative mode between group B and A. (C) The heatmap shows DEMs in positive mode between group C and A. (D) The heatmap shows DEMs in negative mode between group C and A. DEMs, differentially expressed metabolites.
KEGG pathway analysis of DEMs
3.3
The DEMs were subjected to KEGG-enrichment analysis, and enriched pathways with significant differences were identified. The enriched metabolic pathways were Parkinson's disease, linoleic and metabolism and glycerophospholipid metabolism in group B compared to A (Figure 4A). The enriched metabolic pathway was glycerophospholipid metabolism in group C compared to A (Figure 4B). Compared with group A, the common enrichment metabolic pathway of group B and C was glycerophospholipid metabolism. Correlation analyses between transcriptomics and metabolomics.
KEGG analysis in metabolomics. (A) Pathway enrichment of the DEMs between group B and A. (B) Pathway enrichment of the DEMs between group C and A. The dot color represents the p-value and the dot size represents the number of DEMs. DEMs, differentially expressed metabolites.
To explore the factors affecting nutritional risk and neurodevelopment in children with CHD by linking important metabolites and genes through shared metabolic pathways, joint pathway analysis between DEGs and DEMs were performed. The pathways are shown in Figures 5A,B, which includes tryptophan metabolism and mucin type O-glycan biosynthesis in group B compared to A. Nine significantly altered pathways were revealed in group C compared to A, include glycerophospholipid metabolism, neomycin, kanamycin and gentamicin biosynthesis, nitrogen metabolism, glycerolipid metabolism, starch and sucrose metabolism, arginine biosynthesis, mucin type O-glycan biosynthesis, glycosaminoglycan biosynthesis-heparan sulfate/heparin and galactose metabolism (Figures 5C,D). Correlation analysis utilized Pearson calculation to show the correlation of the DEMs and DEGs. Figure 6 showed strong correlations among transcripts and metabolites.
Joint-pathway analysis of DEGs and DEMs. (A) Joint-pathway analysis of DEGs and DEMs between group B and A. (B) Tryptophan metabolism pathway. (C) Joint-pathway analysis of DEGs and DEMs between group C and A. (D) Glycerophospholipid metabolism pathway. DEGs, differentially expressed genes; DEMs, differentially expressed metabolites.
Correlation analysis of DEGs and DEMs between group B and A (A), group C and A (B) the quadrangle indicates metabolites, and the nodes indicate genes.
Discussion
4
In this study, we divided children with CHD into three groups based on nutritional risk and neurodevelopment, and integrated transcriptomics and metabolomics data to explore molecular mechanisms affecting nutritional risk and neurodevelopment in children with CHD. We found that NSUN7, SLC6A8, CXCL1 and LCN8 were significantly different in groups B compared to A, and SLC1A3 and LCN8 were significantly different in groups C compared to A. NSUN7, a m^5^C RNA methyltransferase gene, is differentially expressed in Alzheimer's disease patients (24). Solute carrier (SLC) are a group of membrane transport proteins that facilitate the transport of various substrates across biofilms (25). SLC6A8 could modulate human creatine levels and suppress colon cancer progression (26). Previous studies have shown that SLC6A8 can be up-regulated by p65/NF-κB transcription and mediate intracellular creatine accumulation in hypoxia (27). Creatine deficiency may be manifested as intellectual and behavioral disorders (28), so we suspect that SLC6A8 is related to neurodevelopment in children with CHD. SLC1A3 is an aspartate/glutamate transporter that maintains electron transport chain and tricarboxylic acid cycle activity (29). Studies have also shown that SLC1A3 may affect glucose metabolism by activating the PI3 K/AKT signaling pathway to provide energy for cell proliferation (30), which also seems to confirm its correlation with nutritional risk. Besides, SLC1A3 was also related to the development of stress and depression (31). CXCL1 was expressed in nervous systems and involved in the development of inflammation and pain (32). LCN8, a member of the liposome protein family, was found to be associated with the severity of post-traumatic stress disorder symptoms by genome-wide DNA methylation analysis (33). Therefore, we deduced that NSUN7, CXCL1, SLC6A8 and LCN8 may be involved in the neurodevelopment in children with CHD, SLC1A3 and LCN8 may be involved in the nutritional risk. We also found that cytokine receptor interaction was found to be the most altered pathway in both two groups compared to the control group. Cytokines play an important regulatory role in various processes, including immune function, inflammation, hematopoiesis, cell growth and differentiation (34). Cytokine receptor interaction provides a new perspective to explore the molecular mechanism affecting nutritional risk and neurodevelopment in children with CHD.
Metabolomics analysis found the levels of Albanol B, dihomo-linoleic acid, lysophosphatidylethanolamine (LysoPE) and lysophosphatidylcholine (LysoPC) were significantly altered in group B compared to A, and phospholipids and amino acids were significantly altered in group C compared to A. Albanol B, a compound isolated in root bark, could be involved in Anti-Alzheimer's disease (35). Dihomo-linoleic acid could drive ferroptosis-mediated neurodegeneration (36). LysoPE and LysoPC are lysophospholipids, a type of phospholipid. Lysophospholipids are involved in many physiological processes, including regulating neuropathic pain, disorders of neuroectodermal development, and disorders of neuroectodermal development (37, 38). Lipids are closely related to Alzheimer's disease (39, 40). Several key pathways were identified in group B compared to A (neurodevelopment disorder enriched comparison), including Parkinson's disease, linoleic acid metabolism and glycerophospholipid metabolism. Glycerophospholipid metabolism is also a critical pathway in group C compared to A. Linoleic acid is essential for optimal growth and brain development in infants and can regulate key neurodevelopmental processes (41). Studies have shown that cancer patients will suffer from malnutrition, and the increase of nutritional risk will increase the content of linoleic acid in fecal supernatant, indicating that linoleic acid is a biomarker of high nutritional risk (42). Linoleic acid can synthesize polyunsaturated fatty acids required by human brain cells, which is conducive to promoting brain development and plays a certain role in promoting the development of children's intelligence (41). This is consistent with our study that the linoleic acid metabolic pathway is associated with neurodevelopment in children with CHD. A basic study has demonstrated that dysregulation of glycerophospholipid and sphingolipid metabolism may have a negative impact on neurodevelopment in offspring, while lipid changes may disturb phospholipid homeostasis, altering membrane integrity, orientation, permeability, and function, leading to neurological dysfunction and degeneration (43). Choline is the main component of synthetic phospholipids, phosphatidylcholine and sphingomyelin, and plays an important role in neurogenesis and neural migration during fetal development (44). Gut microbiota plays an important role in the onset of depression, and metabolomics analysis showed that significant differences in glycerophospholipids and fatty acids metabolism between depressed mice and normal mice (45). Phospholipid metabolism plays an important role in energy metabolism throughout the body, and phospholipid synthesis is essential for normal development and health (46). It can be concluded that linoleic acid metabolism and glycerophospholipid metabolism may be involved in the nutritional risk and neurodevelopment of children with CHD.
In joint analysis, glycerophospholipid metabolism was found to be a key pathway in group C compared to A (nutritional risk enriched comparison), which was consistent with metabolomic results. In the network diagram of glycerophospholipid metabolism, the expression of GPD2 and AChE were up-regulation in group C compared to A, which was consistent with transcriptomic results. GPD2, a glycerol 3-phosphate dehydrogenase, was a component of the glycerol phosphate shuttle process that promotes glucose oxidation, the production of acetyl coenzyme A, the acetylation of histones, and the induction of genes encoding inflammatory mediators (47). AChE is a serine protease that hydrolyzes the neurotransmitter acetylcholine into acetate and choline, thus terminating neurotransmission (48). Tryptophan metabolism was found to be a key pathway in group B compared to A (neurodevelopment disorder enriched comparison). Tryptophan can be involved in the pathophysiology of different neuropsychiatric diseases through the serotonin pathway to produce serotonin as a neurotransmitter and melatonin as a neuromodulator (49). Tryptophan metabolism is directly or indirectly regulated by intestinal microorganisms, and its metabolites have immune, metabolic and neuroregulatory functions, which has become a therapeutic target for various diseases (50). Tryptophan metabolism pathways are also associated with symptoms and neurodevelopment in children with autism spectrum disorders (51), which was consistent with our results.
In summary, the content of metabolites and gene expression in blood and serum samples were analyzed to explore molecular mechanisms affecting nutritional risk and neurodevelopment in children with CHD. We further identified NSUN7, SLC6A8, CXCL1 and LCN8 as possible molecular markers associated with neurodevelopment and SLC1A3 and LCN8 were associated with nutritional risk. Linoleic acid metabolism, glycerophospholipid metabolism and tryptophan metabolism pathways were associated with neurodevelopment and glycerophospholipid metabolism pathway was associated with nutritional risk in children with CHD. By integration of metabolomics and transcriptomics data, our study provided the molecular basis for nutritional risk and neurodevelopment in children with CHD that could provide reference for clinical decision-making for individualized nutrition supply and demand in Chinese patients with CHD. This study also lays the groundwork for validation studies in longitudinal assessments of neurodevelopmental outcomes and preclinical investigations of therapeutic interventions targeting the identified molecular pathways. These findings need to be validated in large numbers of patients in the future and additional biological validation of the particular molecular processes in in vitro or in vivo investigations is necessary.
The reference list from the paper itself. Each links out to its DOI / PubMed record.
- 1Diab NS Barish S Dong W Zhao S Allington G Yu X Molecular genetics and Complex inheritance of congenital heart disease. Genes (Basel). (2021) 12(7):1020. 10.3390/genes 1207102034209044 PMC 8307500 · doi ↗ · pubmed ↗
- 2Stiller B Grundmann SHöhn R Kari FA Berger F Baumgartner H. Adults with congenital heart disease—a new, expanding group of patients. Dtsch Arztebl Int. (2023) 120(12):195–202. 10.3238/arztebl.m 2023.000636727545 PMC 10264649 · doi ↗ · pubmed ↗
- 3Pierpont ME Brueckner M Chung WK Garg V Lacro RV Mc Guire AL Genetic basis for congenital heart disease: revisited: a scientific statement from the American Heart Association. Circulation. (2018) 138(21):e 653–711. 10.1161/cir.000000000000060630571578 PMC 6555769 · doi ↗ · pubmed ↗
- 4Su Z Zou Z Hay SI Liu Y Li S Chen H Global, regional, and national time trends in mortality for congenital heart disease, 1990–2019: an age-period-cohort analysis for the global burden of disease 2019 study. E Clinical Medicine. (2022) 43:101249. 10.1016/j.eclinm.2021.10124935059612 PMC 8760503 · doi ↗ · pubmed ↗
- 5Nattel SN Adrianzen L Kessler EC Andelfinger G Dehaes MCôté-Corriveau G Congenital heart disease and neurodevelopment: clinical manifestations, genetics, mechanisms, and implications. Can J Cardiol. (2017) 33(12):1543–55. 10.1016/j.cjca.2017.09.02029173597 · doi ↗ · pubmed ↗
- 6Homsy J Zaidi S Shen Y Ware JS Samocha KE Karczewski KJ de novo mutations in congenital heart disease with neurodevelopmental and other congenital anomalies. Science. (2015) 350(6265):1262–6. 10.1126/science.aac 939626785492 PMC 4890146 · doi ↗ · pubmed ↗
- 7Stephen J Maddirevula S Nampoothiri S Burke JD Herzog M Shukla A Bi-allelic Tmem 94 truncating variants are associated with neurodevelopmental delay, congenital heart defects, and distinct facial dysmorphism. Am J Hum Genet. (2018) 103(6):948–67. 10.1016/j.ajhg.2018.11.00130526868 PMC 6288279 · doi ↗ · pubmed ↗
- 8Verrall CE Patel S Travitz L Tchieu J Dale RC Kasparian NA Biological and structural phenotypes associated with neurodevelopmental outcomes in congenital heart disease. Transl Pediatr. (2023) 12(4):768–86. 10.21037/tp-22-68737181016 PMC 10167385 · doi ↗ · pubmed ↗