Exploring social activity patterns among community-dwelling older adults in South Korea: a latent class analysis
Jiyoung Shin, Hun Kang, Seongmi Choi, JiYeon Choi

TL;DR
This study identifies different social activity patterns among older adults in South Korea and finds that those with minimal social engagement are more likely to experience depressive symptoms.
Contribution
The study introduces a novel application of latent class analysis to identify distinct social activity patterns and their mental health implications in older adults.
Findings
Four distinct social activity patterns were identified, with the 'minimal in both digital and in-person' group showing significantly higher depressive symptoms.
Younger age, living in multi-generational households, and higher digital literacy were associated with more active social engagement patterns.
Interventions targeting digital literacy and physical activity may help reduce depressive symptoms by increasing social engagement.
Abstract
With the trend of digitalization, social activities among the older population are becoming more diverse as they increasingly adopt technology-based alternatives. To gain a comprehensive understanding of social activities, this study aimed to identify the patterns of digital and in-person social activities among community-dwelling older adults in South Korea, examine the associated factors, and explore the difference in depressive symptoms by the identified latent social activity patterns. Data were extracted from a nationwide survey conducted with 1,016 community-dwelling older adults (mean age 68.0 ± 6.5 years, 47.8% male). The main variables assessed were digital social activities (eight items), in-person social activities (six items), and depressive symptoms (20 items). Data were analyzed using latent class analysis, multinomial logistic regression, and multiple linear regression.…
Genes, proteins, chemicals, diseases, species, mutations and cell lines named across the full text — each resolved to its canonical identifier and authoritative record.
Click any figure to enlarge with its caption.
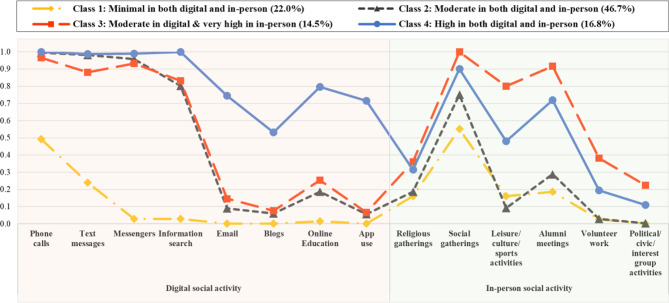 Figure 1
- —Ministry of Education, South Korea
Peer Reviews
No public reviews on file for this paper yet. If you reviewed it on a platform where reviews are public (OpenReview, ICLR, NeurIPS, ICML), you can paste yours below so the community can read it here.
Videos
No videos yet. Explain this paper in a talk, walkthrough, or lecture? Add one.
Taxonomy
TopicsMedieval and Early Modern Iberia · Medieval Iberian Studies · Historical Art and Architecture Studies
Background
With increasing digitalization, social activities among the older population are becoming diverse. More older adults increasingly adopt technology-based alternatives [1]. Notably, older adults in South Korea show high rates of smartphone usage (90%) [1] and internet usage rate (98%), surpassing those of other developed countries such as Japan, Sweden, and the Netherlands [1, 2]. Current social activities now encompass digital interactions including social media use [3], complementing in-person social interactions [4]. Therefore, to gain a deeper understanding of social activities among older individuals in our rapidly digitizing society, it is crucial to explore both traditional, predominantly in-person social activities and digital-based remote interactions.
Studies have consistently demonstrated that engaging in social activities can help prevent and alleviate depressive symptoms in older adults [5–11]. In a large cohort study in the United States, perceived social activity level was identified as the social determinant most strongly associated with depression among older adults [12]. Additionally, social participation, including social connections, informal social participation, and volunteering, has been linked to promoting healthy aging and reducing depressive symptoms in older adults [13]. However, the direction and strength of the association between social activity and depression may vary depending on the types of social activity [12].
While previous studies have mainly focused on exploring the effect of each social activity on depression individually [14–17], only a few studies classified social activities and compared the characteristics based on patterns of social activities [18, 19]. Since we tend to engage in social activities in a complex manner rather than exclusively choosing one, we need to consider the possibility that their individual effects may offset each other [15]. Considering all, it is valuable to examine the factors associated with social activities to gain specific and personalized insights into modifiable interventions.
Furthermore, despite the increasing digitalization, most previous studies investigating the relationship between social activities and depressive symptoms have primarily focused on either digital or in-person modes of social activities [5–8, 10]. To gain a comprehensive understanding of how older adults participate in various social activities, including both digital and in-person activities, it is essential to explore the combined engagement in these diverse forms of social activities. This is particularly important within the context of an aging population in a rapidly digitalizing world. Therefore, this study aimed to (1) identify the patterns of digital and in-person social activities among community-dwelling older adults in South Korea, (2) identify the associated factors, and (3) explore the difference in depressive symptoms by the identified latent social activity patterns.
Methods
Data source and sample
Data were extracted from a nationwide cross-sectional survey conducted to understand the digital literacy status and associated factors among community-dwelling older adults in South Korea [20]. The survey was conducted from October to November 2022, using proportional stratified sampling based on region, sex, and age groups to match South Korea’s registered population in June 2022. Participants who met the following criteria were selected: (1) aged 60 or older, (2) achieved a minimum score of 22 on the Korean version of the Mini-Mental State Examination (2nd edition) [21], and (3) proficient in the Korean language. A total of 1,016 older adults participated and provided information on their sociodemographic characteristics, health status, health behavior, social activities, and social support.
Ethics approval and consent to participate
This study was reviewed and approved by the Institutional Review Board of Yonsei University (ref no.: 4-2023-0983). Participants provided informed consent before the survey and received gift vouchers worth 10,000 Korean won as compensation upon completing survey.
Measures
Social activities
Social activities encompassed both traditional in-person social activities and digital social activities. In-person social activities were evaluated via questions adapted from the Korea Longitudinal Study of Ageing (KLoSA) [22]. Participants were asked regarding the frequency of their involvement in various activities over the past year, such as religious gatherings, social gatherings, leisure/culture/sports activities, alumni meetings, volunteer work, political/civic/interest group activities, and others. Responses that indicated “not at all” were recoded as non-participation (0), while other responses were categorized as participation (1) for six social activities, which excluded the “others” category.
To assess digital social activities—which included phone calls, text messages, messengers, information search, e-mails, blogs, online education, and app use—, participants were asked regarding the purpose of their digital device use which included desktops and laptops, mobile phones, tablets, e-books, and wearable devices. Options included phone calls, text messages, messengers, information search, e-mail, blogs, online education, other, or not using digital devices. Variables for digital social activities were coded as participation (1) or non-participation (0) for each activity, which excluded the “other” and “not using digital devices.”
Depressive symptoms
The frequency and severity of depressive symptoms were measured via the Center for Epidemiological Studies-Depression (CES-D) scale which consists of 20 items [23]. We used the integrated Korean version of the CES-D developed by Jeon et al. [24]. Participants rated their experience of depressive symptoms over the past week on a 0–3 scale for each item, which ranged from “rarely or never (< 1 day)” to “most or all of the time (5–7 days).” After four positively worded items were reverse-coded, we aggregated the scores. The total scores ranged between 0 and 60, and higher scores indicated more severe depressive symptoms [23]. We also categorized respondents as either at risk for clinical depression or not, using the most widely recommended threshold (≥ 16) [25]. The original CES-D and Korean version had Cronbach’s alphas of 0.85 and 0.91, respectively [23, 24]. In our sample, the Cronbach’s alpha was 0.89.
Variables associated with social activity
Socio-demographic factors
Based on previous studies [19, 26–29], participants’ sociodemographic factors included age, sex, educational level, living arrangements, region, and economic activities. Age was recorded in years, and sex was coded as male (1) or female (0). Educational levels were categorized as below middle school (0), below high school (1), below college (2), and college or higher (3). Living arrangements were categorized as living alone (0), with a spouse (1), or in a multigenerational household (2). Region was divided into metropolitan areas (1), which included Seoul, Incheon, and Gyeonggi provinces, and non-metropolitan areas (0), which included cities and provinces outside the metropolitan area. Economic activities were coded as “Yes” (2) when currently engaged in income-generating work, “Used to” (1) when previously employed but not currently, and “Never” (0) when there has been no lifetime work experience.
Health factors
Variables that may be associated with social activity were selected based on previous studies [27–30]. Health status variables included diagnosed disabilities, chronic diseases, functional status, and health-related quality of life. Participants indicated whether they had been diagnosed with a disability (1) or not (0). To assess older adults’ objective health status, participants reported whether they had been diagnosed with a chronic condition that lasted over three months [31]. The number of chronic diseases was categorized as 0, 1, and 2 or more.
Functional status was assessed using the Korean Activities of Daily Living (K-ADL) and Korean Instrumental Activities of Daily Living (K-IADL). The K-ADL and K-IADL consist of seven items (dressing, washing face and hands, bathing, eating, transfer, toileting, and continence) and 10 items (decorating, housework, preparing meals, laundry, going out for a short distance, using transportation, shopping, handling money, using the telephone, and taking medicine), respectively [32]. Participants answered each item based on the extent to which they required assistance. The Cronbach’s alpha values for the K-ADL and K-IADL at the time of development were 0.94 [33] and 0.94 [34], respectively. In our sample, the Cronbach’s alpha values were 0.75 and 0.78, respectively. For analysis, we categorized the number of items that required assistance into three groups: 0, 1, and 2 or more.
Health-related quality of life was assessed via the 12-item Short-Form Health Survey (SF-12), a concise version of the 36-item Short-Form Health Survey [35], version 2 (SF-12v2). The SF-12 measures eight health domains: physical functioning, role-physical, bodily pain, general health, vitality, social functioning, role-emotional, and mental health. The scores for each domain contributed to the Physical Component Summary (PCS) and Mental Component Summary (MCS) scores. Scores for the PCS (six items) and MCS (six items) were calculated and standardized based on published algorithms for the SF-12v2 [35]. On a range of 0–100, higher scores indicated a higher quality of life. In the original version of the SF-12, the Cronbach’s alpha values for PCS and MCS were 0.89 and 0.86 for the United States and 0.76 and 0.77 for the United Kingdom, respectively [35]. In our sample, the Cronbach’s alpha values were 0.81 for PCS and 0.72 for MCS.
Health behaviors included smoking, alcohol consumption, and physical activity. Based on their smoking status, participants were categorized as non-smoker (0), ex-smoker (1), or current smoker (2). Regarding alcohol consumption, participants answered by specifying whether they had consumed alcohol at least once during the past year (1) or not (0). Physical activity was assessed based on whether participants engaged in continuous physical activity for 10 min or more (1) or not (0).
Social factors
Digital literacy and social support were chosen as potential social factors associated with social activity, based on prior findings [5]. Digital literacy was assessed via the Everyday Digital Literacy Questionnaire (EDLQ) developed from the survey of our data source. The EDLQ was created with reference to the European Commission’s Digital Competence (DigComp) framework and consists of three domains: information and communication (nine items), content creation and management (four items), and safety and security (nine items) [20]. Participants responded to each item on a 5-point Likert scale that ranged from 1 (not at all) to 5 (very much so). Higher scores indicated higher levels of digital literacy. The EDLQ exhibited a high level of reliability with a Cronbach’s alpha value of 0.98 [20].
Social support was assessed via the Multidimensional Scale for Perceived Social Support (MSPSS), which evaluated perceived social support from family, friends, and significant others on 12 items [36]. The original instrument was structured with a 7-point Likert scale, which ranged from 1 (very strongly disagree) to 7 (very strongly agree) [36]. For this present study, we opted to use the Korean translated version, which employed a 5-point Likert scale that ranged from “strongly disagree” to “strongly agree” [37], in consideration of both the translated version we referenced and our participants’ characteristics. A higher mean score indicated a greater level of perceived social support. The Cronbach’s alpha values were 0.88, 0.89, and 0.94 for the original version, Korean translated version, and our sample, respectively.
Data analysis
Latent Class Analysis (LCA) is a person-centered modeling approach that relies on the response patterns of observed variables to identify latent subpopulations within a sample [38]. This approach can be particularly valuable to identify multiple subgroups within a sample that share common characteristics and could benefit from similar interventions [38]. We employed a LCA to identify patterns of social activity among community-dwelling older adults, using six in-person activities and eight digital social activities as indicator variables for social activities. The sample size was considered adequate, aligning with the recommendations of numerous prior studies that suggested the inclusion of 300 or more participants [39].
Model fit was assessed via three information criteria: Bayesian Information Criterion (BIC), Akaike Information Criterion (AIC), and Sample-Size Adjusted Bayesian Information Criterion (SSABIC). Lower values indicated a better fit [38]. To determine how accurately the model defined the classes, we employed entropy [40]. An entropy value of 0.8 or higher was recommended as an acceptable threshold, with values closer to 1 considered ideal [41]. Class solutions were evaluated via three relative fit indices: Lo-Mendell-Rubin Likelihood Ratio Test (LMR-LRT), Adjusted Lo-Mendell-Rubin Likelihood Ratio Test (Adj. LMR-LRT), and Bootstrapped Likelihood Ratio Test (BLRT). These indices assessed whether a model with k classes significantly improved the fit compared with a model with k-1 classes [42]. If the improvement was not statistically significant (p > .05), the model with k-1 classes was selected [42].
Next, variables associated with social activities were introduced as auxiliary variables to minimize classification errors among classes, which resulted in the creation of the most probable class variables [43]. After then, we identified variables that differentiated the classes via a multinomial logistic regression model. We estimated the odds ratio (OR) for the likelihood of belonging to a specific class membership compared with the reference group, along with their corresponding 95% confidence intervals (CI). Additionally, we conducted an analysis of variance (ANOVA) to compare depressive symptoms among classes derived from LCA. Finally, we examined the association between depressive symptoms and social activity classes using multiple linear regression. In our analysis, we controlled for covariates known to influence depressive symptoms in older adults, as identified in previous reviews [44–48]. The LCA and multinomial logistic regression were conducted using Mplus 8.8 (Muthén & Muthén) [43] and subsequent analyses were performed using IBM SPSS Statistics for Windows version 26.0 (IBM Corp., Armonk, NY, USA).
Results
Sample characteristics
Table 1 shows participants’ characteristics. The mean age of 1,016 participants was 68.0 years (SD = 6.5). More than half of the participants were female (52.2%, n = 530), had completed education beyond high school graduation (54.2%, n = 551), lived with spouse (51.6%, n = 524), and resided in non-metropolitan areas (53.8%, n = 547). Regarding physical health, 95.2% (n = 967) reported having no disability, and 69.3% (n = 704) reported having diagnosis of one or more chronic condition.
Table 1. Sample characteristics (n = 1,016)VariablesM(SD) or n(%)Age (years)68.0 (6.5)Sex Male486 (47.8) Female530 (52.2)Education level Below middle school240 (23.6) Below high school225 (22.1) Below college451 (44.4) College and above100 (9.8)Living arrangements Living alone199 (19.6) Living with a spouse524 (51.6) Multi-generational households293 (28.8)Region Metropolitan area ^a^469 (46.2) Non-metropolitan area ^b^547 (53.8)Engaged in economic activities Never40 (3.9) Used to354 (34.8) Yes622 (61.2)No. of diagnosed chronic diseases 0312 (30.7) 1301 (29.6) ≥ 2403 (39.7)Disability No967 (95.2) Yes49 (4.8)No. of dependent items of K-ADL 0952 (93.7) 137 (3.6) ≥ 227 (2.7)No. of dependent items of K-IADL 0839 (82.6) 168 (6.7) ≥ 2109 (10.7)HRQoL (scores) PCS50.1 (7.3) MCS49.4 (8.4)Exercise No422 (41.5) Yes594 (58.5)Alcohol consumption No516 (50.8) Yes500 (49.2)Smoking Non-smoker628 (61.8) Ex-smoker260 (25.6) Current-smoker128 (12.6)EDLQ-22 (scores)57.1 (24.0)MSPSS (scores)3.9 (0.7)CES-D (scores)12.0 (7.6) 1–15750 (73.8) ≥ 16266 (26.2)Note. M: Mean; SD: Standard deviation; K-ADL: Korean Activities of Daily Living; K-IADL: Korean-Instrumental Activities of Daily Living; HRQoL: Health-Related Quality of Life; PCS: Physical Component Summary; MCS: Mental Component Summary; EDLQ-22: Everyday Digital Literacy Questionnaire 22-item; MSPSS: Multidimensional Scale of Perceived Social Support; CES-D: Center for Epidemiological Studies-Depression.^a^ Metropolitan area: Seoul, Incheon, and Gyeonggi province^b^ Non-metropolitan area: cities and provinces other than the metropolitan area
The results of K-ADL and K-IADL indicate that 93.7% (n = 952) had no dependence in ADL and 82.6% (n = 839) had no dependence in any of IADL. More than half of the participants reported being engaged in daily physical exercise for more than 10 min per day (58.5%, n = 594), were non-drinkers (50.8%, n = 516) and non-smokers (61.8%, n = 628). Health related quality of life scores for physical and mental health were 50.1 ± 7.3 and 49.4 ± 8.4 respectively. Digital literacy had a mean score of 57.1 ± 24.0, and perceived social support had a mean score of 3.9 ± 0.7. The mean score for depressive symptoms across our sample was 12.0 ± 7.6 and 26.2% (n = 266) were at risk for clinical depression.
Identification of social activity patterns
Model selection: 4-class model
Table 2 summarizes the model fit indices for the selectable 2 to 6 latent classes. Decreases in the AIC, BIC, and SSABIC values were less pronounced after the 3-class point. The entropy values, which indicated the quality of the class classification, satisfied the recommended thresholds across all the models. The p-values for the LMR-LRT and Adj. LMR-LRT were not statistically significant (p < .05) in the 5-class and 6-class scenarios. Considering the strong statistical evidence of the goodness-of-fit measures and the theoretical interpretability, the 4-class model was chosen for our sample.
Table 2. Summary of the model fit indices for the latent class analysisFit Indices1-class2-class3-class4-class ^a^5-class6-classAIC13938.37612049.3511477.40 11281.67 11122.2111046.63BIC14007.30712192.1411694.04 11572.17 11486.5611484.84SSABIC13962.84112100.0311554.29 11384.78 11251.5311202.17ENTROPY0.8780.813 0.822 0.8070.829LMR-LRT p-value< 0.0001< 0.0001 0.0234 0.06730.1374Adj. LMR-LRT p-value< 0.0001< 0.0001 0.0241 0.06860.1393BLRT p-value< 0.0001< 0.0001 < 0.0001 < 0.0001< 0.0001Note. AIC: Akaike Information Criterion; BIC: Bayesian Information Criterion; SSABIC: Sample-Size Adjusted Bayesian Information Criterion; LMR-LRT: Lo-Mendell-Rubin Likelihood Ratio Test; Adj. LMR-LRT: Adjusted Lo-Mendell-Rubin Likelihood Ratio Test; BLRT: Bootstrapped Likelihood Ratio Test^a^ Selected class solution is in bold
Characterization of social activity patterns
The characteristics of social activity patterns in the 4-class model can be explored based on the probabilities (ranging from 0 to 1) of respondents indicating participation in each social activity (see Table 3). Final class frequencies and proportions for the latent classes were described based on their most likely latent class membership. Class 1, the second-largest group (22.0%, n = 224), showed the lowest level of participation in overall social activities among the four classes. Approximately half participated in phone calls (49.2%) and about a quarter used text messages (24.0%), while the likelihood of participation in other digital device activities was very limited. For in-person social activities, over half had a probability of participating in social gatherings (55.1%); however, the probability of participation in other activities remained at the lowest level among the four classes.
Table 3. Probability scale in each social activity by classVariablesClass 1: Minimal in both digital and in-person (n = 224)Class 2:Moderate in both digital and in-person (n = 474)Class 3:Moderate in digital & very high in in-person (n = 147)Class 4:High in both digital and in-person (n = 171)P (SE)P (SE)P (SE)P (SE)Digital social activityPhone calls0.492 (0.038)0.995 (0.005)0.965 (0.019)1.000 (0.000)Text messages0.240 (0.034)0.982 (0.010)0.882 (0.038)0.988 (0.009)Messengers0.028 (0.016)0.958 (0.014)0.933 (0.035)0.989 (0.008)Information search0.029 (0.014)0.802 (0.027)0.832 (0.056)1.000 (0.000)Email0.000 (0.000)0.090 (0.024)0.146 (0.094)0.745 (0.073)Blogs0.000 (0.000)0.060 (0.017)0.076 (0.078)0.531 (0.074)Online Education0.014 (0.009)0.187 (0.031)0.254 (0.050)0.797 (0.071)App use0.000 (0.000)0.056 (0.023)0.066 (0.031)0.716 (0.086)In-person social activityReligious gatherings0.160 (0.026)0.186 (0.021)0.360 (0.063)0.315 (0.041)Social gatherings0.551 (0.035)0.751 (0.028)1.000 (0.000)0.901 (0.030)Leisure/culture/sports activities0.160 (0.028)0.092 (0.031)0.801 (0.087)0.481 (0.071)Alumni meetings0.187 (0.029)0.288 (0.040)0.917 (0.055)0.719 (0.065)Volunteer work0.026 (0.011)0.028 (0.010)0.381 (0.111)0.194 (0.063)Political/civic/interest group activities0.000 (0.000)0.002 (0.002)0.224 (0.098)0.109 (0.054)Note. P, Probability; SE, Standard error
Class 2, the largest group (46.7%, n = 474), displayed notable variation in participation rates across different types of social activities. Regarding digital social activities, majority had participated in phone calls (99.5%), text messages (98.2%), messenger apps (95.8%), and information search (80.2%). However, participation in other activities remained low (< 20%). Regarding in-person social activities, apart from social gatherings (75.1%) and alumni meetings (28.8%), participation rates were consistently below 20%.
Class 3, the smallest group (14.5%, n = 147), exhibited similar likelihoods of participating in digital social activities compared to Class 2, while displaying the highest likelihood of participating in in-person social activities among the four groups. Respondents in Class 3 showed a high likelihood of participating not only in social gatherings (100.0%) but also in alumni meetings (91.7%) and leisure/culture/sports activities (80.1%).
Class 4, the third largest group (16.8%, n = 171), showed the highest likelihood of engagement in digital social activities among the four groups, and also demonstrated the second highest level of participation in in-person social activities. Particularly, the majority of respondents in Class 4 indicated a likelihood of participation in phone calls (100.0%), information search (100.0%), messenger apps (98.9%), and text messages (98.8%), with over 50% indicating participation in the remaining digital activities as well.
Figure 1 illustrates the probability of social activity for each class. The x-axis and y-axis display indicators of social activities and a probability scale from 0 to 1, indicating the probability of engaging in each activity. Based on the distribution of the 14 social activities, classes were labeled as “minimal in both digital and in-person” (Class 1, 22.0%, n = 224), “moderate in both digital and in-person” (Class 2, 46.7%, n = 474), “moderate in digital & very high in in-person” (Class 3, 14.5%, n = 147), and “high in both digital and in-person” (Class 4, 16.8%, n = 171).
Fig. 1. Probability of the social activities among the four latent classes
Characteristics associated with social activity patterns
Table 4 presents the results of multinomial logistic regression examining the role of characteristics that may be associated with social activity patterns. Younger age, multi-generational households compared to living alone, and higher digital literacy were associated with a higher likelihood of being in the “moderate in both digital and in-person” social activity group rather than the “minimal in both digital and in-person” group. In addition, younger age, male, multi-generational households, residing in metropolitan areas, no dependency on IADL items, doing daily physical exercise for more than 10 min, and higher digital literacy were associated with a higher likelihood of being in the “moderate in digital & very high in in-person” social activity group rather than the “minimal in both digital and in-person” group. Similarly, younger age, multi-generational households, no dependency on IADL items, doing daily physical exercise for more than 10 min, and higher digital literacy were associated with a higher likelihood of being in the “high in both digital and in-person” social activity group rather than the “minimal in both digital and in-person” group.
Table 4. Multinomial logistic regression for associated variables of social activity patternsVariables“Moderate in both digital and in-person” vs “Minimal in both digital and in-person” (ref)“Moderate in digital & very high in in-person” vs “Minimal in both digital and in-person” (ref)“High in both digital and in-person” vs “Minimal in both digital and in-person” (ref)OR95% CIOR95% CIOR95% CIAge (years)0.920.87–0.960.900.84–0.960.85**0.77–0.94Sex (ref: Female) Male1.460.66–3.243.241.13–9.292.120.52–8.67Education level (ref: College or higher) Below middle school1.610.39–6.630.370.07–2.070.210.03–1.60 Below high school3.350.83–13.561.200.26–5.550.150.02–1.32 Below college3.410.75–15.391.640.34–7.910.570.10–3.20Living arrangements (ref: Multi-generational households) Living alone0.330.15–0.720.220.07–0.770.230.06–0.82 Living with a spouse0.580.28–1.200.640.26–1.590.580.20–1.67Region (ref: Non-metropolitan area) Metropolitan area1.030.57–1.872.09*1.03–4.262.220.91–5.42Engaged in economic activities (ref: Yes) Never0.700.22–2.221.800.40–8.172.480.45–13.75 Used to0.590.32–1.070.990.44–2.201.250.47–3.36No. of diagnosed chronic diseases (ref: ≥ 2) 00.700.33–1.500.620.25–1.590.900.29–2.80 11.130.53–2.410.710.28–1.811.100.36–3.36Disability (ref: No) Yes1.420.46–4.341.140.18–7.371.900.18–19.64No. of dependent items of K-ADL (ref: ≥ 2) 05.320.38–74.871.990.10-40.662.340.09–60.98 13.160.03-323.941.160.01-157.640.860.01-134.67No. of dependent items of K-IADL (ref: ≥ 2) 01.780.61–5.187.271.72–30.8322.281.69-294.63 10.710.13-4.002.340.24–22.845.900.25-141.24HRQoL (scores) PCS0.980.94–1.020.970.91–1.021.000.92–1.09 MCS0.990.95–1.030.970.93–1.020.960.90–1.02Exercise (ref: No) Yes1.550.86–2.813.23**1.46–7.143.051.21–7.68Alcohol consumption (ref: No) Yes1.090.58–2.051.220.55–2.700.980.38–2.52Smoking (ref: Current-smoker) Non-smoker2.280.84–6.212.540.76–8.541.790.39–8.30 Ex-smoker1.450.48–4.401.300.35–4.811.850.43–8.02EDLQ-22 (scores)1.121.09–1.151.131.10–1.171.23**1.18–1.29MSPSS (scores)1.050.69–1.601.340.76–2.361.780.88–3.61Note. OR: Odds ratio; CI: Confidence interval; K-ADL: Korean Activities of Daily Living; K-IADL: Korean-Instrumental Activities of Daily Living; HRQoL: Health-Related Quality of Life; PCS: Physical Component Summary; MCS: Mental Component Summary; EDLQ-22: Everyday Digital Literacy Questionnaire 22-item; MSPSS: Multidimensional Scale of Perceived Social Support p < .05, ** p < .01, *** p < .001
Comparison of depressive symptoms by social activity patterns
Table 5 shows the results of the ANOVA conducted to explore the differences in depressive symptoms by identified social activity patterns. The mean CES-D scores were observed as follows: minimal in both digital and in-person (14.64 ± 8.52), moderate in both digital and in-person (11.67 ± 7.24), moderate in digital & very high in in-person (11.21 ± 7.41), and high in both digital and in-person (10.03 ± 6.83), with significant differences among the groups.
Table 5ANOVA of depressive symptoms by social activity patternsSocial activity patternsCES-D (scores)MSDF p Minimal in both digital and in-person14.648.5214.03< .001Moderate in both digital and in-person11.677.24Moderate in digital & very high in in-person11.217.41High in both digital and in-person10.036.83Note. M: Mean; SD: Standard deviation; CES-D: Center for Epidemiological Studies-Depression
Subsequently, we examined the association between depressive symptoms and social activity patterns, controlling for sex, chronic diseases, disabilities, functional status, physical activity, and alcohol consumption. There was no multicollinearity among the variables included in the model (variance inflation factor < 10). After accounting for covariates, the association between social activity patterns and depressive symptoms remained significant (see Table 6). Compared to the group with minimal engagement in both digital and in-person activities, all three other groups exhibited disparities in the CES-D scores.
Table 6. Association between depressive symptoms and social activity patternsβSE p VIFSocial activity patterns(ref: Minimal in both digital and in-person) Moderate in both digital and in-person-1.580.81.0511.57 Moderate digital & very high in in-person-2.060.80.0101.75 High in both digital and in-person-1.490.62.0161.84Sex (ref: Female) Male-0.720.51.1571.25No. of diagnosed chronic diseases (ref: ≥ 2) 0-2.760.57< .0011.33 1-1.980.56< .0011.29Disability (ref: No) Yes1.211.12.2811.13No. of dependent items of K-ADL (ref: ≥ 2) 0-4.841.60.0032.94 1-3.021.94.1202.57No. of dependent items of K-IADL (ref: ≥ 2) 0-2.920.85< .0012.03 1-2.171.17.0631.66Exercise (ref: No) Yes-1.400.47.0031.05Alcohol consumption (ref: No) Yes-0.290.50.5641.21F (p)10.348 (< .001)R^2^0.118Adjusted R^2^0.107Note. SE: Standard error; VIF: Variance Inflation Factor; K-ADL: Korean Activities of Daily Living; K-IADL: Korean-Instrumental Activities of Daily Living
Discussion
Principal findings
We investigated social activity patterns among a nationwide sample of community-dwelling older adults in South Korea. Highlighting the heterogeneity and diversity of social activity within the older adult population, we examined the patterns of social activities encompassing both digital and in-person interactions. Four distinct groups emerged: “minimal in both digital and in-person,” “moderate in both digital and in-person,” “moderate in digital & very high in in-person,” and “high in both digital and in-person” social activity groups. Older adults in the minimal social activity group showed significantly higher levels of depressive symptoms compared to the other three groups, while accounting for covariates. This finding supports previous studies indicating an inverse association between older adults’ social activity and depressive symptoms [5–12]. This study builds upon prior research by identifying a subgroup of older adults characterized by significant inactivity, near isolation, and heightened levels of depressive symptoms compared to other groups within the population. The lessons learned from this study, which focuses on older adults in South Korea – where aging and digitalization are progressing at a pace unmatched elsewhere – can serve as valuable references for future digital policies and support programs for older adults in other regions worldwide experiencing similar demographic and technological shifts.
The four latent classes showed more pronounced distinctions in digital activities compared to in-person activities. While in-person social activities consistently demonstrated a high probability of participation across classes, in the order of social gatherings, alumni meetings, leisure/culture/sports activities, or religious gatherings, digital social activities displayed distinct characteristics and variations across the classes.
Interestingly, digital social activity of the two “moderate in digital” groups, comprising 61.2% of the sample, predominantly consisted of individual communication methods, such as phone calls, text messages, and messengers, as well as online information search. However, their participation rates in activities such as email, blogs, online education, and other app use were very low, like the minimally active group. This characterization is consistent with findings from a nationally representative sample from South Korea in 2020, indicating that over 89% of the sample engaged in digital social activities related to individual communication (e.g., receiving/sending messages), while involvement in more advanced activities (e.g., online commerce, app use, financial activities) remained low, at less than 20% [49]. On the other hand, the minimal group, which exhibited the highest depressive symptoms, showed notably low levels of engagement even in individual communication via mobile phones. In the minimal group, it was discovered that one out of two individuals may not participate in phone calls, and only one out of five may engage in text messaging activities. These findings suggest that despite the high smartphone use rate among Korean older adults [1] and the country’s leading global internet usage rate [2], approximately 20% of older adults may remain digitally isolated. To address this issue and assist the minimally active group reaching at least a moderately active level, interventions should be tailored to cater the diverse needs of older adults. Factors such as health status, socioeconomic status, and resource availability, which are linked to social activity, should be considered.
Our results highlight two modifiable attributes – digital literacy and physical activity – that could facilitate social activities among older adults. Specifically, in our sample, older adults with higher digital literacy were more inclined to belong to the moderately or highly active group rather than the minimal social activity group. This finding aligns with a previous study that reported a positive association between older adults’ engagement in social activities and their use of information and communications technology (ICT), particularly in relation to digital literacy [50]. In our study, it is noteworthy that older adults with high digital literacy were more likely to belong to the other moderately or highly social active group than the minimally active group, regardless of their age or living arrangements. This finding underscores the importance of developing strategies to support digital literacy and encourage the use of digital device to facilitate social activities among older adults. For example, providing digital literacy education tailored for older adults [51, 52] may enhance their ability to use digital devices for social activities. This can create opportunities for older adults to engage in social interactions, even in the absence of in-person interactions [53, 54]. Importantly, interventions targeting older adults should be tailored to their unique needs. Digital literacy training programs can be structured in tiers or personalized to individual capacities [52]. When working with older adults, it is crucial to recognize that they may require more time, patience, and frequent reminders to grasp digital skills effectively [55]. Additionally, efforts should focus on fostering positive perceptions and experiences of ICT among older adults. By accumulating positive experiences with ICT, older adults can develop a deeper understanding and curiosity about technology, seamlessly integrate it into their daily routines, and enhance their overall digital literacy [56, 57]. Such interventions can be especially valuable in unforeseen circumstances where in-person social interactions are not possible, such as during the COVID-19 pandemic. It can aid older adults in staying connected and reducing feeling of isolation [58]. Moreover, since older adults may face limitations in participating in in-person social activities due reduced physical capabilities [59], providing them with the skills to engage in digital social interactions could prove beneficial for maintaining their social and psychological well-being.
Based on our findings, physical activity also emerges as a contributing factor in fostering social activity among older adults [60, 61]. Older adults who engaged in more than 10 min of daily physical activity were more inclined to belong to the “moderate in digital & very high in in-person” group and “high in both digital and in-person” group compared to the “minimal in both digital and in-person” group. Previous studies have similarly highlighted the association between physical activity and social activity [29, 30]. This association may be partially attributed to the social aspects inherent in physical activity, where participants interact with others; hence, physical activity itself serves as a form of social activity [62, 63]. Especially, group-based physical activity classes, such as aerobic exercise, walking, and strength training [64], inherently promote social interactions among group members. Such programs are likely to sustain older adults’ involvement in social activities and, additionally, promote their psychosocial well-being and mental health. In situations where in-person gatherings are not feasible, such as during a pandemic, exchanging and discussing physical activity experiences via social networking services can also foster a sense of social connectedness [65].
Furthermore, our research indicates that older adults who are older or living alone are more inclined to be categorized into a minimally socially active group rather than the other three groups, corroborating the findings of previous studies. While further research is warranted to investigate the socioeconomic and health-related characteristics influencing older adults’ social activity participation more comprehensively, individuals with these characteristics should be given priority attention, especially considering limited community resources.
Limitations
This study has several limitations. First, we analyzed cross-sectional data; thus, we could not consider time variables, which made it challenging to establish causal relationships among the relevant variables. Additional longitudinal studies are needed to better understand how social activities among older adults evolve over time, whether changes in depressive symptoms are associated with different patterns of social activity, and which factors influence these changes. Second, although we included six indicators of in-person social activities and eight indicators of digital social activities, it is possible that other meaningful activities were missed. Nevertheless, to our knowledge, this study is significant as one of the first comprehensive investigations on expected social activities among older adults in a digital society. Third, due to the characteristics of our analytical methodology, we dichotomized each social activity into participation and non-participation, which limited our understanding of the extent of participation in each social activity. Future research should adopt a more detailed approach by clustering social activities among older adults based on their frequency, intensity, and quality. Fourth, although we emphasize the importance of preventing depressive symptoms by promoting social activities among older adults, our study did not directly examine factors associated with depressive symptoms, as our primary focus was on social activity patterns. In our study, the social activity patterns identified through latent class analysis are unique to our sample and are not established concepts. Future studies could concentrate on analyzing the impact of more well-defined social activity patterns on depressive symptoms. This approach has the potential to provide in-depth insights into effective strategies for preventing and addressing depressive symptoms among older adults.
Conclusions
Our findings suggest that distinct patterns of social activity can be observed among community-dwelling older adults. Furthermore, these patterns may have varying implications for the risk of depressive symptoms. Notably, older adults with limited social activity were more susceptible to depressive symptoms. Therefore, interventions that address modifiable factors, such as supporting digital literacy of older adults, could serve as a potential strategy to enhance their social engagement and, consequently, their mental well-being. Furthermore, promoting physical activity may be a promising interventional approach to encourage older adults to actively participate in social activities.
The reference list from the paper itself. Each links out to its DOI / PubMed record.
- 1Gallup, Report. The 2012–2022 report on smartphone use & brand, smart watch, and wireless earphone. Gallup. 2022. https://www.gallup.co.kr/gallupdb/report Content.asp?seq No=1309 Accessed 12 Apr 2024.
- 2Wike R, Silver L, Fetterolf J, Huang C, Austin S, Clancy L, Gubbala S. Internet, smartphone and social media use. Pew Research Center. 2022. https://www.pewresearch.org/global/2022/12/06/internet-smartphone-and-social-media-use-in-advanced-economies-2022/ Accessed 12 Apr 2024.
- 3Jeon GS, Choi KW, Jang KS. Social networking site usage and its impact on depressive symptoms among older men and women in South Korea. Int J Environ Res Public Health. 2020;17(8).10.3390/ijerph 17082670 PMC 721588032295024 · doi ↗ · pubmed ↗
- 4Liu Q, Pan H, Wu Y. Migration Status, Internet Use, and Social Participation among Middle-aged and older adults in China: consequences for Depression. Int J Environ Res Public Health. 2020;17(16).10.3390/ijerph 17166007 PMC 745960532824867 · doi ↗ · pubmed ↗
- 5Kang YW, Jahng SM, Kim SY. Korean Dementia Association: Korean-Mini Mental State Examination, 2nd Edition (K-MMSE ~ 2) user’s guide. 2020.10.12779/dnd.2020.19.4.161PMC 778173533377669 · doi ↗ · pubmed ↗
- 6Korea Employment Information Service: Korean Longitudinal Study of Ageing (K Lo SA). Korea Employment Information Service: Chungcheongbuk-do Republic of Korea. 2020. https://survey.keis.or.kr/klosa/klosaque/List.jsp Accessed 12 Apr 2024.
- 7Williams GA, Kibowski F. Latent class analysis and latent profile analysis. In: Handbook of methodological approaches to community-based research: Qualitative, quantitative, and mixed methods 2016: 143–151.
- 8Jeon GS, Choi K. Purposes of Internet Use and its impacts on physical and psychological health of Korean older adults. Healthc (Basel) 2024, 12(2).10.3390/healthcare 12020244 PMC 1081587938255131 · doi ↗ · pubmed ↗