A Study of the Prevalence of Diabetic Retinopathy in Patients With Ischemic Heart Disease and Diabetes Mellitus
Ozukhil Radhakrishnan, Khushboo Goyal, Vishakha Vatkar, Shreya Gandhi, Tushar Agrawal

TL;DR
This study found that 95% of Indian patients with diabetes and heart disease had diabetic retinopathy, with more severe cases linked to higher blood sugar and heart function decline.
Contribution
The study establishes a significant association between diabetic retinopathy severity and ischemic heart disease markers like ejection fraction and HbA1c levels in diabetic patients.
Findings
Diabetic retinopathy prevalence was 95% in patients with diabetes and ischemic heart disease.
Higher HbA1c, insulin use, and lower ejection fraction correlated with more severe diabetic retinopathy.
Moderate non-proliferative diabetic retinopathy was the most common stage observed.
Abstract
Background Diabetes mellitus is one of the most important and common chronic diseases worldwide and is expected to increase in prevalence. Diabetic retinopathy (DR) is one of the most prevalent microvascular sequelae of diabetes mellitus (DM), and ischemic heart disease is a macrovascular sequela. This study was conducted to find out the relation between the degree of DR and ischemic heart disease severity in Indian patients. Materials and methods This cross-sectional, descriptive, hospital-based study was conducted in the ophthalmology department at Dr. D. Y. Patil Medical Hospital, Pune, Maharashtra, India, from September 2022 to June 2024. A total of 200 eyes from 100 patients who were diagnosed with cases of ischemic heart disease and diabetes mellitus were included in the study. Patients with corneal pathology like endothelial dystrophies, corneal degenerations, corneal scars,…
Genes, proteins, chemicals, diseases, species, mutations and cell lines named across the full text — each resolved to its canonical identifier and authoritative record.
Click any figure to enlarge with its caption.
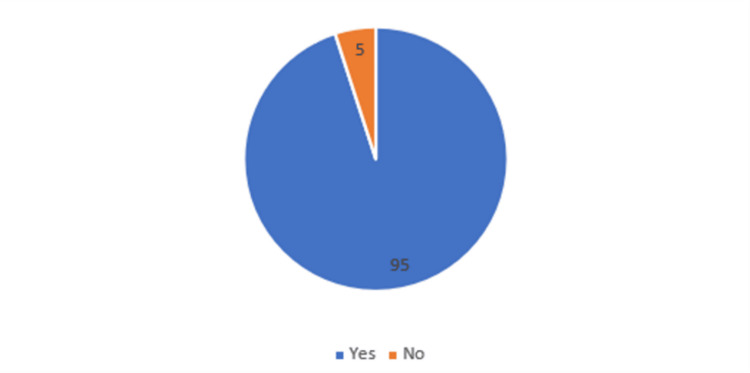 Figure 1
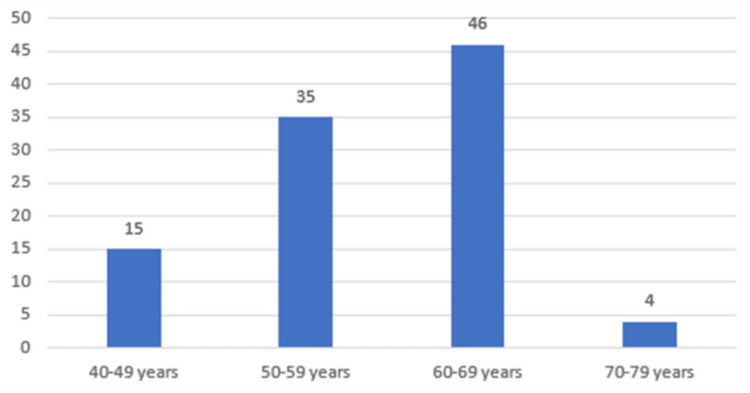 Figure 2
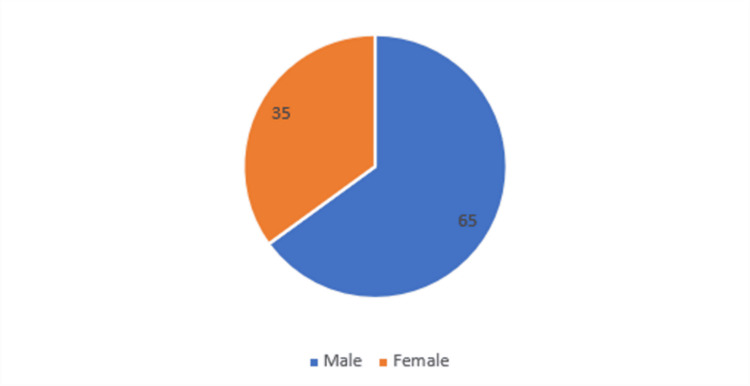 Figure 3
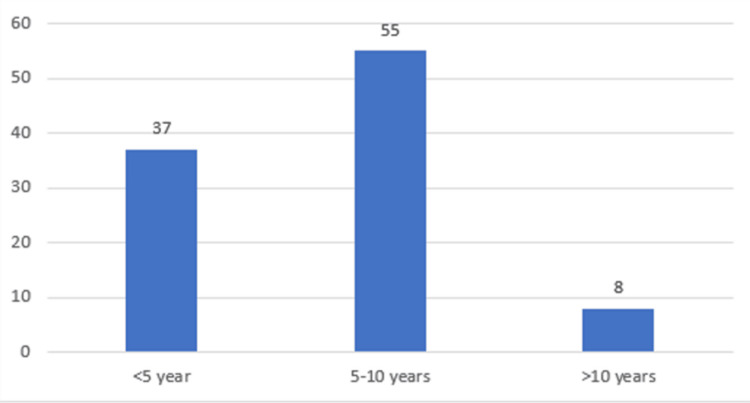 Figure 4
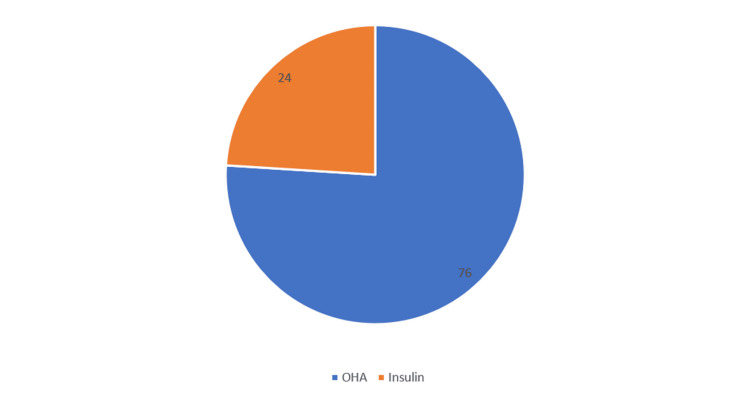 Figure 5
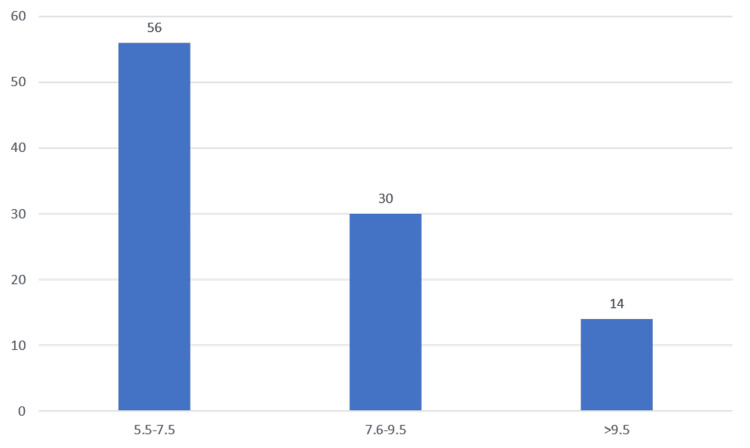 Figure 6
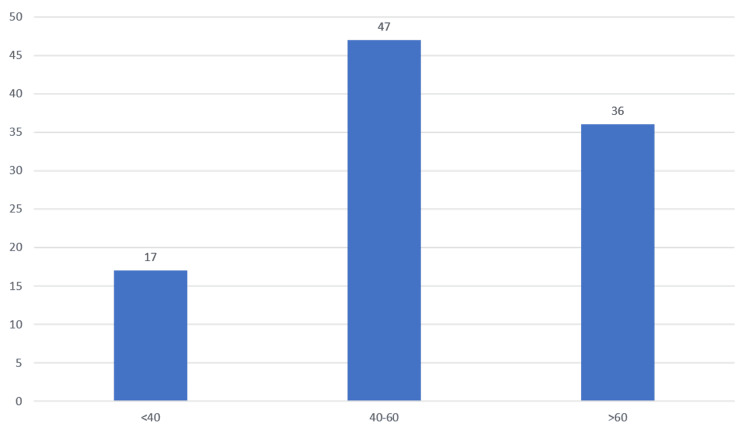 Figure 7
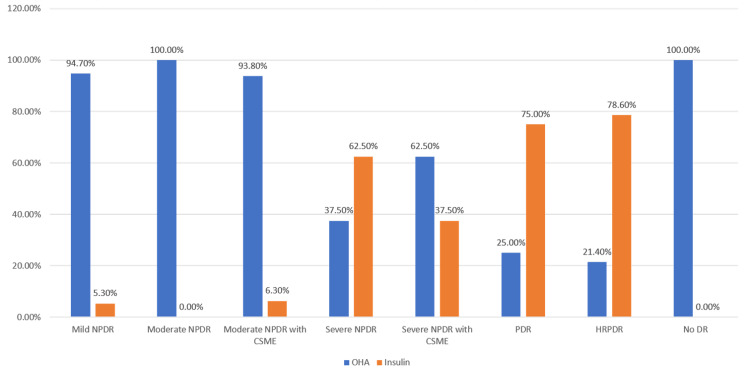 Figure 8
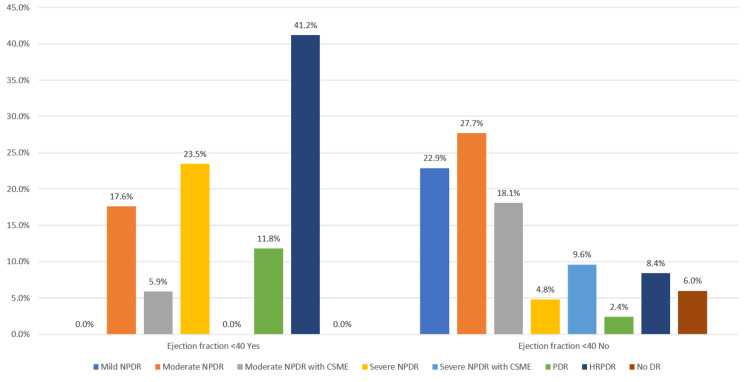 Figure 9
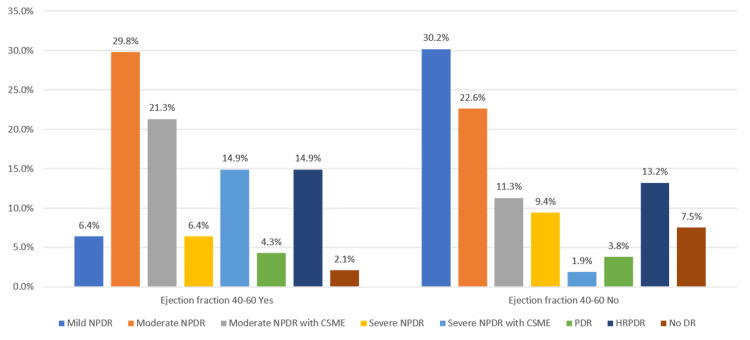 Figure 10
| Yes/No | Frequency | Percent |
| Yes | 95 | 95.0 |
| No | 5 | 5.0 |
| Total | 100 | 100.0 |
| Age group | Frequency | Percent |
| 40-49 years | 15 | 15.0 |
| 50-59 years | 35 | 35.0 |
| 60-69 years | 46 | 46.0 |
| 70-79 years | 4 | 4.0 |
| Total | 100 | 100.0 |
| Gender | Frequency | Percent |
| Male | 65 | 65.0 |
| Female | 35 | 35.0 |
| Total | 100 | 100.0 |
| Age range | Frequency | Percent |
| <5 year | 37 | 37.0 |
| 5-10 years | 55 | 55.0 |
| >10 years | 8 | 8.0 |
| Total | 100 | 100.0 |
| OHA/Insulin | Frequency | Percent |
| OHA | 76 | 76.0 |
| Insulin | 24 | 24.0 |
| Total | 100 | 100.0 |
| Range | Frequency | Percent |
| 5.5-7.5 | 56 | 56.0 |
| 7.6-9.5 | 30 | 30.0 |
| >9.5 | 14 | 14.0 |
| Total | 100 | 100.0 |
| Range | Frequency | Percent |
| <40 | 17 | 17.0 |
| 40-60 | 47 | 47.0 |
| >60 | 36 | 36.0 |
| Total | 100 | 100.0 |
| Diabetic Retinopathy Yes | Diabetic Retinopathy No | |||||||
| Mean | SD | Median | IQR | Mean | SD | Median | IQR | |
| Age | 58.38 | 59.00 | 7.45 | 53,64 | 59.40 | 62.00 | 10.78 | 49,68.5 |
| Duration IHD | 4.40 | 4.00 | 2.64 | 3,6 | 5.40 | 2.00 | 8.20 | 1,11.5 |
| Duration DM | 5.97 | 6.00 | 3.65 | 3,8 | 3.40 | 2.00 | 1.95 | 2,5.5 |
| Duration HTN | 5.14 | 5.00 | 3.43 | 3,6 | 1.67 | 2.00 | 0.58 | 1, |
| Troponin I (ng/mL) | 0.28 | 0.24 | 0.13 | 0.18,0.34 | 0.15 | 0.14 | 0.05 | 0.115,0.2 |
| CKMB (IU/L) | 25.45 | 25.00 | 6.70 | 22,31 | 16.40 | 18.00 | 6.11 | 11.5,20.5 |
| FLP | 233.83 | 231.00 | 30.48 | 212,256 | 205.40 | 186.00 | 37.56 | 180,240.5 |
| BSL (R) mg/dl | 239.36 | 231.00 | 45.38 | 210,275 | 159.20 | 168.00 | 37.05 | 120.5,193.5 |
| HbA1c (%) | 7.88 | 7.40 | 1.72 | 6.8,8.4 | 5.90 | 5.60 | 0.68 | 5.5,6.45 |
| Diabetic retinopathy | N | Mean rank | Sum of ranks | p-value | |
| Age | Yes | 95 | 50.15 | 4764.50 | 0.601 |
| No | 5 | 57.10 | 285.50 | ||
| Total | 100 | ||||
| Duration IHD | Yes | 95 | 51.42 | 4885.00 | 0.162 |
| No | 5 | 33.00 | 165.00 | ||
| Total | 100 | ||||
| Duration DM | Yes | 95 | 51.67 | 4909.00 | 0.076 |
| No | 5 | 28.20 | 141.00 | ||
| Total | 100 | ||||
| Duration HTN | Yes | 35 | 20.71 | 725.00 | 0.020 |
| No | 3 | 5.33 | 16.00 | ||
| Total | 38 | ||||
| Troponin I (ng/mL) | Yes | 94 | 51.79 | 4868.50 | 0.007 |
| No | 5 | 16.30 | 81.50 | ||
| Total | 99 | ||||
| CKMB (IU/L) | Yes | 95 | 52.35 | 4973.00 | 0.005 |
| No | 5 | 15.40 | 77.00 | ||
| Total | 100 | ||||
| FLP | Yes | 95 | 51.81 | 4922.00 | 0.049 |
| No | 5 | 25.60 | 128.00 | ||
| Total | 100 | ||||
| BSL (R) mg/dl | Yes | 95 | 52.67 | 5004.00 | 0.001 |
| No | 5 | 9.20 | 46.00 | ||
| Total | 100 | ||||
| HbA1c (%) | Yes | 95 | 52.57 | 4994.50 | 0.002 |
| No | 5 | 11.10 | 55.50 | ||
| Total | 100 |
| Treatment | p-value | ||||
| OHA | Insulin | ||||
| DR severity | Mild NPDR | Frequency | 18 | 1 | <0.001 |
| Percentage | 94.7% | 5.3% | |||
| Moderate NPDR | Frequency | 26 | 0 | ||
| Percentage | 100.0% | 0.0% | |||
| Moderate NPDR with CSME | Frequency | 15 | 1 | ||
| Percentage | 93.8% | 6.3% | |||
| Severe NPDR | Frequency | 3 | 5 | ||
| Percentage | 37.5% | 62.5% | |||
| Severe NPDR with CSME | Frequency | 5 | 3 | ||
| Percentage | 62.5% | 37.5% | |||
| PDR | Frequency | 1 | 3 | ||
| Percentage | 25.0% | 75.0% | |||
| HRPDR | Frequency | 3 | 11 | ||
| Percentage | 21.4% | 78.6% | |||
| No DR | Frequency | 5 | 0 | ||
| Percentage | 100.0% | 0.0% | |||
| Total | Frequency | 76 | 24 | ||
| Percentage | 76.0% | 24.0% | |||
| DR severity | N | Mean rank | p-value | |
| BSL (R) mg/dl | No DR | 5 | 9.20 | <0.001 |
| Mild NPDR | 19 | 23.68 | ||
| Moderate NPDR | 26 | 40.37 | ||
| Moderate NPDR with CSME | 16 | 45.66 | ||
| Severe NPDR | 8 | 76.56 | ||
| Severe NPDR with CSME | 8 | 72.31 | ||
| PDR | 4 | 96.13 | ||
| HRPDR | 14 | 85.61 | ||
| Total | 100 |
| DR severity | N | Mean Rank | p-value | |
| HbA1c (%) | No DR | 5 | 11.10 | <0.001 |
| Mild NPDR | 19 | 26.00 | ||
| Moderate NPDR | 26 | 42.75 | ||
| Moderate NPDR with CSME | 16 | 46.66 | ||
| Severe NPDR | 8 | 56.75 | ||
| Severe NPDR with CSME | 8 | 74.81 | ||
| PDR | 4 | 93.50 | ||
| HRPDR | 14 | 86.86 | ||
| Total | 100 |
| Correlation of severity of diabetic retinopathy with ejection fraction <40 | |||||
| Ejection fraction <40 | p-value | ||||
| Yes | No | ||||
| DR severity | Mild NPDR | Frequency | 0 | 19 | <0.001 |
| Percentage | 0.0% | 22.9% | |||
| Moderate NPDR | Frequency | 3 | 23 | ||
| Percentage | 17.6% | 27.7% | |||
| Moderate NPDR with CSME | Frequency | 1 | 15 | ||
| Percentage | 5.9% | 18.1% | |||
| Severe NPDR | Frequency | 4 | 4 | ||
| Percentage | 23.5% | 4.8% | |||
| Severe NPDR with CSME | Frequency | 0 | 8 | ||
| Percentage | 0.0% | 9.6% | |||
| PDR | Frequency | 2 | 2 | ||
| Percentage | 11.8% | 2.4% | |||
| HRPDR | Frequency | 7 | 7 | ||
| Percentage | 41.2% | 8.4% | |||
| No DR | Frequency | 0 | 5 | ||
| Percentage | 0.0% | 6.0% | |||
| Total | Frequency | 17 | 83 | ||
| Percentage | 100.0% | 100.0% | |||
| Ejection fraction 40-60 | p-value | ||||
| Yes | No | ||||
| DR severity | Mild NPDR | Frequency | 3 | 16 | 0.015 |
| Percentage | 6.4% | 30.2% | |||
| Moderate NPDR | Frequency | 14 | 12 | ||
| Percentage | 29.8% | 22.6% | |||
| Moderate NPDR with CSME | Frequency | 10 | 6 | ||
| Percentage | 21.3% | 11.3% | |||
| Severe NPDR | Frequency | 3 | 5 | ||
| Percentage | 6.4% | 9.4% | |||
| Severe NPDR with CSME | Frequency | 7 | 1 | ||
| Percentage | 14.9% | 1.9% | |||
| PDR | Frequency | 2 | 2 | ||
| Percentage | 4.3% | 3.8% | |||
| HRPDR | Frequency | 7 | 7 | ||
| Percentage | 14.9% | 13.2% | |||
| No DR | Frequency | 1 | 4 | ||
| Percentage | 2.1% | 7.5% | |||
| Total | Frequency | 47 | 53 | ||
| Percentage | 100.0% | 100.0% | |||
| Ejection fraction >60 | p value | ||||
| Yes | No | ||||
| DR severity | Mild NPDR | Frequency | 16 | 3 | <0.001 |
| Percentage | 44.4% | 4.7% | |||
| Moderate NPDR | Frequency | 9 | 17 | ||
| Percentage | 25.0% | 26.6% | |||
| Moderate NPDR with CSME | Frequency | 5 | 11 | ||
| Percentage | 13.9% | 17.2% | |||
| Severe NPDR | Frequency | 1 | 7 | ||
| Percentage | 2.8% | 10.9% | |||
| Severe NPDR with CSME | Frequency | 1 | 7 | ||
| Percentage | 2.8% | 10.9% | |||
| PDR | Frequency | 0 | 4 | ||
| Percentage | 0.0% | 6.3% | |||
| HRPDR | Frequency | 0 | 14 | ||
| Percentage | 0.0% | 21.9% | |||
| No DR | Frequency | 4 | 1 | ||
| Percentage | 11.1% | 1.6% | |||
| Total | Frequency | 36 | 64 | ||
| Percentage | 100.0% | 100.0% | |||
Peer Reviews
No public reviews on file for this paper yet. If you reviewed it on a platform where reviews are public (OpenReview, ICLR, NeurIPS, ICML), you can paste yours below so the community can read it here.
Videos
No videos yet. Explain this paper in a talk, walkthrough, or lecture? Add one.
Taxonomy
TopicsRetinal Diseases and Treatments · Retinal Imaging and Analysis · Retinal and Optic Conditions
Introduction
Diabetes mellitus (DM) is one of the most important and common chronic diseases worldwide and is expected to increase in prevalence. The prevention of DM complications is important because morbidity, mortality, and healthcare costs for diabetic patients are critical socioeconomic issues in most countries [1]. Diabetes mellitus (DM) is a vascular disease that has several microvascular manifestations, such as retinopathy, and macrovascular complications, such as coronary artery disease. Type 2 DM has been identified as an independent risk factor for peripheral arterial disease, congestive heart failure (CHF), and cardiovascular disease [2].
Many diabetics who have retinopathy may also have undiagnosed coronary artery disease. One of the well-known macrovascular consequences of diabetes mellitus is coronary heart disease (CHD), which is a major cause of mortality in individuals with the condition [3]. Diabetic retinopathy (DR) is the most common cause of visual disability in people of working age [4]. It is well known that the risk factors for DR include the duration of DM, hypertension, poor glycemic control, and obesity. With a worldwide prevalence of 382 million, diabetic retinopathy (DR) is one of the most prevalent diabetes-specific sequelae [4,5]. DR is a rapidly growing condition that may cause damage to the retinal capillaries and ultimately result in blindness.
The importance of glycemic control in reducing microvascular complications is well established. Although controversial, there is evidence that glycemic control can limit macrovascular disease, including cardiovascular disease, stroke, and peripheral arterial disease [6,7]. Hemodynamics (impaired autoregulation and hyperperfusion) and vascular endothelial growth factor (VEGF) are the possible mechanisms by which hypertension may affect DR [8]. Extensive data linking DR to various micro- and macrovascular problems is available. It was recently shown that DR is linked to macrovascular comorbidities such as coronary disease and cerebrovascular accidents, as well as subclinical atherosclerosis [9].
The purpose of the study is to find out the prevalence of diabetic retinopathy in patients with ischemic heart disease (IHD), to know if more severe stages of diabetic retinopathy are associated with an increased occurrence of IHD, and to find out the correlation between macrovascular and microvascular complications of diabetes mellitus. There are no studies from this part of the country that study this aspect of diabetic retinopathy to the best of our knowledge.
Aim and objectives
The study aims to study the prevalence of diabetic retinopathy in patients with ischemic heart disease and diabetes mellitus and find out the relation between the degree of diabetic retinopathy and ischemic heart disease severity in Indian patients.
Materials and methods
Study design and setting
This cross-sectional, descriptive, hospital-based study was conducted in the ophthalmology department at Dr. D. Y. Patil Medical Hospital, Pune, Maharashtra, India, from September 2022 to June 2024. A total of 200 eyes of 100 patients who were diagnosed with cases of ischemic heart disease and diabetes mellitus were included in the study, with each participant undergoing a thorough clinical assessment and investigation. The study received approval from the Institutional Ethics Committee of DYPMCH, Pune (approval number IESC/PGS/2022/112, dated January 28, 2022).
Inclusion criteria
All patients who were diagnosed with cases of ischemic heart disease and type 2 diabetes mellitus in the age group of 40-70 years at a tertiary care center in Western Maharashtra were included in the study.
Exclusion criteria
Patients with corneal pathology like endothelial dystrophies or corneal degenerations, corneal scars, dense cataracts, or trauma preventing good visualization of the fundus were excluded from the study. Also excluded were patients with active uveitis, patients with a history of undergoing any previous vitreoretinal surgery or laser procedures, non-compliant patients, and patients not willing to undergo the procedure or not consenting to the study.
Sample size
Based on a study conducted by El Demerdash et al. [3], the minimum sample size was calculated to be 100 using WinPepi software, version 11.38.
Data and sample collection
All patients diagnosed with IHD and DM were subjected to the following: History taking, including age, sex, socioeconomic status, employment status, smoking history (current, former, or never), duration of DM, and family history of IHD, DM, and HTN.
Thorough clinical examination: Laboratory investigation, including complete blood count (CBC), HbA1C, blood sugar levels, serum total cholesterol, CK-MB, troponin-I, NT-pro BNP, serum creatinine, and total cholesterol (TC). To correlate clinically, 2D-echo and ECG were performed for all the patients. A thorough ophthalmic evaluation including uncorrected visual acuity (UCVA) and best-corrected visual acuity (BCVA) for both near and distance vision was measured using the Snellen chart; ocular examination of the orbit and adnexa and extraocular movements were assessed; anterior segment examination with slit lamp biomicroscopy was conducted to assess the conjunctiva, cornea, anterior chamber, iris details, pupil, and lens; and posterior segment evaluation was done using slit lamp biomicroscopy using a 90D Volk lens and an indirect ophthalmoscope with a 20D lens. (The patient's eye was dilated using 0.8% tetracycline and 5% phenylephrine.).
Intraocular pressure was measured in all patients using non-contact air-puff tonometry. Diabetic retinopathy was graded using the early treatment diabetic retinopathy study (ETDRS) system. Optical coherence tomography and fundus fluorescein angiography were done for posterior segment evaluation when indicated.
Consent
Written informed consent was obtained from each patient. In the study, we recruited 100 patients, explained the procedure and purpose to them, and obtained informed consent from all the patients.
Statistical analysis
Data was entered in Microsoft Excel and statistical analysis was done using IBM Corp. Released 2019. IBM SPSS Statistics for Windows, Version 26.0. Armonk, NY: IBM Corp. Quantitative data was summarized using the mean (SD) and median (IQR). Qualitative data was summarized using proportions. As the continuous variables showed a skewed distribution, we used the Mann-Whitney test and the Kruskal-Wallis test to test the significance of the difference between continuous and categorical variables. A chi-square test was employed to check the association between categorical variables. Significance was assumed at an alpha error of 5%.
Results
Table 1, Figure 1 show the prevalence of diabetic retinopathy in the study population. The prevalence of diabetic retinopathy among the IHD patients was 95%.
Diabetic retinopathy prevalence
Table 2, Figure 2 show the age distribution in the study population. The majority of the patients in our study were in the age group of 60-69 years (46%), followed by 50-59 years (35%), and 40-49 years (15%).
Age distribution of patients
Table 3, Figure 3 show the gender distribution in the study population. Most of the patients were males (65%), while 35% of them were females.
Gender distribution of patients
Table 4, Figure 4 show the duration of DM in the study population. Most of the patients had diabetes for 5-10 years (55%), while 37% had DM for less than five years and 8% had it for more than 10 years.
Duration of DM
Table 5, Figure 5 shows the treatment modality for DM in the study population. Most of the diabetic patients were on treatment with OHA (76%), while 24% were on treatment with insulin.
Treatment modality of DM
Table 6, Figure 6 show the glycated hemoglobin values in the study population. Most of the patients had HbA1c values of 5.5-7.5 (56%), followed by HbA1c values of 7.6-9.5 (30%) and >9.5 (14%).
HbA1c levels
Table 7, Figure 7 show the ejection fraction values obtained from 2D-echo in the study population. According to 2D-echo, most of the patients had an ejection fraction of 40-60% (47%), followed by a value of >60% (36%) and a value of <40% (17%).
Ejection fraction values
Table 8 shows the correlation of diabetic retinopathy with age, duration of IHD and DM, troponin I, CKMB, FLP, BSL (R), and HbA1c (descriptive data).
The mean age of the patients with diabetic retinopathy and the patients without diabetic retinopathy was 58.38 and 59.40 years, respectively.
The mean duration of IHD in patients with diabetic retinopathy and in patients without diabetic retinopathy was 4.4 and 5.4 years, respectively.
The mean duration of diabetes for patients with diabetic retinopathy and patients without diabetic retinopathy was 5.97 and 3.4 years, respectively.
The mean duration of hypertension in patients with diabetic retinopathy and in patients without diabetic retinopathy was 5.14 and 1.67 years, respectively.
The mean CKMB of the patients with diabetic retinopathy and patients with no diabetic retinopathy was 25.45 and 16.40 IU/L, respectively.
The mean fasting lipid profile (FLP) values of the patients with diabetic retinopathy and patients without diabetic retinopathy were 233.83 and 205.4, respectively.
The mean BSL of the patients with diabetic retinopathy and patients with no diabetic retinopathy was 239.36 and 159.2 mg/dl, respectively.
The mean HbA1c of the patients with diabetic retinopathy and patients with no diabetic retinopathy was 7.88 and 5.9, respectively.
Table 9 shows that the duration of hypertension (p-value 0.020), CKMB (p-value 0.005), Troponin I (p-value 0.007), FLP (p-value 0.049), FBS (p-value 0.001), and HbA1c (p-value 0.002) were significantly higher among the diabetic retinopathy group than the non-DR group, as derived by the Mann-Whitney Test.
Table 10, Figure 8 show the correlation of the severity of diabetic retinopathy with treatment of DM with OHA and insulin as derived by the Kruskal-Wallis test. A higher proportion of the severe forms of DR patients were on treatment with insulin than the milder forms of DR (p-value <0.001).
Correlation between treatment modality and DR severityDR: Diabetic retinopathy
Table 11 shows the correlation of the severity of diabetic retinopathy with the blood sugar levels as derived by the Kruskal-Wallis test. There is a significant association between the severity of diabetic retinopathy and higher blood sugar levels (p-value <0.001).
Table 12 shows the correlation of the severity of diabetic retinopathy with the glycated hemoglobin levels as derived by the Kruskal-Wallis test. There is a significant association between the severity of diabetic retinopathy and the higher HbA1c levels (p-value <0.001).
Table 13, Figure 9 show the correlation of the severity of diabetic retinopathy with an ejection fraction <40 as derived by the Kruskal-Wallis test. A significantly higher proportion of patients with an ejection fraction of <40 had PDR and HRPDR (p-value <0.001).
Table 13: Correlation of severity of diabetic retinopathy with ejection fraction <40NPDR: Non-proliferative diabetic retinopathy, CSME: Clinically significant macular edema, DR: Diabetic retinopathy, HRPDR: High-risk proliferative diabetic retinopathy
Correlation between ejection fraction <40 and diabetic retinopathy severity
Table 14, Figure 10 show the correlation of the severity of diabetic retinopathy with ejection fraction 40-60 as derived by the Kruskal-Wallis test. A significantly higher proportion of patients with an ejection fraction of 40-60 had moderate NPDR (p-value 0.015).
Correlation between ejection fraction 40-60 and diabetic retinopathy severity
Table 15 shows the correlation between the severity of diabetic retinopathy and ejection fraction >60 as derived by the Kruskal-Wallis test. A significantly higher proportion of patients with an ejection fraction >60 had mild and moderate NPDR (p-value <0.001).
Discussion
Large retrospective studies done with significant samples of individuals with type 2 diabetes (T2D) have shown that the risk of cardiovascular disease (CVD) rises as the combined burden of microvascular disease increases [10,11]. Diabetic retinopathy (DR) is a clear sign of diabetes that is not well-controlled and is associated with an increased risk of cardiovascular disease (CVD). In addition, they have the ability to initiate inflammatory reactions that may contribute to the development of atherosclerosis, as well as causing coronary artery disease (CAD) and exacerbating cardiovascular disease (CVD) [12,13].
Diabetes mellitus and cardiovascular disease (CVD) share some of the common risk factors, such as obesity [13]. The worldwide research group from the World Health Organization (WHO) has shown that diabetic retinopathy (DR) is linked to an increased risk of cardiovascular mortality and the occurrence of myocardial infarction in patients with type 2 diabetes (T2D) [14]. The present study was undertaken to assess the prevalence and other risk factors of diabetic retinopathy among 100 IHD patients with diabetes attending an eye OPD at a tertiary care center in Western India.
Previous studies primarily focused on the incidence and risk of CVDs, including IHDs, among diabetic retinopathy patients and the subsequent outcomes in those patients. Pradeepa et al. from Chennai, India, in their large study, evaluated the correlation of DR with CAD among 1736 diabetes patients. Their cross-sectional study showed a significant association between DR and CAD in South Indian subjects with type 2 diabetes [15]. El Demerdash et al. explored the utility of DR in predicting CAD among 60 diabetes patients. They concluded that the detection of DR or increased carotid intimal thickening should be a trigger to investigate CAD, and coronary angiography has to be performed once retinopathy is diagnosed [3].
Castelblanco et al. assessed the predictive capability of DR towards CVD diseases among 374 T2DM patients in a study from the USA. They concluded that DR is a strong predictor of cardiovascular events in T2D individuals at primary CVD prevention [16]. Eid et al. from Egypt evaluated the predictive capability of DR towards coronary atherosclerosis among 140 NIDDM patients. They concluded that the presence and degree of DR are independent predictors of severe coronary atherosclerosis. Therefore, when evaluating whether a patient with T2DM is at high risk for CAD or not, the DR degree should be taken into consideration [17]. In another study from Egypt, Attia et al. determined the association of DR with the risk of CAD among 50 diabetes patients. They concluded that diabetic retinopathy is a serious risk factor for increasing the severity of coronary artery diseases and can be considered a predictor of CHD in patients with DR [18].
DR prevalence and demography
In our study, among the patients with IHD and diabetes, the prevalence of diabetic retinopathy was found to be 95%. This is high when compared with the general population rate. A study from Ethiopia reported a DR prevalence of 34.1% among diabetes mellitus patients [19]. Vashist et al., in their survey among elderly people with IHD, reported a prevalence of DR of 11.8% [20]. The variation in the DR prevalence among IHD patients in our study might be due to the fact that all included patients were also diabetics. Data from India reported a prevalence of 15.5% to 16.9% of DR among diabetes patients [20,21]. Pradeepa et al. have shown that a significant relationship exists between coronary artery disease and DR, especially among poorly controlled diabetes patients [15]. Thus, the higher prevalence of DR in our study can be attributed to the duration of diabetes and poor hypoglycemic control, as indicated by BSL values and glycated hemoglobin values among most of the patients with IHD.
In our study, the majority of the patients were in the age group of 60-69 years (46%), followed by patients in the age group 50-59 years (35%), and the mean age of patients with diabetic retinopathy and patients with no diabetic retinopathy was 58.38 and 59.40 years, respectively. Attia et al., in their study, had patients of similar age to our study (mean=59.2 years and 57.3 years) [18]. The mean age of CVD patients in a study by Castelblanco et al. was 60 years [16]. Relatively younger patients were included in the study by El Demerdash et al. (mean=46.19 years to 47.1 years) [3]. Eid et al. included DR and non-DR patients with a mean age of 57.28 years and 53.41 years, respectively [17]. Our study and the study by Attia et al. found no significant association between age and diabetic retinopathy [18]. Eid et al. found that DR patients were significantly older than patients with no diabetic retinopathy [17].
In our study, most of the patients were males (65%), while 35% were females. Eid et al. also had a higher number of male patients in their study [17]. In contrast, females were more prevalent in the Attia et al. study [18]. Castelblanco et al. also reported females as the majority of the patients with CVD events [16].
Around 63% of our patients had DM for more than five years. Poor glycemic control was noted among the majority of the patients, with 64% having a blood sugar level of 200-300 mg/dl and 21% having levels between 140 and 200 mg/dl. The mean duration of diabetes in patients with IHD in our study was significantly higher among DR patients (mean=5.97 years) than the non-DR patients (mean=3.4 years). Eid et al. reported a higher duration of DM among their DR patients (mean=7.97 years) than their non-DR patients (mean=3.54 years) [17]. Vashist et al. reported a higher risk of DR among diabetes mellitus patients who had the disease for a duration of more than 10 years and had blood sugar values above 200 mg/dl [20]. Mersha et al. also observed this in their study of Ethiopian DR patients [19].
Although a majority of the patients were on treatment with OHA (76%) in our study, 24% were on treatment with insulin. Insulin usage has also been shown to be associated with a higher incidence of DR [19,20]. We found a significant association between the severity of diabetic retinopathy and the use of insulin as a treatment modality, i.e., a higher proportion of the severe forms of DR patients were on insulin than the milder forms of the DR. Although the direct relationship may not be there, insulin intake signifies the severity and uncontrolled nature of diabetes, which in turn might have led to the DR and subsequent worsening of the DR.
In our study, HbA1c was significantly higher among the diabetic retinopathy group than the patients with no DR, which is similar to the findings of the Eid et al. study [17]. Most of the patients had HbA1c values of 5.5-7.5 (56%), followed by HbA1c values of 7.6-9.5 (30%) and >9.5 (14%). The increased severity of diabetic retinopathy with elevated glycated hemoglobin levels was correlated with the Kruskal-Wallis test. There was a significant association between the severity of diabetic retinopathy and the higher HbA1c levels in our study population. Robyn J. Tapp et al. and Afaf M. S. Al-Adsani et al. reported findings similar to our study, finding a significant association between HbA1c and the severity of diabetic retinopathy [22,23].
Relationship of DR and its severity with CVD
Research has shown that congestive heart failure (CHF) negatively affects the ability of the microvessels of the retina to expand in response to flickering light. Evaluation of the vessels of the retina has been depicted as a novel and useful method for non-invasively evaluating microvascular problems in CHF [21]. Our study shows a clinically significant relationship between the severity of DR and the severity of IHD in terms of ejection fraction.
In our study, 2D-Echo evaluation of patients with IHD showed that most of the patients had an ejection fraction of 40-60% (47%), followed by a value of >60% (36%), and a value of <40% (17%). It was observed that the patients in our study with an ejection fraction of <40 had a significantly higher severity of diabetic retinopathy in the form of PDR and HRPDR. The severity of the DR was directly correlated with the severity of IHD in our study, with most of the IHD patients with a 40-60 ejection fraction having moderate NPDR and patients with a >60 ejection fraction having mild or moderate NPDR.
Eid et al. also reported a significant positive correlation between the grade of diabetic retinopathy and the severity of the CAD among their patients. They studied the relationship between the degree of DR and the angiographic severity of CAD. Patients with advanced DR had a more severe CAD than those with mild or no DR. They concluded that when evaluating whether a patient with T2DM is at high risk for CVD, the DR severity should be taken into consideration [17]. Attia et al. reported a significantly higher risk of CAD among DR patients than non-DR patients. They reported that diabetic retinopathy was a major risk factor for enhancing coronary atherosclerosis [18]. In contrast, Castelblanco et al. reported no impact of DR severity on cardiovascular events, although DR itself had a significant relationship with the incidence of CVD events [16]. A recent comprehensive analysis revealed that diabetic retinopathy (DR) is a robust indicator of both stroke and cardiovascular disease, indicating that people with DR generally have a more unfavorable prognosis compared to those who do not have DR [24].
The majority of the patients in our study had moderate NPDR (26%), followed by mild NPDR (19%). In a study by Castelblanco et al., 45.7% of the CVD patients had moderate or severe DR. While 14% of our patients had HRPDR, none of the patients from Castelblanco et al. had a severe form of DR (neither NPDR nor PDR) [16]. Vashist et al. reported mild DR as the most common pattern of DR (11.8%) among the diabetes patients included in their study [20]. Patients with severe forms of DR (proliferative DR) had proportionately higher cases of stenosis in the coronary vessel (80%) than the NPDR patients (70%) in the El Demerdash et al. study. No such stenosis was noted in any of the non-DR patients in the same study, indicating the significant link between the CADs and the DR in the study [3].
Limitations
Several inherent limitations must be acknowledged, which may affect the generalizability and interpretation of the study findings. First, the study's single-center design, conducted at a tertiary care hospital in Western India, limits the diversity of patient demographics. Second, the cross-sectional design of the study limits the temporality of the association between DR and the other factors studied. Also, due to the lack of a control group (non-IHD patients), we could not compare the risk factors and outcomes between the two groups. Additionally, the relatively small sample size of 100 cases may limit the statistical power and robustness of the conclusions drawn. To overcome these constraints, future research should focus on prospective, multicenter studies with larger and more diverse patient populations.
Conclusions
The prevalence of diabetic retinopathy among the IHD patients with diabetes was 95% in our study, with moderate NPDR being the most common stage of DR seen among the patients. It was observed that patients from rural backgrounds and illiterate people had a greater prevalence of diabetic retinopathy. More severe stages of retinopathy were seen in these patients. The duration of IHD and DM had a positive association with the presence of diabetic retinopathy.
It was observed that more severe stages of diabetic retinopathy were seen in patients who were on treatment with insulin than in patients who were on treatment with OHA. Severe stages of diabetic retinopathy were associated with higher BSL (R) levels and higher glycated hemoglobin levels. In the present study, it was observed that a lower ejection fraction (<40), which is a marker of reduced cardiac function, was associated with more severe stages of diabetic retinopathy. Patients with a higher ejection fraction (>60), which indicates good cardiac function, were associated with milder stages of diabetic retinopathy. Further, multi-centric studies need to be undertaken to validate and improve the generalizability of our findings.
The reference list from the paper itself. Each links out to its DOI / PubMed record.
- 1A robust zero-watermarking scheme for tele-ophthalmological applications J King Saud Univ Comput Inf Sci Singh A Dutta MK 8959082020 https://www.sciencedirect.com/science/article/pii/S 1319157817302951
- 2Epidemiology of diabetic retinopathy and macular oedema: a systematic review Eye Williams R Airey M Baxter H Forrester J Kennedy-Martin T Girach A 96398310 https://www.nature.com/articles/670147610.1038/sj.eye.670147615232600 · doi ↗ · pubmed ↗
- 3Diabetic retinopathy: A predictor of coronary artery disease Egypt Hear J El Demerdash F Refaie W Allakany R Tantawy S Dawood E 63682
- 4Diabetic retinopathy: current understanding, mechanisms, and treatment strategies JCI insight Duh EJ Sun JK Stitt AW 2201710.1172/jci.insight.93751 PMC 551855728724805 · doi ↗ · pubmed ↗
- 5A unified pathophysiological construct of diabetes and its complications Trends Endocrinol Metab Schwartz SS Epstein S Corkey BE Grant SF Gavin Iii JR Aguilar RB Herman ME 6456552820172862989710.1016/j.tem.2017.05.005 · doi ↗ · pubmed ↗
- 6Computer aided diagnosis based on medical image processing and artificial intelligence methods Nucl Instruments Methods Phys Res Sect A Accel Spectrometers, Detect Assoc Equip Stoitsis J Valavanis I Mougiakakou SG Golemati S Nikita A Nikita KS 5915955692006
- 7Detection of diabetic retinopathy using deep learning methodology. In: IOP conference series: materials science and engineering IOP Publishing Mushtaq G Siddiqui F 120492021
- 8The association of diabetic retinopathy and cardiovascular disease: a 13-year nationwide population-based cohort study Int J Environ Res Public Health Hsu CY Lee CM Chou KY Lee CY Chen HC Chiou JY Hsu MY 18202110.3390/ijerph 18158106 PMC 834567234360398 · doi ↗ · pubmed ↗