Crystal structure of dihydroneopterin aldolase from Mycobacterium tuberculosis associated with 8-mercaptoguanine, and development of novel S8-functionalized analogues as inhibitors: Synthesis, enzyme inhibition, in vitro toxicity and antitubercular activity
Alexia de Matos Czeczot, Mauro Neves Muniz, Marcia Alberton Perelló, Éverton Edésio Dinis Silva, Luís Fernando Saraiva Macedo Timmers, Andresa Berger, Laura Calle Gonzalez, Guilherme Arraché Gonçalves, Sidnei Moura, Pablo Machado, Cristiano Valim Bizarro, Luiz Augusto Basso

TL;DR
This study reveals the structure of a key enzyme in tuberculosis bacteria and develops new compounds that inhibit its activity without harming human cells.
Contribution
The study presents novel S8-functionalized 8-mercaptoguanine analogues as potent and selective inhibitors of Mycobacterium tuberculosis FolB enzyme.
Findings
Compound 3e inhibited M. tuberculosis with a minimum inhibitory concentration in the micromolar range.
The compounds showed submicromolar IC50 values against the DHNA enzyme activity of MtFolB.
Compound 3e exhibited no toxicity in HepG2 and Vero cell lines.
Abstract
The crystallographic structure of the FolB enzyme from Mycobacterium tuberculosis (MtFolB), complexed with its inhibitor 8-mercaptoguanine (8-MG), was elucidated at a resolution of 1.95 Å. A novel series of S8-functionalized 8-MG derivatives were synthesised and evaluated as in vitro inhibitors of dihydroneopterin aldolase (DHNA, EC 4.1.2.25) activity of MtFolB. These compounds exhibited IC50 values in the submicromolar range. Evaluation of the activity for five compounds indicated their inhibition mode and inhibition constants. Molecular docking analyses were performed to determine the enzyme-inhibitor intermolecular interactions and ligand conformations upon complex formation. The inhibitory activities of all compounds against the M. tuberculosis H37Rv strain were evaluated. Compound 3e exhibited a minimum inhibitory concentration in the micromolar range. Finally, Compound 3e showed…
Genes, proteins, chemicals, diseases, species, mutations and cell lines named across the full text — each resolved to its canonical identifier and authoritative record.
Click any figure to enlarge with its caption.
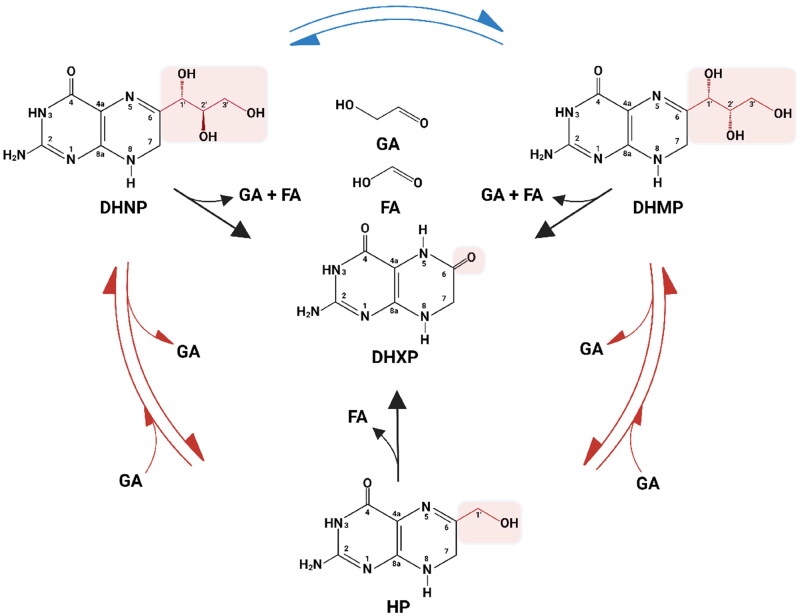 Figure 1
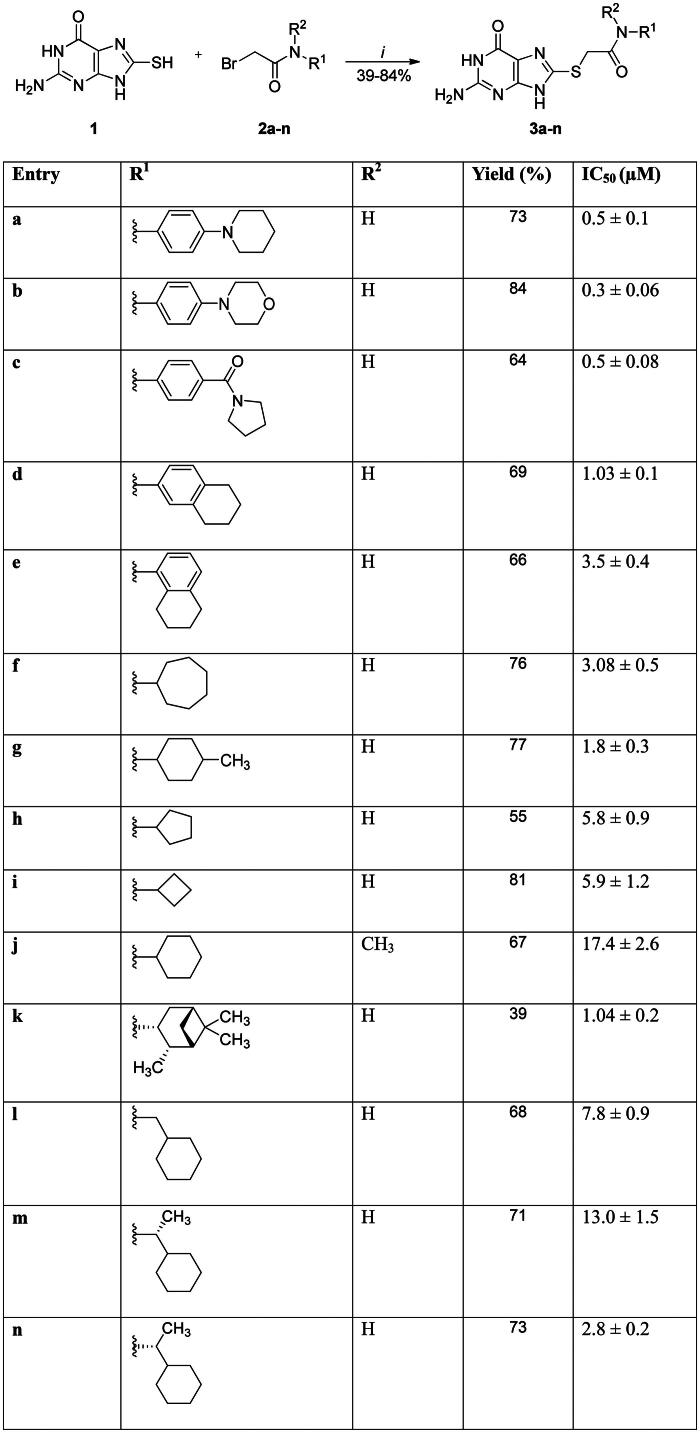 Scheme 1
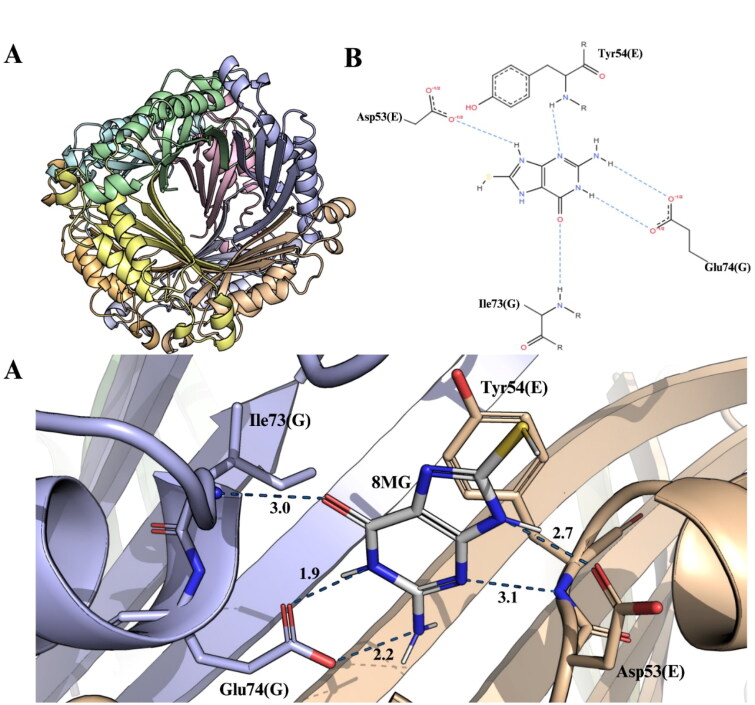 Figure 2
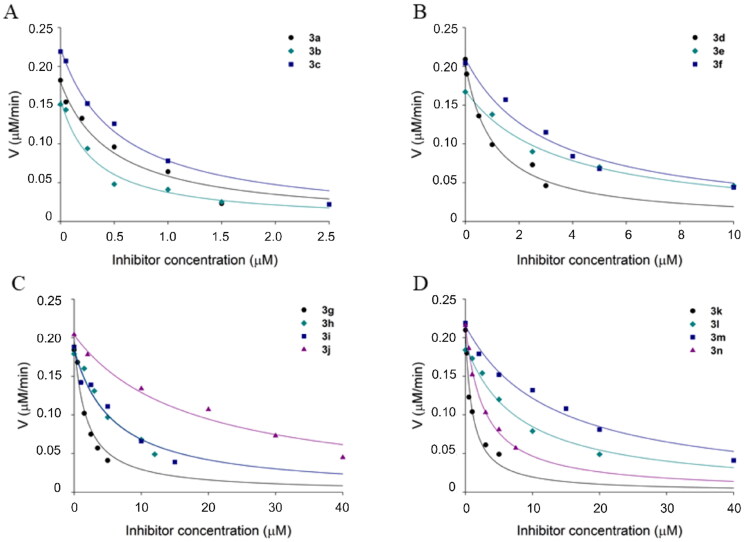 Figure 3
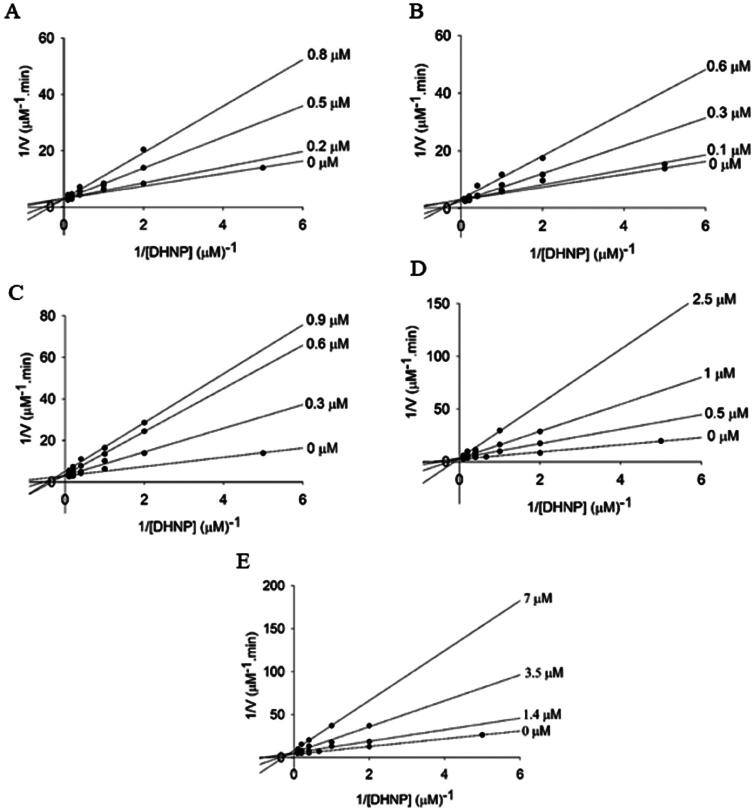 Figure 4
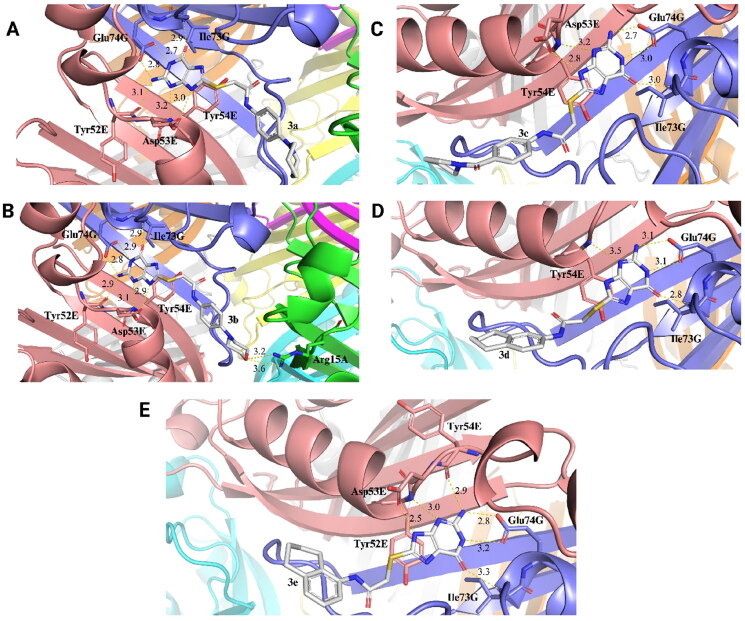 Figure 5
| X-ray wavelenght (Å) | 1.542 |
|---|---|
| Space group | P4212 |
| Unit-cell parameters (a, b, c (Å)/α = β = ɣ (°)) | 81.386, 81.386, 74.862/ 90 |
| Resolution range (Å) | 19.33 − 1.95 (2.02 − 1.95) |
| Total reflections | 34614 (3210) |
| Unique reflections | 18885 (1847) |
| Multiplicity | 1.8 (1.7) |
| Completeness (%) | 97.95 (99.73) |
| 11.45 (2.96) | |
| Rmerge | 0.05041 (0.217) |
| Rmeas | 0.07129 (0.3069) |
| Rpim | 0.05041 (0.217) |
| CC1/2 | 0.997 (0.939) |
| CC* | 0.999 (0.984) |
| Rwork | 0.2048 (0.2655) |
| Rfree | 0.2131 (0.2766) |
| CC(work) | 0.953 (0.909) |
| CC(free) | 0.962 (0.873) |
| Solvent | 282 |
| Residues | 236 |
| Observed RMSD from the ideal geometry | |
| Bond lenghts (Å) | 0.009 |
| Bond angles (°) | 1.09 |
| Ramachandran Plot | |
| Residues in most favoured regions (%) | 99.14 |
| Residues in additionally allowed regions (%) | 0.86 |
| Ramachandran outliers (%) | 0.00 |
| Rotamers outliers (%) | 0.00 |
| Compound | Inhibition mode | |
|---|---|---|
| 3a | 0.4 ± 0.1 | Competitive |
| 3b | 0.3 ± 0.08 | Competitive |
| 3c | 0.3 ± 0.2 / 1.5 ± 0.9 | Non-competitive |
| 3d | 0.2 ± 0.05 | Competitive |
| 3e | 1.4 ± 0.3 / 6.3 ± 1.2 | Non-competitive |
| % of cell viability ± SEM § | ||||
|---|---|---|---|---|
| HepG2 | Vero | |||
| Compound | MTT | Neutral Red | MTT | Neutral Red |
| 3e 100 μM | 96 ± 2 | 104 ± 2 | 94 ± 3 | 96 ± 2 |
| 3e 87.5 μM | 97 ± 2 | 111 ± 3 | 94 ± 10 | 102 ± 3 |
| 3e 75 μM | 108 ± 3 | 100 ± 6 | 115 ± 2 | 96 ± 1 |
- —Banco Nacional de Desenvolvimento Econômico e Social10.13039/501100017654
- —National Institute of Science and Technology on Tuberculosis
Peer Reviews
No public reviews on file for this paper yet. If you reviewed it on a platform where reviews are public (OpenReview, ICLR, NeurIPS, ICML), you can paste yours below so the community can read it here.
Videos
No videos yet. Explain this paper in a talk, walkthrough, or lecture? Add one.
Taxonomy
TopicsBiochemical and Molecular Research · Metabolism and Genetic Disorders · Enzyme Structure and Function
Introduction
Tuberculosis (TB) is an infectious disease, which affects more than 10 million people every year. In 2022, the World Health Organisation (WHO) estimated 1.3 million of deaths from TB1. Numerous efforts have been made to combat this disease, and in 2014, the End TB strategy was adopted with the goal of reducing TB incidence by 80% and TB-related deaths by 90% by 2030, in comparison to 2015 levels2. Unfortunately, the COVID-19 pandemic had a negative impact on TB diagnosis and treatment in 2020 and 2021, reversing the progress made in previous years3. However, in 2022, there was a global recovery in the number of people diagnosed with TB and receiving treatment. Despite this progress, TB remains the major cause of deaths associated with antimicrobial resistance. Consequently, new approaches are required to control the spread of TB and mitigate its impact on the high number of patients and deaths1.
The development of new anti-TB drugs that are effective against the growth of bacilli and act upon novel molecular targets represents a promising strategy4. The FolB enzyme from Mycobacterium tuberculosis (MtFolB) is a potential target for anti-TB drugs due to its essential role in the survival of the bacillus and the absence of FolB homologues in humans5. MtFolB exhibits three activities: aldolase, epimerase, and oxygenase. As an aldolase, this enzyme catalyses the reversible conversion of 7,8-dihydroneopterin (DHNP) to 6-hydroxymethyl-7,8-dihydropterin (HP) and glycolaldehyde (GA) in the folate biosynthesis pathway (Figure 1)6.
Aldolase, epimerase, and oxygenase reactions catalysed by MtFolB. 7,8-dihydroneopterin (DHNP) and 7,8-dihydromonapterin (DHMP) are interconverted by the epimerase activity of MtFolB (blue arrows). Both DHNP and DHMP are reversibly converted to 6-hydroxymethyl-7,8-dihydropterin (HP) and glycolaldehyde (GA) by MtFolB aldolase activity (red arrows). Both DHNP and DHMP are also irreversibly converted to 7,8-dihydroxanthopterin (DHXP), GA and formic acid (FA), while HP are irreversibly converted to DHXP and FA by the MtFolB oxygenase activity (black arrows).
In this context, we have previously synthesised 8-mercaptoguanine (8-MG) derivatives containing benzyl, arylethanone or acetamide groups attached at the S-8 atom position7. 8-MG and its derivatives contain a substructure (H_2_N-C-NH-C = O) common to the substrates, products, and intermediate of the MtFolB reactions. The S8-functionalized derivatives of 8-MG were synthesised to evaluate the activity of the compounds with different substituents and molecular volumes. We have also determined the inhibitory activities of 8-MG and these S8-substituted derivatives against MtFolB. Although we identified the first MtFolB inhibitors, with activities whitin the submicromolar range, none of them was found to affect the growth of M. tuberculosis in vitro7. Therefore, the identification of MtFolB inhibitors possessing antimycobacterial activity remains a key objective.
In this study, we determined the crystallographic structure of MtFolB in complex with 8-MG. The quaternary structure of this complex was found to be in the octameric form, sharing the major structural changes previously observed for the octameric form of the MtFolB bound to the product HP, that was proposed to stabilise the tetramer-tetramer interface and favour the oligomerisation of apo-tetramers8. Moreover, we synthesised 14 novel S8-functionalized analogues of 8-MG (Scheme 1) and assessed their inhibitory activity against MtFolB enzyme by determining their IC_50_ values. We determined the mode and constant of inhibition for 5 compounds and conducted molecular docking to analyse their interactions with enzyme residues. Furthermore, we determined the minimum inhibitory concentration (MIC) for all compounds against the drug-susceptible M. tuberculosis H37Rv strain. Compound 3e exhibited antimycobacterial activity, with a MIC value of 40 µg/mL (0.1 mM). Finally, we assessed the solubility of compound 3e under three different conditions and evaluated its toxicity in cell viability experiments using both HepG2 and Vero cells.
Reagents and reactants. Conditions: i = NaOH (0.5 M), EtOH, 25 °C, 2–6 h.
Materials and methods
Expression and purification of MtFolB
The expression and purification of the recombinant enzyme MtFolB was carried out as previously described5. Briefly, MtFolB was purified using high performance liquid chromatography (HPLC) with the ÄKTA System (GE Healthcare^®^ Life Sciences, Pittsburgh, USA), using three chromatography columns: the anionic exchange column DEAE Sepharose CL6B (GE Healthcare^®^ Life Sciences, Pittsburgh, USA), the hydrophobic interaction column Butyl Sepharose High Performance HiLoad16/10 (GE Healthcare^®^ Life Sciences, Pittsburgh, USA) and the size exclusion column HiLoad Superdex 200 26/60 (GE Healthcare^®^ Life Sciences, Pittsburgh, USA).
Crystallisation and data collection
Co-crystallisation of MtFolB and the inhibitor 8-MG was performed in the space group P42_1_2. The ligand was dissolved in DMSO at concentration of 5 mg/mL. A solution containing MtFolB and 8-MG was prepared by mixing 12 mg/mL of the enzyme with 10% of the ligand solution, obtaining a final concentration of 0.5 mM of 8-MG. Then, the solution was centrifuged at 16,000 g for 10 min at 4 °C, followed by incubation for approximately 2 h at 18 °C, before setting up the crystallisation conditions. Hanging drops were prepared mixing 1 µL of MtFolB/8-MG solution and 1 µL of reservoir solution containing Bis-Tris 0.1 M pH 6.5 and NaCl 3 M. The crystals were cryoprotected with 10% of glycerol. X-ray diffraction data were collected at 1.542 Å wavelength using Synchrotron (Centro Nacional de Biologia Estrutural e Bioimagem (CENABIO), Universidade Federal do Rio de Janeiro (UFRJ, RJ, Brazil). The molecular replacement was conducted using Phaser Crystallographic Software9, with the crystallographic structure of MtFolB complexed with 6-hydroxymethyl-7,8-dihydropterin (HP) (PDB ID 1NBU)8 as a template. The resulting data were processed using Phenix10 software. The interactions between MtFolB and 8-MG were analysed using PoseView11. The PISA software12 was used to predict the probable quaternary structure of the MtFolB/8-MG complex by assembling the macromolecular structure from X-ray crystallography data. An omit map of the bound 8-MG ligand was created by removing the ligand from the structure and undergoing 3 cycles of gradient energy minimisation using Phenix software.
Synthesis
All reagents, chemicals and solvents were obtained from commercial sources and used as received, without any additional purification methods. Ethanol, dichlorometane and methanol were obtained from Química Moderna (Barueri, Brazil). Acetic acid (glacial), acetonitrile (high performance liquid chromatography (HPLC) grade), and methanol (HPLC grade) were obtained from Merck KGaA (Darmstadt, Germany). Sodium hydroxide was purchased from Êxodo científica (Sumaré, Brazil). Amines, bromoacetyl chloride, 4-(Dimethylamino)pyridine (DMAP) and DMSO-d6 were obtained from Sigma-Aldrich Corporation (Saint Louis, USA). Finally, 8-MG was obtained from Acros Organics B.V.B.A. (Geel, Belgium). The melting points of the synthesised compounds were accurately determined using a Microquímica MQAPF-302 melting point apparatus.^1^H and ^13^C Nuclear Magnetic Ressonance (NMR) spectra were obtained with an Avance III HD Bruker spectrometer (Bruker Corporation, Fällanden, Switzerland). This spectrometer operated at frequencies of 400 MHz for ^1^H NMR and 100 MHz for ^13^C NMR, utilising standard pulse sequences. The chemical shifts (δ) are reported in parts per million (ppm) and were referenced to dimethyl sulfoxide-d6 (DMSO-d6) as the solvent and tetramethylsilane (TMS) as the internal standard. High-resolution mass spectrometry (HRMS) analyses were conducted on Bruker Micro TOF-QII instrument, employing electrospray ionisation (ESI) at the University of Caxias do Sul (UCS). The relative purity of the molecules was assessed using a Dionex Ultimate 3000 High-Performance Liquid Chromatography (HPLC) system (Thermo Fischer Scientific Inc., Waltham, MA, USA). This system is equipped with a dual pump, an automatic injector, and a UV detector. Stock solutions of the compounds were prepared at a concentration of 1.0 mg/mL in a mixture of acetonitrile and methanol (1:1, v/v). These solutions were further diluted to a concentration of 0.5 mg/mL for the HPLC analysis.
General procedure for synthesis of compounds 3a–n
The synthesis of compounds 3a–n was carried out following previously established methods7^,^13. Briefly, 8-MG (1 mmol) was dissolved in 0.5 M NaOH (5 mL), forming a clear solution. To this, the corresponding bromoacetamides (1.2 mmol) was added in ethanol (1 mL). The reaction mixture was stirred for 2 to 6 h at a constant temperature of 25 °C. Subsequently, 5% acetic acid was added gradually until the pH reached 5. This adjustment in pH led to the formation of a precipitate, which was collected as an amorphous solid. When further purification was necessary, recrystallization was performed using methanol.
2-((2-amino-6-oxo-6,9-dihydro-1H-purin-8-yl)thio)-N-(4-(piperidin-1-yl)phenyl)acetamide (3a). Yield: 73%; MP: 258–260 °C (dec); UHPLC: 97.2% (tR = 12.18 min); ^1^H NMR (400 MHz, DMSO-d6) δ ppm 1.42 − 1.65 (m, 6H), 2.88 − 3.09 (m, 4H), 3.96 (s, 2H), 6.61 (s, 2H), 6.85 (d, J = 9.1 Hz, 2H), 7.43 (d, J = 9.1 Hz, 2H), 10.54 (s, 1H); ^13^C NMR (101 MHz, DMSO-d6) δ ppm 23.79, 25.22 (2 C), 36.24, 50.02 (2 C), 116.11 (2 C), 120.14 (2 C), 130.61, 143.84, 148.06, 153.27, 155.45, 155.89, 165.85, 173.67; FTMS (ESI) m/z: 400.1526 [M + H]^+^; calc. for C_18_H_22_N_7_O_2_S: 400.1550.
2-((2-amino-6-oxo-6,9-dihydro-1H-purin-8-yl)thio)-N-(4-morpholinophenyl)acetamide (3b). Yield: 84%; MP: 326–328 °C (dec); UHPLC: 90.41% (tR = 13.38 min); ^1^H NMR (400 MHz, DMSO-d6) δ ppm 3.03 (t, J = 4.5 Hz, 4H), 3.72 (t, J = 4.5 Hz, 4H), 4.05 (s, 2H), 6.35 (s, 2H), 6.89 (d, J = 8.5 Hz, 2H), 7.45 (d, J = 8.5 Hz, 2H), 10.28 (s, 1H); ^13^C NMR (101 MHz, DMSO-d6) δ ppm 36.17, 48.81 (2 C), 66.00 (2 C), 115.37 (2 C), 119.95 (2 C), 131,27, 144.44, 147.19, 152.92, 155.40, 156.29, 166.02, 173.69; FTMS (ESI) m/z: 402.1343 [M + H]^+^; calc. for C_17_H_20_N_7_O_3_S: 402.1343.
2-((2-amino-6-oxo-6,9-dihydro-1H-purin-8-yl)thio)-N-(4-(pyrrolidine-1-carbonyl)phenyl)acetamide (3c). Yield: 64%; MP: 237–239 °C (dec); UHPLC: 96.59% (tR = 14.15 min); ^1^H NMR (400 MHz, DMSO-d6) δ ppm 1.76 − 1.89 (m, 4H), 3.37 − 3.46 (m, 4H), 3.98 (s, 2H), 6.70 (s, 2H), 7.34 (s, 1H), 7.48 (d, J = 8.2 Hz, 2H), 7.67 (d, J = 8.0 Hz, 2H); ^13^C NMR (101 MHz, DMSO-d6) δ ppm 23.79, 25.93, 36.24, 45.90, 48.89, 118.02 (2 C), 128.01 (2 C), 131.50, 140.45, 151.13, 152.83, 155.85, 163.73, 167.54, 167. 76, 174.28; FTMS (ESI) m/z: 414.1335 [M + H]^+^; calc. for C_18_H_20_N_7_O_3_S: 414.1343.
2-((2-amino-6-oxo-6,9-dihydro-1H-purin-8-yl)thio)-N-(5,6,7,8-tetrahydronaphthalen-2-yl)acetamide (3d). Yield: 69.2%; MP: 294–295 °C (dec); UHPLC: 94.43% (tR = 15.74 min); ^1^H NMR (400 MHz, DMSO-d6) δ ppm 1.63 − 1.76 (m, 4H), 2.62 − 2.68 (m, 4H), 3.99 (s, 2H), 6.47 (s, 2H), 6.95 (d, J = 8.2 Hz, 1H), 7.26 (d, J = 8.3 Hz, 1H), 7.33 (s, 1H), 10.70 (s, 1H); ^13^C NMR (101 MHz, DMSO-d6) δ ppm 22.61, 22.74, 28.15, 28.89, 36.27, 115.57, 116.58, 119.19, 128.93, 131.57, 136.33, 136.70, 152.99, 155.29, 156.00, 166.24, 173.22; FTMS (ESI) m/z: 371.1231 [M + H]^+^; calc. for C_17_H_19_N_6_O_2_S: 371.1285.
2-((2-amino-6-oxo-6,9-dihydro-1H-purin-8-yl)thio)-N-(5,6,7,8-tetrahydronaphthalen-1-yl)acetamide (3e). Yield: 66%; MP: 260–261 °C (dec); UHPLC: 91.41% (tR = 15.01 min); ^1^H NMR (400 MHz, DMSO-d6) δ ppm 1.52 − 1.75 (m, 4H), 2.45 − 2.56 (m, 2H), 2.62 − 2.74 (m, 2H), 4.01 (s, 2H), 6.65 (s, 2H), 6.85 (d, J = 7.6 Hz, 1H), 7.03 (t, J = 7.8 Hz, 1H), 7.38 (d, J = 8.0 Hz, 1H), 9.92 (s, 1H).^13^C NMR (101 MHz, DMSO-d6) δ ppm 22.16, 22.33, 24.10, 29.18, 35.64, 115.79, 121.02, 124.89, 125.57, 129.74, 135.85, 137.25, 153.06, 155.50, 156.38, 167.08, 173.82; FTMS (ESI) m/z: 371.1239 [M + H]^+^; calc. for C_17_H_19_N_6_O_2_S: 371.1285.
2-((2-amino-6-oxo-6,9-dihydro-1H-purin-8-yl)thio)-N-cycloheptylacetamide (3f). Yield: 76%; MP: 292–294 °C (dec); UHPLC: 90.12% (tR = 14.91 min); ^1^H NMR (400 MHz, DMSO-d6) δ ppm 1.29 − 1.46 (m, 5H), 1.46 − 1.63 (m, 4H), 1.67 − 1.80 (m, 3H), 3.73 (tt, J = 8.2, 4.0 Hz, 1H), 3.77 (s, 2H), 6.19 (s, 2H), 8.02 (d, J = 7.8 Hz, 1H); ^13^C NMR (101 MHz, DMSO-d6) δ ppm 23.35 (2 C), 27.35 (2 C), 33.73 (2 C), 35.31, 49.73, 114.99, 143.11, 152.86, 154.69, 155.28, 166.08; FTMS (ESI) m/z: 337.1448 [M + H]^+^; calc. for C_14_H_21_N_6_O_2_S: 337.1441.
2-((2-amino-6-oxo-6,9-dihydro-1H-purin-8-yl)thio)-N-(4-methylcyclohexyl)acetamide (3 g). Yield: 77%; MP: 282–284 °C (dec); UHPLC: 91.07% (tR = 15.37 min); ^1^H NMR (400 MHz, DMSO-d6) δ ppm 0.81 (dd, J = 31.1, 6.2 Hz, 3H), 0.87 − 1.00 (m, 1H), 1.11 (t, J = 12.8 Hz, 2H), 1.29 − 1.46 (m, 2H), 1.49 − 1.57 (m, 1H), 1.68 (dd, J = 41.8, 13.2 Hz, 3H), 3.35 − 3.48 (m, 1H), 3.79 (s, 2H), 6.81 (d, J = 18.4 Hz, 2H), 8.33 (dd, J = 19.0, 7.7 Hz, 1H); ^13^C NMR (101 MHz, DMSO-d6) δ ppm 23.69, 28.92, 29.06, 31.41, 32.09, 33.47, 35.49, 48.18, 153.33, 153.47, 155.74, 166.82, 167.46, 174.41; FTMS (ESI) m/z: 337.1397 [M + H]^+^; calc. for C_14_H_21_N_6_O_2_S: 337.1441.
2-((2-amino-6-oxo-6,9-dihydro-1H-purin-8-yl)thio)-N-cyclopentylacetamide (3h). Yield: 55%; MP: 280–282 °C (dec); UHPLC: 91.56% (tR = 13.34 min); ^1^H NMR (400 MHz, DMSO-d6) δ ppm 1.31 − 1.43 (m, 2H), 1.43 − 1.54 (m, 3H), 1.56 − 1.65 (m, 2H), 1.69 − 1.81 (m, 1H), 3.73 (s, 2H), 3.91 − 4.06 (m, 1H), 6.53 (s, 2H), 8.42 − 8.48 (m, 1H); ^13^C NMR (101 MHz, DMSO-d6) δ ppm 23.02 (2 C), 31.89 (2 C), 35.16, 50.46, 115.75, 144.59, 152.81, 155.54, 167.35, 173.99; FTMS (ESI) m/z: 309.1124 [M + H]^+^; calc. for C_12_H_17_N_6_O_2_S: 309.1128.
2-((2-amino-6-oxo-6,9-dihydro-1H-purin-8-yl)thio)-N-cyclobutylacetamide (3i). Yield: 81%; MP: 285–287 °C (dec); UHPLC: 92.62% (tR = 13.58 min); ^1^H NMR (400 MHz, DMSO-d6) δ ppm 1.51 − 1.67 (m, 2H), 1.79 − 1.96 (m, 2H), 2.04 − 2.20 (m, 2H), 3.77 (s, 2H), 4.00 − 4.25 (m, 1H), 6.91 (s, 2H), 8.86 (d, J = 7.7 Hz, 1H); ^13^C NMR (101 MHz, DMSO-d6) δ ppm 14.73, 30.13 (2 C), 35.29, 44.23, 115.87, 153.30, 156.05, 156.73, 166.87, 174.98; FTMS (ESI) m/z: 295.0978 [M + H]^+^; calc. for C_11_H_15_N_6_O_2_S: 295.0972.
2-((2-amino-6-oxo-6,9-dihydro-1H-purin-8-yl)thio)-N-cyclohexyl-N-methylacetamide (3j). Yield: 67%; MP: 272–274 °C (dec); UHPLC: 91.13% (tR = 14.43 min); ^1^H NMR (400 MHz, DMSO-d6) δ ppm 0.97 − 1.16 (m, 1H), 1.16 − 1.35 (m, 1H), 1.34 − 1.54 (m, 3H), 1.53 − 1.82 (m, 5H), 2.80 (d, J = 71.4 Hz, 3H), 3.55 − 3.72 (m, 1H), 4.24 (d, J = 18.6 Hz, 2H), 6.91 (s, 2H); ^13^C NMR (101 MHz, DMSO-d6) δ ppm 24.01, 25.05, 25.31, 27.13, 29.11, 30.17, 36.26, 52.47, 56.16, 115.29, 153.61, 155.75, 165.46, 166.68, 174.83; FTMS (ESI) m/z: 337.1436 [M + H]^+^; calc. for C_14_H_21_N_6_O_2_S: 337.1441.
2-((2-amino-6-oxo-6,9-dihydro-1H-purin-8-yl)thio)-N-((1S,2S,3R,5R)-2,6,6-trimethylbicyclo [3.1.1] heptan-3-yl)acetamide (3k). Yield: 39%; MP: 289–291 °C (dec); UHPLC: 93.07% (tR = 15.73 min); ^1^H NMR (400 MHz, DMSO-d6) δ ppm 0.84 − 1.07 (m, 6H), 1.18 (s, 3H), 1.48 (ddt, J = 13.4, 7.0, 3.6 Hz, 1H), 1.74 (s, 2H), 1.85 (qd, J = 7.1, 2.5 Hz, 2H), 2.24 − 2.36 (m, 2H), 3.81 (s, 2H), 3.96 − 4.08 (m, 1H), 6.83 (s, 2H), 8.58 (d, J = 8.4 Hz, 1H); ^13^C NMR (101 MHz, DMSO-d6) δ ppm 20.62, 23.15, 27.85, 33.99, 35.43, 36.00, 38.08, 41.00, 44.27, 47.19, 47.22, 115.70, 153.43, 155.85, 156.20, 167.21, 174.76; FTMS (ESI) m/z: 377.1745 [M + H]^+^; calc. for C_17_H_25_N_6_O_2_S: 377.1754.
2-((2-amino-6-oxo-6,9-dihydro-1H-purin-8-yl)thio)-N-(cyclohexylmethyl)acetamide (3 l). Yield: 68%; MP: 262–263 °C (dec); UHPLC: 90.14% (tR = 15.08 min); ^1^H NMR (400 MHz, DMSO-d6) δ ppm 0.81 (q, J = 13.5, 11.7 Hz, 2H), 0.95 − 1.20 (m, 2H), 1.32 (dtd, J = 15.6, 7.6, 4.1 Hz, 1H), 1.49 − 1.72 (m, 6H), 2.91 (t, J = 6.5 Hz, 2H), 3.81 (s, 2H), 6.79 (s, 2H), 8.37 (t, J = 5.8 Hz, 1H); ^13^C NMR (101 MHz, DMSO-d6) δ ppm 25.38 (2 C), 25.95, 30.23 (2 C), 35.23, 37.35, 45.13, 115.65, 153.37, 155.76, 156.19, 167.78, 174.53; FTMS (ESI) m/z: 337.1404 [M + H]^+^; calc. for C_14_H_21_N_6_O_2_S: 337.1441.
(S)-2-((2-amino-6-oxo-6,9-dihydro-1H-purin-8-yl)thio)-N-(1-cyclohexylethyl)acetamide (3 m). Yield: 71%; MP: 294–296 °C (dec); UHPLC: 91.66% (tR = 14.70 min); ^1^H NMR (400 MHz, DMSO-d6) δ ppm 0.84 (dtd, J = 12.4, 9.2, 3.5 Hz, 2H), 0.97 (d, J = 6.8 Hz, 3H), 0.97 − 1.17 (m, 3H), 1.21 (tdq, J = 13.2, 6.7, 3.2 Hz, 1H), 1.59 (q, J = 15.1, 13.5 Hz, 5H), 3.58 (dq, J = 13.4, 6.9 Hz, 1H), 3.81 (q, J = 15.4, 13.6 Hz, 2H), 6.35 (s, 2H), 7.96 (d, J = 8.6 Hz, 1H); ^13^C NMR (101 MHz, DMSO-d6) δ ppm 17.50, 25.70 (2 C), 25.91, 28.38, 28.65, 35.47, 42.34, 48.98, 117.10, 140.64, 153.30, 153.44, 155.61, 166.56; FTMS (ESI) m/z: 351.1596 [M + H]^+^; calc. for C_15_H_35_N_6_O_2_S: 351.159
(R)-2-((2-amino-6-oxo-6,9-dihydro-1H-purin-8-yl)thio)-N-(1-cyclohexylethyl)acetamide (3n). Yield: 73%; MP: 289–291 °C (dec); UHPLC: 96.76% (tR = 14.73 min); ^1^H NMR (400 MHz, DMSO-d6) δ ppm 0.87 (tdd, J = 14.1, 10.2, 2.8 Hz, 2H), 0.97 (d, J = 6.7 Hz, 3H), 1.00 − 1.17 (m, 3H), 1.25 (s, 1H), 1.48 − 1.71 (m, 5H), 3.48 − 3.67 (m, 1H), 3.77 (q, 2H), 6.44 (s, 2H), 8.03 (d, J = 8.6 Hz, 1H); ^13^C NMR (101 MHz, DMSO-d6) δ ppm 17.13, 25.40 (2 C), 25.63, 28.11, 28.40, 35.13, 42.11, 48.75, 115.50, 143.85, 152.87, 155.19, 156.01, 166.94, 173.54; FTMS (ESI) m/z: 351.1589 [M + H]^+^; calc. for C_15_H_23_N_6_O_2_S: 351.1598.
In vitro MtFolB inhibition assays
The 14 S8-substituted 8-MG compounds synthesised were evaluated as inhibitors of MtFolB using the continuous fluorescence-based enzyme activity method previously described7. These assays were performed on RF-5301 spectrofluorophotometer (Shimadzu) with an excitation wavelength of 365 nm and fluorescence emission at 525 nm, monitoring for 6 min the conversion of 7,8-dihydroneopterin (DHNP) to 6-hydroxymethyl-7,8-dihydropterin (HP) and glycolaldehyde (GA) by means of an increase in fluorescence due to HP formation. The standard reaction was carried out at 25 mM Tris, 50 mM NaCl, 5% glycerol pH 8.0 at 25 °C. For each reaction condition, we performed control reactions including (1) a buffer-only control; (2) a buffer + DHNP (substrate) + DMSO/inhibitor control (no enzyme), and (3) a buffer + enzyme control (neither DHNP nor DMSO/inhibitor). The fluorescence values from control (1) were added, and those from controls (2) and (3) were subtracted from the reaction fluorescence to provide just the fluorescence of the reaction product7. The concentration of the inhibitor necessary to reduce 50% of the enzyme activity (IC_50_)14 was determined for each synthesised compound to provide its potency of inhibition. The IC_50_ values were obtained by determining the initial velocity curves of enzymatic reactions using 0.3 µM of MtFolB, 1.5 µM of DHNP and different concentrations of the synthesised compounds (dissolved in DMSO) until enzymatic activity reaches zero. The maximal concentration of DMSO in this assay was 10% and the concentration ranges of each compound were: 3a 0.05 − 1.5 µM; 3b and 3c 0.05 − 2.5 µM; 3d 0.05 − 3 µM; 3e and 3 l 1 – 20 µM; 3f 1.5 – 10 µM; 3 g 0.5 – 5 µM; 3h 1.5 – 12 µM; 3i 1 – 15 µM; 3j and 3 m 2 – 40 µM; 3k 0.2 – 5 µM; 3n 0.5 − 7.5 µM. The maximal rate of enzymatic reaction at each condition was determined in control reactions performed in the absence of inhibitor and presence of 10% DMSO at the same conditions. The IC_50_ values were estimated using Equation (1), where Vi and V0 are, respectively, the reaction velocity in the presence and in the absence of inhibitor (I):
The time-dependent inhibitory activity was evaluated preincubating 0.3 µM of the MtFolB (final concentration) with a fixed inhibitor concentration defined based on IC_50_ value for each compound (Scheme 1) (final concentration of 0.5 µM for 3a; 0.35 µM for 3b; 0.55 µM for 3c; 1 µM for 3d and 3k; 3 µM for 3e, 3f and 3n; 2 µM for 3 g; 6 µM for 3h and 3i; 15 µM for 3j; 8 µM for 3 l; and 12 µM for 3 m), then aliquots were taken after 5, 10, 20 and 40 min of preincubation and added to the reaction mixture described above. The percentage of inhibition was calculated after monitoring change in the initial velocity with time. As a control, MtFolB was preincubated with DMSO at a final concentration of 10% and added to the reaction mixture.
The mode of inhibition and the inhibition constants (Ki and/or Kis) were defined for the compounds 3a-e. There are three categories for the inhibition mode: competitive, where inhibitor and substrate binding are mutually exclusive; non-competitive, if the inhibitor can bind to both the free enzyme and the enzyme-substrate complex; or uncompetitive, when the inhibitor binds only to the enzyme-substrate complex14. For each compound, 3 curves were performed with fixed-varied inhibitor concentration and varying the DHNP concentration until saturation of enzyme activity. For the compound 3a the fixed-varied concentrations were 0.2 μM, 0.5 μM and 0.8 μM (varying DHNP 0.5 – 10 μM). For the compound 3b the fixed-varied concentrations were 0.1 µM (varying DHNP 0.2 – 10 µM); 0.3 μM (varying DHNP 0.5 – 10 μM) and 0.6 μM (varying DHNP 0.5 – 15 μM). For the compound 3c the fixed-varied concentrations were 0.3 μM, 0.6 μM and 0.9 μM (varying DHNP 0.5 – 10 μM). For the compound 3d the fixed-varied concentrations were 0.5 μM, 1 μM (varying DHNP 0.5 – 10 μM) and 2.5 μM (varying DHNP 1 – 10 μM). For the compound 3e the fixed-varied concentrations were 1.4 µM, 3.5 µM (varying DHNP 0.5 – 10 µM) and 7 µM (varying DHNP 1 – 10 µM). Furthermore, we performed a control experiment with 10% DMSO in the absence of inhibitors varying the DHNP concentration until saturation (0.2 – 10 µM). The straight-line patterns obtained were used to define the mode of inhibition. The diagnostic signature of a competitive inhibitor is a set of lines that intersect on the y-axis, for non-competitive inhibitors the pattern of intersection is to the left of the y-axis and for uncompetitive inhibitors the lines are parallel to each other14. The inhibition constants were calculated using Equation (2) for competitive inhibitors or Equation (3) for non-competitive inhibitors, where [I] is the inhibitor concentration, [S] is the substrate concentration, KM is the Michaelis-Menten constant, V_max_ is the maximum velocity, Kis is the inhibition constant for the enzyme-substrate complex, and Kii is the inhibition constant for the enzyme-substrate-inhibitor complex.
Molecular docking studies
The prediction of the most favourable poses of the synthesised compounds into the active site of MtFolB and the estimated binding energy were obtained by molecular docking. The crystallographic structure of MtFolB complexed with 8-mercaptoguanine (8-MG) obtained in this study (section Crystallisation and data collection) was used in these efforts. The MtFolB structure was aligned to the PDB structure 1NBU using PyMOL v 2.5 software15 and prepared adding all hydrogens atoms and removing the ligand from chain E using Gold v2023.216. Before conducting the docking experiments, a redocking procedure was performed to establish the docking protocol that accurately reproduces the in vitro experimental data in these simulations, with the value of root-mean-square deviation (RMSD) < 1.0 Å. The redocking was carried out using Gold v2023.2 with GOLD default parameters. The extracted heteroatoms 8-MG from chain E of the crystallographic structure of MtFolB-8-MG complex corresponds to the ligand and the reference ligand, and the binding site was defined within 10 Å radius of the coordinates × 21.339 y − 24.725 z 9.105, which corresponds to the nitrogen atom 69 from 8-MG. The GoldScore and ChemPLP were the score and rescore function, respectively, the GA runs was 20. The docking experiments were performed with the same protocol of the redocking using the prepared MtFolB crystallographic structure. The ligand structures were drawn on Chemdraw (RRID:SCR_016768), then 3D structures were generated and prepared using Avogadro v1.1.1.17 The hydrogens atoms for pH 8 were added in the molecules, because it is the condition used during enzyme inhibition studies (section In vitro MtFolB inhibition assays), and the MMFF94 force field18 was then applied. The protein complexes were visualised in PyMOL v2.515 and the interactions were analysed using PoseView11.
Determination of minimum inhibitory concentration
The synthesised compounds were evaluated for their ability to inhibit the growth of M. tuberculosis H37Rv strain (ATCC 27294) using the colorimetric resazurin reduction microplate assay (REMA) to determine the minimum inhibitory concentration (MIC)19. The MIC represents the lowest concentration of the compound that completely prevents visible growth of the bacillus20. Isoniazid (INH) and rifampicin (RIF) were the drug controls in this assay. The stock solutions for all compounds were prepared at 2 mg/mL in DMSO (Sigma-Aldrich) and stored at −20 °C. Working solutions were freshly prepared at the time of experiment, diluting the compounds in Difco^TM^ Middlebrook 7H9 broth (Becton, Dickinson and Company – BD) supplemented with 10% BBL^TM^ Middlebrook ADC enrichment (albumin, dextrose and catalase – BD) with DMSO at a final concentration of 5% at the solubility limit of each compound, without forming crystals. For each compound, we performed 10-point (for INH, RIF, 3d, 3h, 3k and 3n) or 6-point (for 3a-c, 3e-g, 3i, 3j, 3 l and 3 m) 2-fold serial dilutions in 100 µL of Middlebrook 7H9 medium with 10% Middlebrook ADC enrichment directly in 96-well plates. The concentrations ranged from 10 to 0.02 µg/mL for INH and 3d; from 1.25 to 0.002 µg/mL for RIF; from 10 to 0.31 µg/mL for 3a; from 40 to 1.25 µg/mL for 3b, 3c, 3e-g, 3i, 3j, 3 l and 3 m; and from 40 to 0.08 µg/mL for 3h, 3k and 3n. M. tuberculosis was cultured in Middlebrook 7H9 broth containing 10% BD Difco ^™^ BBL ^™^ Middlebrook OADC enrichment (oleic acid, albumin, dextrose, catalase), 0.05% Tween 80 (Sigma-Aldrich) and 0.2% glycerol (Sigma-Aldrich) at 37 °C to an optical density at 600 nm (OD_600_) of 0.6 to 0.8. Then, mycobacterial cultures were suspended by vortexing with sterile glass beads (1 mm) for 3 min and left to rest for 15 min. The supernatant was measured at OD_600_ and aliquots were stored at −80 °C. Bacterial cultures were then diluted to a theoretical OD_600_ of 0.006 in Middlebrook 7H9 broth supplemented with 10% Middlebrook ADC enrichment and transferred to 96-well plates (100 µL/well). The final concentration of DMSO in the assay was 2.5%. Growth controls without drugs and sterility controls without mycobacteria were included on each plate. The plates were covered, sealed with parafilm, and incubated at 37 °C for 7 days. A 60 µL solution of 0.01% resazurin (Sigma-Aldrich) was added on each well of the plate before a final incubation step at 37 °C for 48 h. The MIC values were obtained by determining the lower compound concentration at which no colour change from blue (growth inhibition) to pink (indicating growth) is observed. Three independent experiments were performed, and MIC values were considered the most frequent compound concentration that inhibited the visible growth of bacilli.
Cell viability evaluation
Cell viability assays in the presence of compound 3e were performed in both Vero (BCRJ code 0245) and HepG2 (BCRJ code 0291) cells using MTT (3-[4,5-dimethylthiazol-2-yl]-2,5 diphenyl tetrazolium bromide)21 and neutral red uptake (NRU)22 methods. Both cell lines were grown in Dulbecco’s Modified Eagle Medium (DMEM-Gibco, Grand Island, NY, USA) supplemented with 10% or 20% inactivated foetal bovine serum (FBS- Invitrogen) for Vero and HepG2, respectively, 1% penicillin (Gibco) and streptomycin (Gibco), and 0.1% fungizone (Gibco). The experiments were performed in 96-well plates. First, cells were seeded at 6 x 10^3^ (Vero) or 7 x 10^3^/well (HepG2) and incubated overnight at 37 °C under a 5% CO_2_ atmosphere. Then, the medium was removed and replaced with fresh medium containing the compound at a final concentration of 75 µM, 87.5 µM, or 100 µM with DMSO at a final concentration of 0.8%. Cells were incubated during 72 h at 37 °C under a 5% CO_2_ atmosphere. For the MTT assay, the medium was removed after the incubation and replaced with MTT reagent (Sigma-Aldrich) at 5 mg/mL, and then the cells were incubated for 4 h. DMSO was used to solubilise formazan crystals. The absorbance was measured at 570 nm using microplate reader (EZ Read 400 microplate reader, Biochrom, Cambridge, UK). Precipitated purple formazan crystals were directly proportional to the number of live cells with mitochondrial metabolism. For the NRU assay, after the incubation with the compound, the media was removed and 200 µL of neutral red dye solution (Sigma-Aldrich) at 25 µg/mL prepared in serum-free medium was added to each well. The plate was then incubated for 3 h at 37 °C under 5% CO_2_. After this time, cells were washed twice with PBS, followed by incubation with 100 μL of a desorb solution (ethanol/acetic acid/water, 1:50:49) for 30 min, with gentle shaking to extract neutral red dye from the viable cells. The absorbance was measured at 562 nm using microplate reader (EZ Read 400 microplate reader, Biochrom, Cambridge, UK). Treated control wells (0.8% DMSO) were used as references for maximum cell viability (100%). Three independent experiments were performed, and the data were expressed as the means of cell viability ± the standard error of the means. Statistical analysis was performed using one-way ANOVA analysis of variance followed by Dunett’s Multiple Comparison Test post-test using GraphPad Prism 9.0.0 (San Diego, CA, USA).
Solubility assay
The solubility of the compound 3e was evaluated under three pH conditions: pH 1.2 (HCl 0.1 M); pH 7.4 (PBS 1X); and pH 9.1 (NH_4_HCO_3_ 0.1 M). For this assay, we prepared a suspension of compound 3e at 1 mg/mL in each buffer solution by vortexing it for 1 min. Then, the suspension was kept under constant shaking for 4 h at 25 °C. Subsequently, the suspension was centrifuged at 13,000 rpm for 15 min at 25 °C. The supernatant was quantified by ultra-high-performance liquid chromatography (UHPLC) using single-point calibration of a known concentration of the compound in DMSO. The experiment was performed in triplicate.
Results and discussion
The crystallographic structure of MtFolB complexed with 8-MG was solved (Figure 2). The crystals diffracted at 1.95 Å resolution and were resolved in the space group P42_1_2, with two MtFolB chains in each asymmetric unit. The data collection and structure refinement are summarised in Table 1. To verify the presence of the ligand 8-MG in the resolved structure, the omit map of this ligand was generated. Fo-Fc electron density (green) is contoured to 2 σ, indicating evidence of a bound ligand (Figure S1).
Three-dimensional structure of octameric MtFolB complexed with 8-MG and their 2D and 3D interactions representation. (A) The 3D crystallographic structure of MtFolB complexed with 8-MG revels that MtFolB forms an octamer upon interaction with 8-MG. MtFolB is represented as cartoon, with each chain is represented in a distinct colour: A (green), B (cyan), C (magenta), D (yellow), E (salmon), F (gray), G (slate blue), and H (orange). 8-MG is present between each monomer and is represented in stick model. (B) 2D interaction diagrams between 8-MG and MtFolB residues, with hydrogen bonds (black) and π–π stacking interactions (green) shown in dashed lines. (C) An enlarged view of 3D interaction with 8-MG. The main residues that interact by polar contacts with 8-MG are shown as sticks. 3D figures were generated using PyMOL v2.5 and 2D figures using PoseView11.
We found an octamer as the most likely quaternary structure of this complex in solution (Figure 2A). Interestingly, Goulding et al.8 have shown that MtFolB is unique among known FolB enzymes for the fact that the apoenzyme is a tetramer in solution. However, when in complex with the reaction product HP (PDB ID 1NBU), MtFolB assumes the basic octameric state of FolB homologs8. They presented a substrate-driven oligomerisation model to explain this difference in oligomeric structure, in which conformational changes induced by substrate binding stabilise the tetramer-tetramer interface favouring the formation of the octamer complex. Specifically, they observed that Loop L1 is disordered and loops L2 and L4 have shifted positions in the tetrameric apo form. Additionally, helix α2a is disordered in the tetrameric structure. The octameric structure of MtFolB in complex with 8-MG also presents these major structural changes when compared to the apo-tetrameric form. Loop L1 and the α2a-helix are ordered, while loops L2 and L4 also have shifted positions. Therefore, binding of inhibitor 8-MG to MtFolB induced the major structural changes previously observed upon substrate binding (DHNP), product formation (HP + GA), and complex formation with HP, both in terms of quaternary structure and local rearrangements of loops and helices.
The interaction between MtFolB and 8-MG, located at chain E, was assessed using PoseView11 and are summarised in Table S1. The 2D diagram of these interactions are represented in Figure 2(B). 8-MG (1) forms hydrogen bonds with 4 MtFolB residues (Asp53E, Tyr54E, Ile73G and Glu74G) (Figure 2B,C). In comparison, when analysing the interactions with the HP located in the chain E using PoseView with PDB ID 1NBU, more interactions were observed. HP forms hydrogen bonds with 6 MtFolB residues (Val18E, Ile73E, Glu74E, Tyr52H, Asp53H, Tyr54H), and makes hydrophobic contacts with Val18E, Leu48H and Tyr54H. Some of these conserved residues, such as Tyr52, Asp53, Tyr54, Ile73 and Glu74, may play an important role in the formation of MtFolB octameric structure. Furthermore, it was previously shown that the residue Tyr54 is essential to aldolase and/or epimerase activities of MtFolB5. The octameric structure of MtFolB is suggested as the active form of this enzyme, and 8-MG was previously reported as a non-competitive inhibitor of MtFolB7. This interaction may be associated with the inhibition of the enzyme. Although 8-MG is a non-competitive inhibitor capable of binding to both the free enzyme and the enzyme-substrate binary complex, the crystallographic structure obtained shows that 8-MG binds near the active site of MtFolB (Figure 2C). The inhibition traces for 8-MG were hyperbolic while double-reciprocal plots were linear, which suggest that cooperativity plays no role in the enzyme inhibition.
Fourteen 8-MG (1) derivatives were synthesised with 39–84% yields (Scheme 1). These molecules were synthesised in a single reaction step via nucleophilic substitution reactions between 8-MG and bromoacetamides (2). The selection of substituents was driven by the goal of evaluating structures incorporating cycloalkyl side chains. This strategic approach aimed to investigate non-planar substituents capable of enhancing complementarity by maximising molecular volume at the binding site on MtFolB. Compounds 3a-n were evaluated in vitro against MtFolB and showed inhibitory activity with IC_50_ values ranging from 0.3 to 17.4 µM (Scheme 1; Figure 3). The inhibition of the enzyme by these compounds was not time-dependent until 40 min of pre-incubation with MtFolB, suggesting that these inhibitors bind to or dissociate from MtFolB quickly (data not shown). Therefore, there is no time dependence for the onset of enzyme inhibition14, which warranted the efforts described next.
Determination of half-maximum inhibition concentrations (IC50 values) of compounds 3a-n against MtFolB. IC50 values were determined performing initial velocity curves of enzymatic activity using 0.3 µM of MtFolB, 1.5 µM of DHNP and various concentrations of inhibitors. The IC50 value of each compound provided here were obtained using Equation (1) and plotted using Systat Software SigmaPlot 14.
The mode and constant of enzyme inhibition were determined for five selected compounds (3a-e). Lineweaver − Burk plots were used to suggest the mode of inhibition (competitive, non-competitive or uncompetitive) and the values for the inhibition constants (Kis and/or Kii) were determined by fitting the data to appropriate equations14. Compounds 3a, 3b, and 3d exhibited competitive inhibition towards the substrate DHNP. This observation is evident in the double reciprocal plot, where the intersecting lines converge at the y-axis (Figure 4A,B,D). The Kis values for these compounds ranged from 0.2 to 0.4 µM (Table 2). Compounds 3c and 3e displayed a non-competitive mode of inhibition towards DHNP. The intersecting lines in the double reciprocal plot converge to the left of the y-axis and above the x-axis (Figure 4C,E), suggesting that these inhibitors bind to both free enzyme and enzyme complexed with substrate, but exhibiting more affinity for the free enzyme. The Kis and Kii values for 3c were 0.3 and 1.5 µM, respectively; and for 3e were 1.4 and 6.3 µM, respectively (Table 2). These values, with Kis < Kii, support the hypothesis that these compounds have greater affinity for the free enzyme14.
Determination of the inhibition mechanism for compounds 3a-e on aldolase activity of MtFolB. (A) Compound 3a (0 – 0.8 µM). The Lineweaver − Burk plot displays a pattern of intersection at the y-axis, which indicates competitive inhibition. (B) Compound 3b (0 – 0.6 µM). The Lineweaver − Burk plot displays a pattern of intersection at the y-axis, which indicates competitive inhibition. (C) Compound 3c (0 – 0.9 µM). The Lineweaver − Burk plot displays a pattern of intersection to the left of the y-axis towards DHNP, which is diagnostic of non-competitive inhibition. (D) Compound 3d (0 – 2.5 µM). The Lineweaver − Burk plot displays a pattern of intersection at the y-axis, which indicates competitive inhibition. (E) Compound 3e (0 – 7 µM). The Lineweaver − Burk plot displays a pattern of intersection to the left of the y-axis towards DHNP, which is diagnostic of non-competitive inhibition.
Molecular docking experiments were performed to suggest the interactions that occur upon enzyme-inhibitor complex formation. Considering that the synthesised compounds were obtained using 8-MG (1) as a scaffold, these assays were performed using the crystallographic structure of MtFolB complexed with 8-MG. In this context, possible conformational changes in the enzyme structure due to 8-MG binding could be considered. In these assays, GoldScore was used as the score fitness function, which is taken as the negative of the sum of the component energy terms, so that larger fitness scores are better. The docking scores of the ligands obtained are presented in Table S2. MtFolB complexed with 8-MG inhibitor is a homo-octamer with chains designated as A, B, C, D, E, F, G and H. As reported in the FolB ortholog from Staphylococcus aureus23, the conserved amino acid residues involved in either substrate binding or catalysis (Glu22, Tyr54, Glu74, and Lys100) are also present in the active site of MtFolB (Glu22, Tyr54, Glu74, and Lys99). Additionally, for MtFolB, the residues Tyr54 and Lys99 play essential roles in the epimerase and aldolase activities of FolB (Figure 1) and it is indispensable for the survival of the bacillus5.
The interactions between selected synthesised compounds (3a-e) and MtFolB, obtained through molecular docking simulations, were analysed with PoseView11 and PyMOL v2.515 (Figure 5; Table S1; Figure S2). It is remarkable that some residues of the enzyme seem to play a significant role in establishing interactions with these molecules. The residues Tyr54E, Ile73G and Glu74G are involved in interactions with all synthesised compounds, as well the 8-MG (1). Interactions were established mainly by hydrogen bonds, π–π stacking, and hydrophobic interactions (Table S1; Figure S2). Compounds 3c, 3d, and 3e establish π–π stacking interactions with Tyr19G. Unlike observed with MtFolB complexed with 8-MG (1) (Figure 2B), the synthesised compounds performed hydrophobic contacts with MtFolB, mainly with Ala25A, Tyr54E, Tyr19G, and Pro103G residues (Figure 5; Table S1; Figure S2). Compounds 3b and 3e establish hydrophobic contacts with unique additional residues, namely Leu48E and Val18G (3b) and Val55E (3e). Compound 3b is also the only 8-MG analogue that perform a hydrogen bond with an additional residue, Arg15A (Figure 5B; Table S1; Figure S2). Interesting, the compound 3e was found to have a higher Ki value between the analysed compounds (Table 2), indicating the lowest enzymatic inhibitory potency observed. On the other hand, compound 3d performed hydrogen bonds just with Tyr54E, Ile73G and Glu74G (Figure 5; Table S1; Figure S2). Importantly, this compound showed a lower Kis value, corresponding to 0.2 ± 0.05 µM (Table 2), indicating that this molecule is a more potent inhibitor than the scaffold 8-MG (1) and the other synthesised derivatives.
3D interactions between compounds 3a-e and MtFolB obtained by molecular docking. An enlarged view of 3D interaction between compounds 3a (A), 3b (B), 3c (C), 3d (D) and 3e (E) with binding pocket of MtFolB. MtFolB is represented as cartoon, with each chain represented in a distinct colour: A (green), E (salmon), and G (slate blue); the main MtFolB residues that interact by polar contacts with the compounds are visualised as sticks, with carbon atoms coloured according to their respective MtFolB chain, nitrogen atoms in blue, and oxygen atoms in red. Compounds 3a-e are represented in stick model, with each atom represented in a distinct colour: carbon (gray), oxygen (red), nitrogen (blue), and sulphur (yellow). The distances of hydrogen bonds are provided in Angstrom (Å). Figures were obtained using PyMOL v2.5.
All synthesised compounds were assessed for their inhibitory activity on bacillus growth by determining the minimum inhibitory concentration using the H37Rv strain. Compound 3e exhibited antimycobacterial activity with a MIC value of 40 µg/mL (equivalent to 108 µM), while the other compounds showed no activity against M. tuberculosis at the maximum concentration tested. The drug controls in this assay, INH and RIF, exhibited MIC values of 0.31 µg/mL and 0.16 µg/mL (equivalent to 2.3 μM and 0.2 μM), respectively, against the H37Rv strain under the same experimental conditions.
The toxicity of 3e was thus assessed by evaluating the viability of HepG2 and Vero cell lines following exposure to the compound at a final concentration of 75 µM, 87.5 µM, or 100 µM. The compound was able to maintain the viability of cell lines above 90% at the three concentrations tested (Table 3). Additionally, the aqueous solubility of 3e was assessed in three conditions: pH 1.2 (simulating stomach), pH 7.4 (simulating plasma) and pH 9.1 (simulating intestine). The molecule exhibited greater solubility at pH 1.2 (612.5 µM) compared to pH 7.4 (1.1 µM) and pH 9.1 (37.6 µM).
Despite its high MIC value compared to controls, the compound 3e demonstrated no apparent toxicity to mammalian cells. The latter warrant further efforts to be pursued using 3e as a lead compound in the development of new anti-TB drug candidates targeting MtFolB.
Supplementary Material
Supplemental Material
The reference list from the paper itself. Each links out to its DOI / PubMed record.
- 1World Health Organization. Global tuberculosis report. 2023.
- 2The End TB Strategy. World Health Organization. 2015.
- 3World Health Organization. Global tuberculosis report. 2022. 27:326–336.
- 4Yang L, Hu X, Chai X, Ye Q, Pang J, Li D, Hou T. Opportunities for overcoming tuberculosis: Emerging targets and their inhibitors. Drug Discov Today. 2022;27(1):326–336.34537334 10.1016/j.drudis.2021.09.003 · doi ↗ · pubmed ↗
- 5Falcão VC, Villela AD, Rodrigues-Junior VS, Pissinate K, Eichler P, Pinto AF, Basso LA, Santos DS, Bizarro CV. Validation of Mycobacterium tuberculosis dihydroneopterin aldolase as a molecular target for anti-tuberculosis drug development. Biochem Biophys Res Commun. 2017;485(4):814–819.28257847 10.1016/j.bbrc.2017.02.137 · doi ↗ · pubmed ↗
- 6Czekster CM, Blanchard JS. One substrate, five products: reactions catalyzed by the dihydroneopterin aldolase from Mycobacterium tuberculosis. J Am Chem Soc. 2012;134(48):19758–19771.23150985 10.1021/ja 308350 f PMC 3530388 · doi ↗ · pubmed ↗
- 7Czeczot A. d M, Roth CD, Ducati RG, Pissinate K, Rambo RS, Timmers LFSM, Abbadi BL, Macchi FS, Pestana VZ, Basso LA, et al. 8-Mercaptoguanine-based inhibitors of Mycobacterium tuberculosis dihydroneopterin aldolase: synthesis, in vitro inhibition and docking studies. J Enzyme Inhib Med Chem. 2021;36(1):847–855.33752554 10.1080/14756366.2021.1900157 PMC 7993393 · doi ↗ · pubmed ↗
- 8Goulding CW, Apostol MI, Sawaya MR, Phillips M, Parseghian A, Eisenberg D. Regulation by oligomerization in a mycobacterial folate biosynthetic enzyme. J Mol Biol. 2005; 349(1):61–72.15876368 10.1016/j.jmb.2005.03.023 · doi ↗ · pubmed ↗