Correction: Transcriptome analysis of resistant and susceptible Medicago truncatula genotypes in response to spring black stem and leaf spot disease
Jacob R. Botkin, Shaun J. Curtin

Abstract
Genes, proteins, chemicals, diseases, species, mutations and cell lines named across the full text — each resolved to its canonical identifier and authoritative record.
Click any figure to enlarge with its caption.
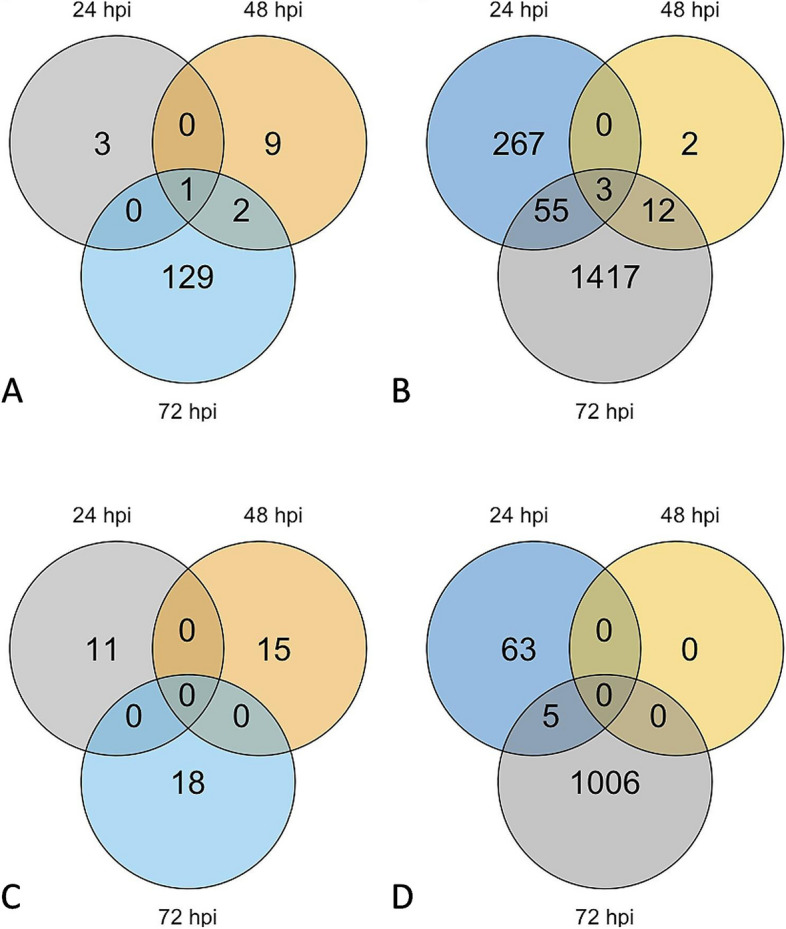 Figure 1
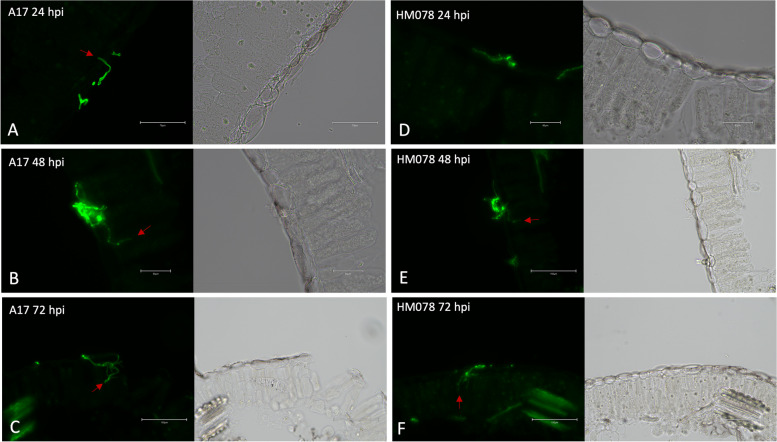 Figure 2
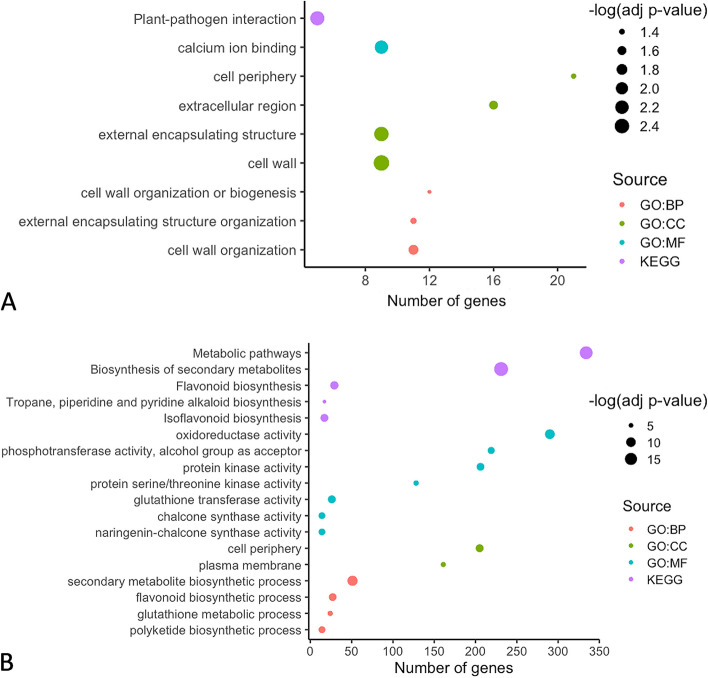 Figure 3
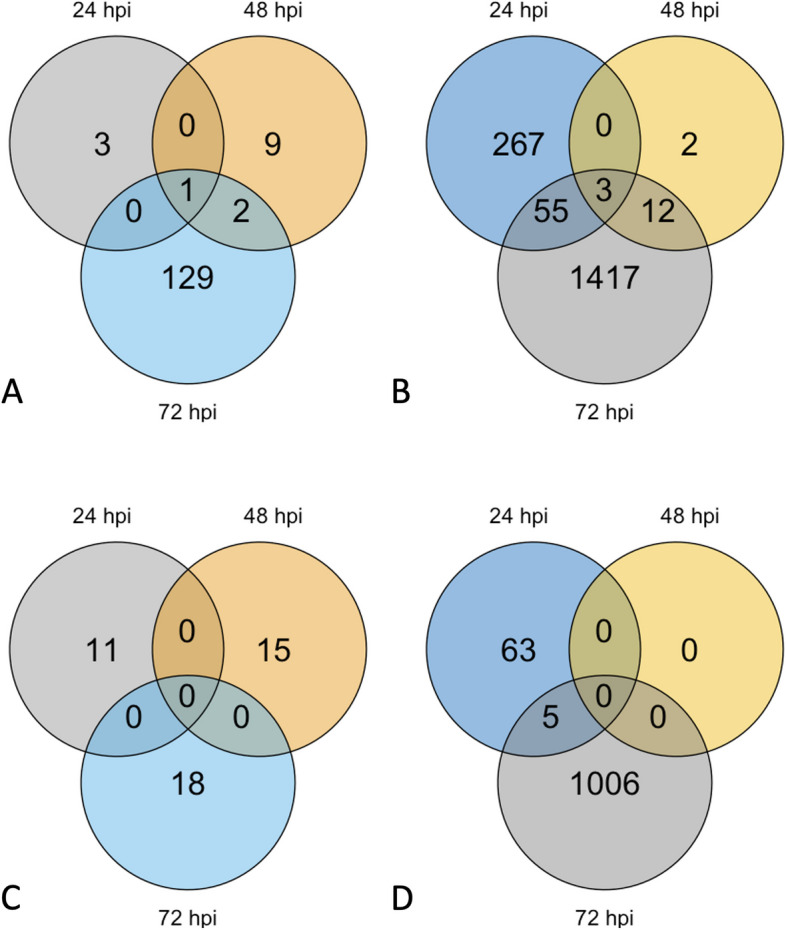 Figure 4
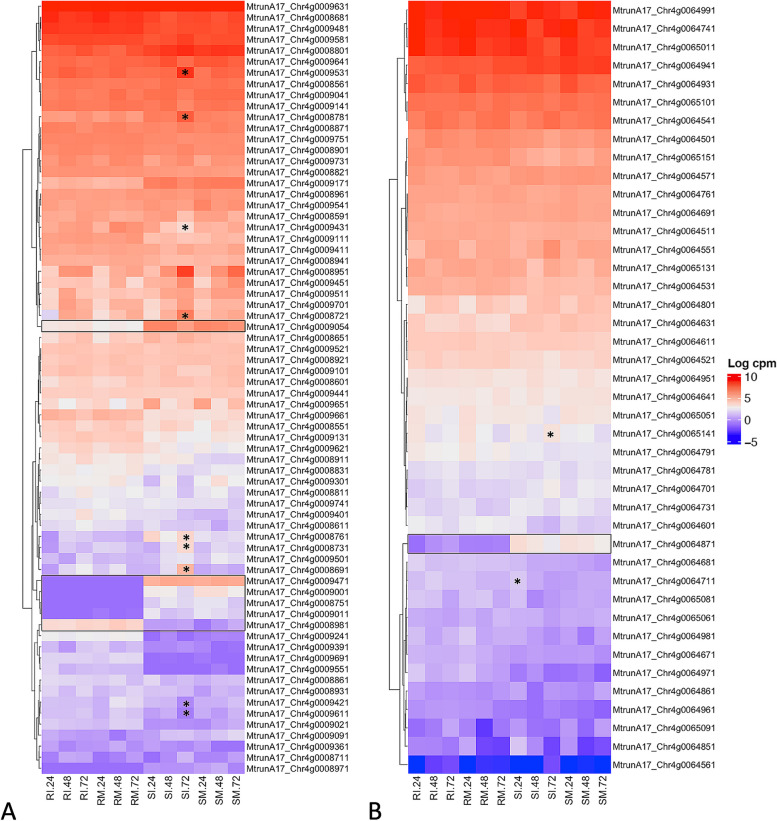 Figure 5
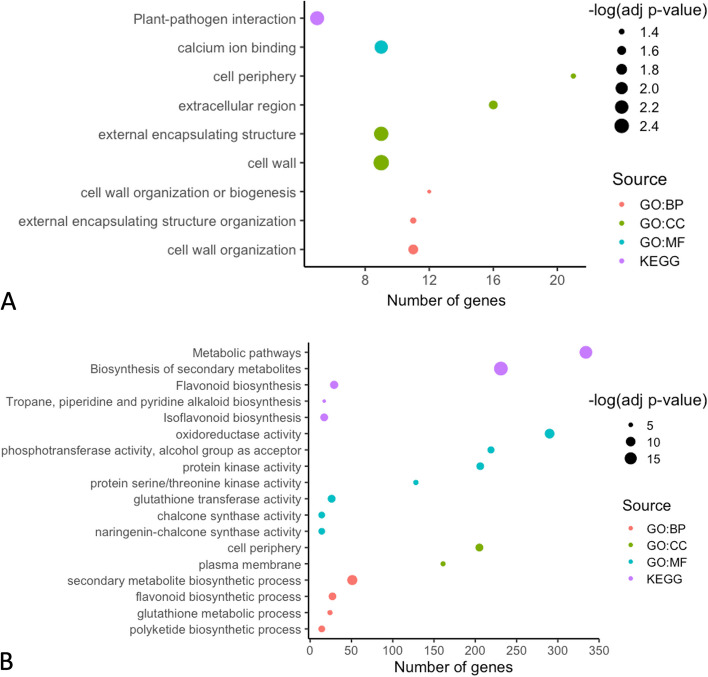 Figure 6
 Figure 7
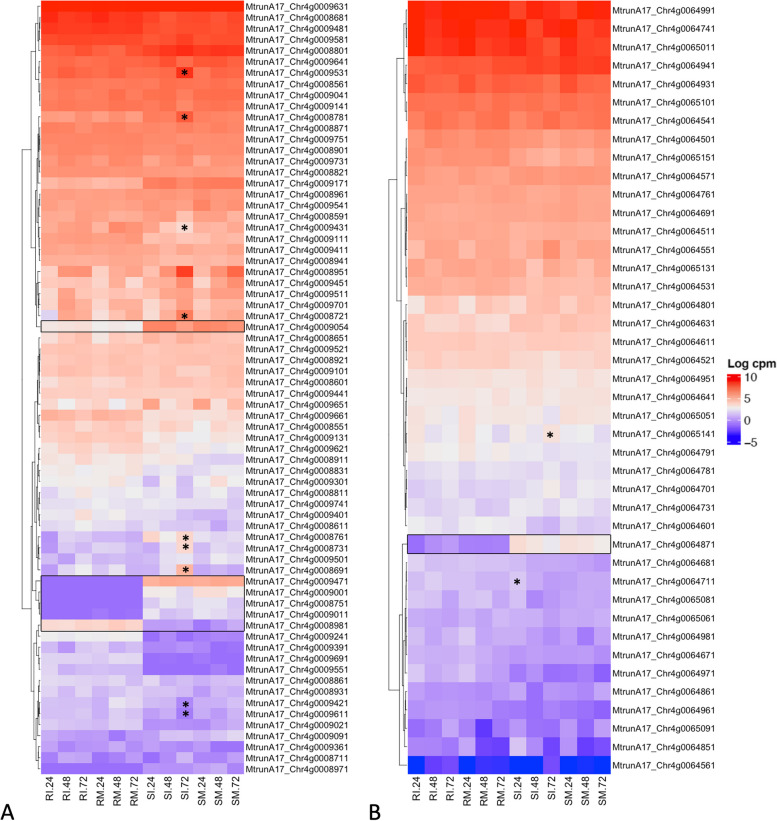 Figure 8
Peer Reviews
No public reviews on file for this paper yet. If you reviewed it on a platform where reviews are public (OpenReview, ICLR, NeurIPS, ICML), you can paste yours below so the community can read it here.
Videos
No videos yet. Explain this paper in a talk, walkthrough, or lecture? Add one.
Taxonomy
TopicsPlant Pathogens and Fungal Diseases · Plant Pathogens and Resistance · Plant Disease Resistance and Genetics
Correction**: ** BMC Plant Biol 24, 720 (2024)
https://doi.org/10.1186/s12870-024-05444-3
Following publication of the original article [1], the authors identified errors in the labelling of figures. During the proofing process, author sent an email concerning the incorrect label of figures. Unfortunately, the email was not received.
The correct figures are presented below:
**Incorrect Figure ** 1 : Fig. 1. Cross sections of M. truncatula leaves infected with A. medicaginicola. Images were taken under GFP fluorescence (left) and RGB (right) for susceptible genotype A17 at (A) 24 hpi, (B) 48 hpi, and (C) 72 hpi, as well as the resistant genotype HM078 at (D) 24 hpi, (E) 48 hpi, and (F) 72 hpi. Red arrows indicate invasive hyphae penetrating leaf epidermal cells. Scale bars for (A-F) are 75, 50, 150, 50, 150, and 150 µm, respectively
Correct Figure 1Fig. 1. Cross sections of M. truncatula leaves infected with A. medicaginicola. Images were taken under GFP fluorescence (left) and RGB (right) for susceptible genotype A17 at (A) 24 hpi, (B) 48 hpi, and (C) 72 hpi, as well as the resistant genotype HM078 at (D) 24 hpi, (E) 48 hpi, and (F) 72 hpi. Red arrows indicate invasive hyphae penetrating leaf epidermal cells. Scale bars for (A-F) are 75, 50, 150, 50, 150, and 150 µm, respectively
**Incorrect Figure ** 2 Fig. 2. Number of DEGs for resistant and susceptible M. truncatula in response to A. medicaginicola. Venn diagrams of (A) Upregulated DEGs of resistant genotype HM078, (B) Upregulated DEGs of susceptible genotype A17, (C) Downregulated DEGs of resistant genotype HM078, and (D) Downregulated DEGs of susceptible genotype A17
**Correct ****Figure **2Fig. 2. Number of DEGs for resistant and susceptible M. truncatula in response to A. medicaginicola. Venn diagrams of (A) Upregulated DEGs of resistant genotype HM078, (B) Upregulated DEGs of susceptible genotype A17, (C) Downregulated DEGs of resistant genotype HM078, and (D) Downregulated DEGs of susceptible genotype A17
**Incorrect ** **Figure ** 3 Fig. 3. Functional enrichment analysis of resistant and susceptible M. truncatula in response to A. medicaginicola. Significantly enriched GO terms were analyzed for (A) DEGs in the resistant genotype HM078, and (B) DEGs in the susceptible genotype A17. Upregulated and downregulated DEGs across all time points were included for each genotype. GO (Gene Ontology) terms were grouped by Biological Processes (BP), Molecular Function (MF), Cellular Component (CC), or Kyoto Encyclopedia of Genes and Genomes (KEGG) pathways
Correct **Figure **3Fig. 3. Functional enrichment analysis of resistant and susceptible M. truncatula in response to A. medicaginicola. Significantly enriched GO terms were analyzed for (A) DEGs in the resistant genotype HM078, and (B) DEGs in the susceptible genotype A17. Upregulated and downregulated DEGs across all time points were included for each genotype. GO (Gene Ontology) terms were grouped by Biological Processes (BP), Molecular Function (MF), Cellular Component (CC), or Kyoto Encyclopedia of Genes and Genomes (KEGG) pathways
Incorrect **Figure **4Fig. 4. Gene expression profiles for QTL regions. Heatmaps are displayed in log_2_CPM for QTL (A) rnpm1 and (B) rnpm2. Genes with contrasting expression profiles between resistant and susceptible genotypes are outlined with a box. Differentially expressed genes in specific tissues are indicated with asterisks. Sample ID abbreviations are SM: susceptible mock-inoculated, SI: susceptible inoculated, RM: resistant mock-inoculated, RI: resistant inoculated, followed by hours post inoculation (24, 48, or 72 hpi)
Correct **Figure **4Fig. 4. Gene expression profiles for QTL regions. Heatmaps are displayed in log_2_CPM for QTL (A) rnpm1 and (B) rnpm2. Genes with contrasting expression profiles between resistant and susceptible genotypes are outlined with a box. Differentially expressed genes in specific tissues are indicated with asterisks. Sample ID abbreviations are SM: susceptible mock-inoculated, SI: susceptible inoculated, RM: resistant mock-inoculated, RI: resistant inoculated, followed by hours post inoculation (24, 48, or 72 hpi)
The original article [1] has been corrected.