Comparative Analysis of Hydrosol Volatile Components of Citrus × Aurantium ‘Daidai’ and Citrus × Aurantium L. Dried Buds with Different Extraction Processes Using Headspace-Solid-Phase Microextraction with Gas Chromatography–Mass Spectrometry
Xinyue Xie, Huiling Xue, Baoshan Ma, Xiaoqian Guo, Yanli Xia, Yuxia Yang, Ke Xu, Ting Li, Xia Luo

TL;DR
This study compares the volatile compounds in hydrosols from two types of citrus buds using different extraction methods.
Contribution
The study identifies unique volatile components and extraction effects in Citrus × aurantium varieties.
Findings
106 volatile compounds were detected, with alcohols, alkenes, and esters being the main components.
CAVA hydrosols had more total and unique volatile components compared to CADB hydrosols.
Ultrasound–microwave extraction enhanced the aroma of CAVA hydrosols but reduced that of CADB hydrosols.
Abstract
This work used headspace solid-phase microextraction with gas chromatography–mass spectrometry (HS-SPME-GC–MS) to analyze the volatile components of hydrosols of Citrus × aurantium ‘Daidai’ and Citrus × aurantium L. dried buds (CAVAs and CADBs) by immersion and ultrasound–microwave synergistic-assisted steam distillation. The results show that a total of 106 volatiles were detected in hydrosols, mainly alcohols, alkenes, and esters, and the high content components of hydrosols were linalool, α-terpineol, and trans-geraniol. In terms of variety, the total and unique components of CAVA hydrosols were much higher than those of CADB hydrosols; the relative contents of 13 components of CAVA hydrosols were greater than those of CADB hydrosols, with geranyl acetate up to 15-fold; all hydrosols had a citrus, floral, and woody aroma. From the pretreatment, more volatile components were retained…
Genes, proteins, chemicals, diseases, species, mutations and cell lines named across the full text — each resolved to its canonical identifier and authoritative record.
Click any figure to enlarge with its caption.
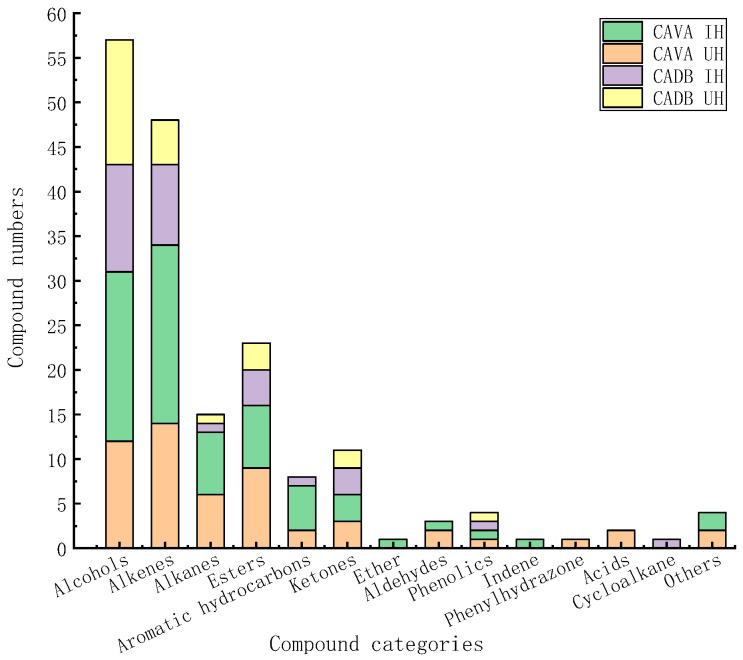 Figure 1
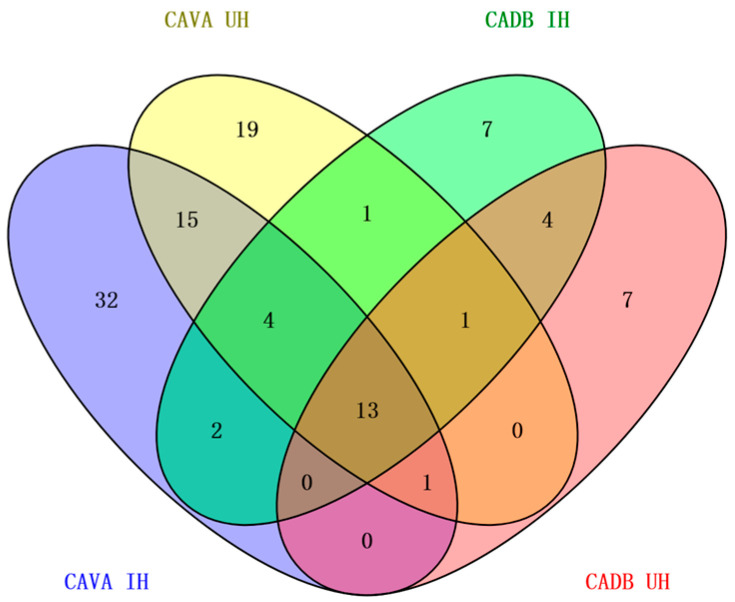 Figure 2
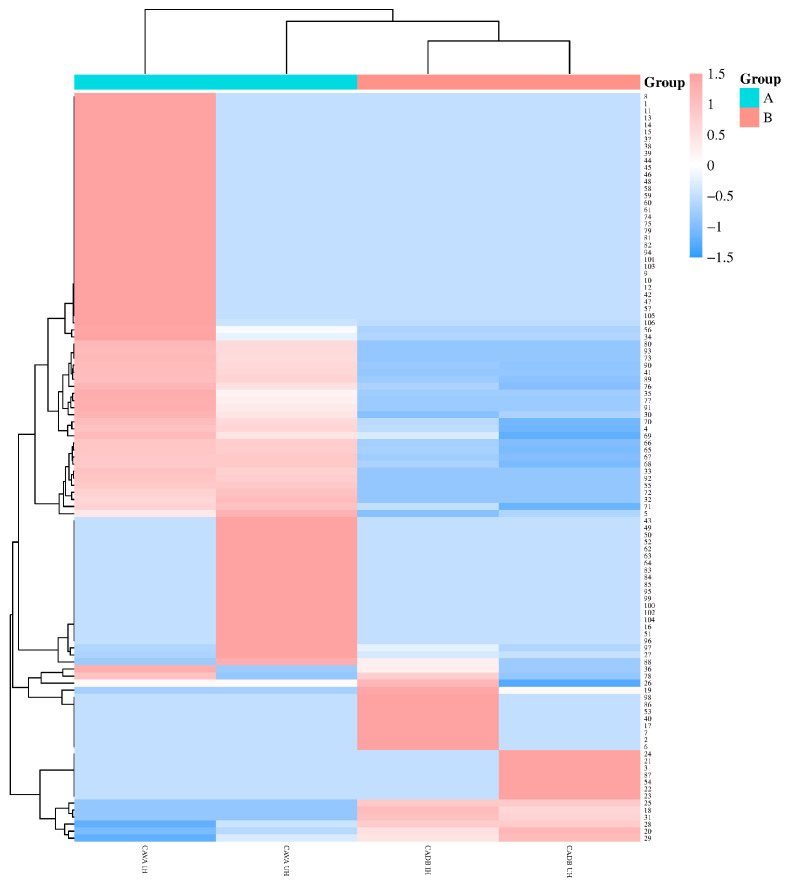 Figure 3
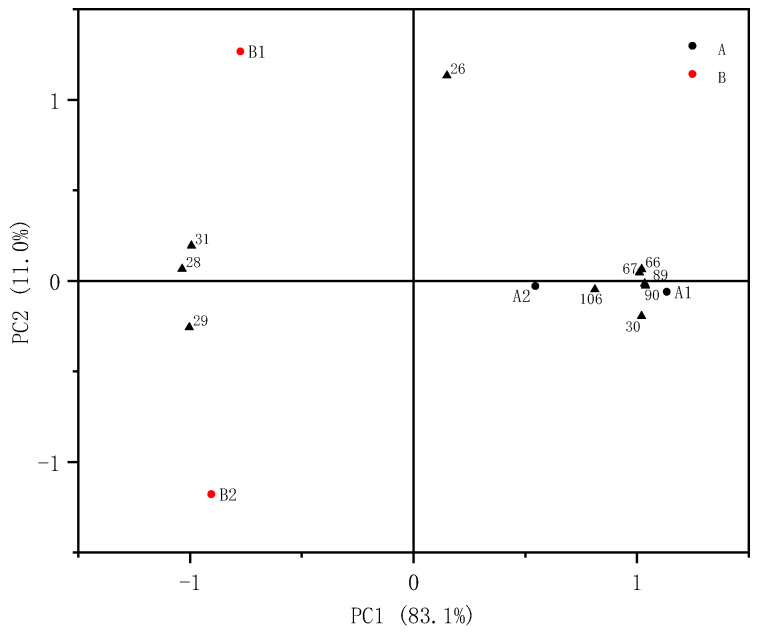 Figure 4
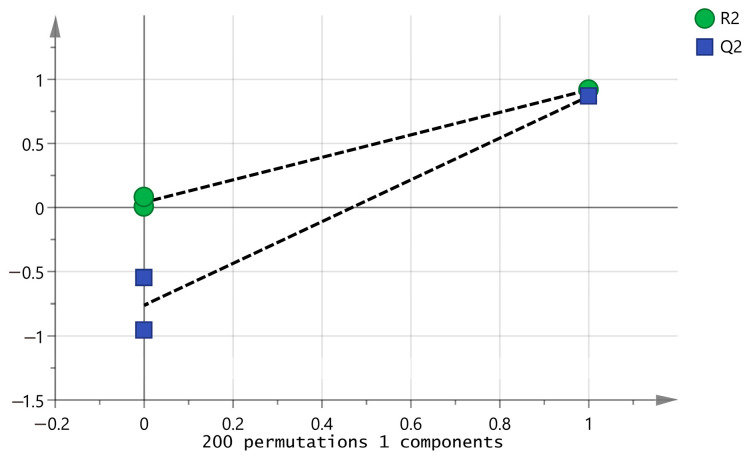 Figure 5
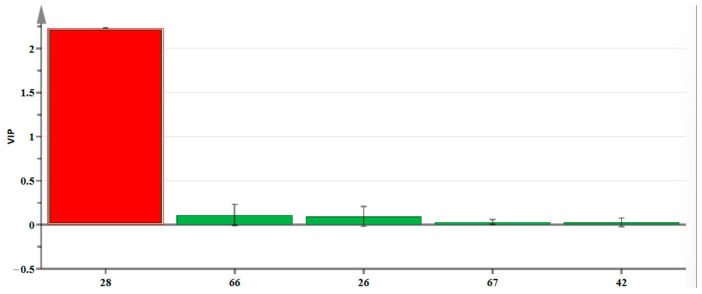 Figure 6
- —Sichuan Science and Technology Program
- —Sichuan Taoist Herbal Medicine Innovation Team
- —Sichuan Science and Technology Department Project
Peer Reviews
No public reviews on file for this paper yet. If you reviewed it on a platform where reviews are public (OpenReview, ICLR, NeurIPS, ICML), you can paste yours below so the community can read it here.
Videos
No videos yet. Explain this paper in a talk, walkthrough, or lecture? Add one.
Taxonomy
TopicsPhytochemicals and Antioxidant Activities · Fermentation and Sensory Analysis · Postharvest Quality and Shelf Life Management
1. Introduction
According to the Chinese Pharmacopoeia [1], Aurantii Fructus [2] is the dried immature fruit of Citrus × aurantium L. (also known as bitter orange) and its cultivated varieties, which is a Citrus × aurantium L. variety of the citrus plant of the family Rutaceae and is known for its anti-inflammatory, antioxidant, antitumor, and immunomodulatory activities due to its rich content of flavonoids, such as neohesperidin and naringin, and alkaloids, such as synephrine and N-methyltyramine [3,4], and so on. It is a traditional bulk Chinese herbal medicine and has been widely used in both traditional Chinese and modern medicine [5]. Citrus × aurantium ‘Daidai’ is one of the main cultivated varieties of Citrus × aurantium L., and its dried buds are called Citrus × aurantium L. var. amara Engl. (CAVAs) [6,7]. It is the only one of the several pharmacopoeia-licensed varieties of Citrus × aurantium L. that has entered into the national catalog of medicine food homology and has received wide attention, and a great number of studies have reported on the constituents and pharmacological effects of CAVAs. Studies have shown that CAVAs contain flavonoids, volatile oils, coumarins, and other components, with anti-inflammatory, antitumor, antioxidant, antibacterial, antiviral, hypolipidemic, and other pharmacological effects, and are mainly used for the treatment of symptoms such as food accumulation, phlegm, chest and abdominal stuffiness, pain, oligophagia, nausea, and vomiting, and so on [8,9,10,11,12]. At present, the dried buds of Citrus × aurantium L. (CADBs) are mainly used as a source of natural flavor, and there is a lack of systematic research on its composition and pharmacological effects; therefore, it cannot be used as a homologous component in medicine and food.
Citrus × aurantium L. has a long history of cultivation in China and has been planted in Jiangsu, Zhejiang, Fujian, Sichuan, and Guizhou [13]. Its flowers are often used to extract essential oils, and the quality of its essential oils is influenced by the extraction process. The yield and composition of essential oils may vary to some extent depending on the extraction method used. Some commonly employed methods for extracting essential oils include steam distillation, supercritical CO_2_ extraction [9], solvent extraction, etc. Steam distillation is often favored due to its affordability and simplicity, despite drawbacks such as lengthy extraction time and low efficiency. To optimize the advantages, it is common practice to employ pretreatments like immersion, ultrasound, and microwave procedure on the materials. Research has demonstrated that immersing a component for a specific duration of time can result in the dissolution of some active components without altering their properties. Additionally, ultrasound cavitation can induce the rupture of plant cell walls, leading to an increased dissolution of active components. Moreover, microwave energy can cause the rapid vaporization of water within the cells, resulting in elevated local temperature and pressure, thereby facilitating the dissolution of more active components [14,15,16].
When flowers of Citrus × aurantium L. are used to extract essential oils, one by-product will be produced, i.e., hydrosol, which contains a large number of volatile components with certain activities, but only the essential oil is usually retained in the production, and the hydrosol is not valued, which is a waste of resources; at the same time, the type and content of the hydrosol components vary according to different essential oil extraction processes. There is no relevant report on this subject at present, and the quality is not known.
In order to compare the quality differences between the medicinal and food homologous CAVAs and common CADBs from various perspectives, and with a view of providing theoretical support for the in-depth exploration of the medicinal and food homologous basis of CAVAs as well as to improve the utilization rate of waste resources, CAVAs and CADBs were subjected to two pretreatments, namely the immersion and ultrasound–microwave procedures, and were subjected to extraction by steam distillation to collect the hydrosols. The volatile components in the hydrosol were enriched and characterized by HS-SPME-GC-MS (an advanced technique widely used for the qualitative and quantitative analyses of volatile constituents, with the advantages of being more rapid, sensitive, efficient, and accurate) [17], with the goal of filling the gaps in the relevant research, enhancing the utilization of resources, reducing the wastage of resources, and ultimately laying the theoretical foundations for the in-depth and intensive processing of hydrosols.
2. Results and Discussion
2.1. Analysis of Volatile Components of CAVA IH and CAVA UH
The HS-SPME-GC-MS method was used to determine the volatile components of CAVA IH, and the relevant information is presented in (Table 1).
The peak times of the main components of CAVA IH ranged from 6.00 min to 32.00 min. A total of 67 compounds were detected by HS-SPME-GC-MS, including 19 alcohols, relative content of about 63.12%; 20 alkenes, with a relative content of about 8.48%; 7 esters, relative content of about 4.57%; 5 aromatic hydrocarbons, relative content of about 0.72%; 7 alkanes, relative content of about 0.47%; 3 ketones, relative content of about 0.25%; 1 phenolic, relative content of about 0.12%; 1 aldehyde, relative content of about 0.03%; 1 ether, relative content of about 0.01%; 1 indene, relative content of about 0.01%; and 2 other compounds, relative content of about 1.05%. The number of alcohol, alkene, and ester kinds accounted for about 58.21%, and the total content comprised about 76.17%, among which the main component linalool (1.5674 mg/kg, 36.79%) ranked first, α-terpineol (0.4013 mg/kg, 9.42%) ranked second, and trans-geraniol (0.3119 mg/kg, 7.32%) ranked third, followed in order by spathulenol (0.1937 mg/kg, 4.55%), geraniol ester (0.1066 mg/kg, 2.50%), d-limonene (0.0937 mg/kg, 2.20%), nerol (0.0841 mg/kg, 1.97%), β-myrcene (0.0769 mg/kg, 1.80%), neryl acetate (0.0647 mg/kg, 1.52%), and caryophyllene oxide (0.0426 mg/kg, 1.00%). The relative content of the remaining components was less than 1%.
The HS-SPME-GC-MS method was used to determine the volatile components of CAVA UH, and the relevant information is presented in (Table 2).
The peak times of the main components of CAVA UH ranged from 6.00 min to 32.00 min. A total of 54 compounds were detected by HS-SPME-GC-MS, including 12 alcohols, relative content of about 69.87%; 14 alkenes, with a relative content of about 7.26%; 9 esters, relative content of about 3.69%; 6 alkanes, relative content of about 0.27%; 3 ketones, relative content of about 0.38%; 2 aromatic hydrocarbons, relative content of about 0.32%; 2 acids, relative content of about of 0.19%; 1 phenolic, relative content of about 0.17%; 2 aldehydes, relative content of about 0.08%; 1 phenylhydrazone, relative content of about 0.07%; and 2 other compounds, relative content of about 0.06%. The number of alcohol, alkene, and ester kinds accounted for about 64.81%, and the total content comprised about 80.82%, among which the main component linalool (2.0741 mg/kg, 44.38%) ranked first, α-terpineol (0.5052 mg/kg, 10.81%) ranked second, and trans-geraniol (0.3413 mg/kg, 7.30%) ranked third, followed in order by spathulenol (0.1626 mg/kg, 3.48%), d-limonene (0.1025 mg/kg, 2.19%), nerol (0.0914 mg/kg, 1.96%), acetic acid, geraniol ester (0.0909 mg/kg, 1.94%), β-myrcene (0.0810 mg/kg, 1.73%), and neryl acetate (0.0597 mg/kg, 1.28%). The relative content of the remaining components was less than 1%.
2.2. Analysis of Volatile Components of CADB IH and CADB UH
The HS-SPME-GC-MS method was used to determine the volatile components of CADB IH, and the relevant information is presented in (Table 3).
The peak times of the main components of CADB IH were in the range of 11.00 min to 28.00 min. A total of 32 compounds were detected by HS-SPME-GC-MS, including 12 alcohols, with a relative content of about 83.00%; 9 alkenes, relative content of about 2.67%; 4 esters, relative content of about 0.45%; 1 phenolic, relative content of about 0.13%; 3 ketones, relative content of about 0.12%; 1 cycloalkane hydrocarbon, relative content of about 0.07%; 1 aromatic hydrocarbon, relative content of about 0.03%; and 1 alkane, relative content of about 0.02%. The number of alcohol, alkene, and ester kinds accounted for about 78.13%, and the total content comprised about 86.12%, among which the main component linalool (3.4712 mg/kg, 56.54%) ranked first, α-terpineol (0.7361 mg/kg, 11.99%) ranked second, and trans-geraniol (0.4865 mg/kg, 7.92%) ranked third, followed in order by nerol (0.2149 mg/kg, 3.50%) and spathulenol (0.1041 mg/kg, 1.70%). The relative content of the remaining components was less than 1%.
The HS-SPME-GC-MS method was used to determine the volatile components of CADB UH, and the relevant information is presented in (Table 4).
The peak times of the main components of CADB UH were in the range of 11.00 min to 28.00 min. A total of 26 compounds were detected by HS-SPME-GC-MS, including 14 alcohols, with a relative content of about 83.02%; 5 alkenes, relative content of about 1.74%; 3 esters, relative content of about 0.29%; 2 ketones, relative content of about 0.22%; 1 phenolic, relative content of about 0.12%; and 1 alkane, relative content of about 0.03%. The number of alcohol, alkene, and ester kinds accounted for about 84.62%, and the total content comprised about 85.05%, among which the main component linalool (3.1096 mg/kg, 56.44%) ranked first, α-terpineol (0.7186 mg/kg, 13.04%) ranked second, and trans-geraniol (0.3591 mg/kg, 6.52%) ranked third, followed in order by nerol (0.1795 mg/kg, 3.26%) and spathulenol (0.1147 mg/kg, 2.08%). The relative content of the remaining components was less than 1%.
The above results were similar to the previous study, which found that the main constituents of Citrus × aurantium L. flower hydrosols were linalool, α-terpineol, geraniol [18], nerol, linalyl acetate, d-limonene, and neryl acetate [19]. According to the actual test results, variations in the retention times of certain components were observed, which can be attributed to slight deviations in the heating protocols and the complex compositions of the components.
2.3. Comprehensive Analysis of Volatile Components of CAVA Hydrosols and CADB Hydrosols
As shown in (Figure 1 and Figure 2), 67, 54, 32, and 26 volatile constituents were identified in CAVA IH, CAVA UH, CADB IH, and CADB UH, respectively, after eliminating duplicates, totaling 106 compounds. Alcohols, alkenes, and esters were the main constituents, constituting approximately 58.21%, 66.67%, 78.13%, and 84.62% of the total types of components in the four hydrosols. This marked a significant increase in compound diversity in the four hydrosols compared to previous studies [16,20,21,22,23] (20–60 kinds), demonstrating a noteworthy growth in the number of detected compounds in lime flowers.
Combined with (Figure 2) and (Table 5), the total components of CAVA hydrosols (67, 54) exceeded those of CADB hydrosols (32, 26). The total components of immersion (67, 32) outweighed those of the ultrasound–microwave procedure (54, 26); CAVA hydrosols and CADB hydrosols had 22 components in common, of which 13 were common to all four types of hydrosols; CAVA hydrosols contained a significantly higher number of unique components (66) compared to CADB hydrosols (18), while more unique constituents could be obtained from immersion (32, 7) than from the ultrasound–microwave procedure (19, 7).
As shown in (Figure 2), the comparison of various pretreatment methods revealed that the immersion and ultrasound–microwave procedures for CAVA hydrosols exhibited 15 common constituents, whereas CADB hydrosols had only 4. When comparing the different varieties, CAVA hydrosols and CADB hydrosols had two common constituents in immersion, whereas CAVA hydrosols and CADB hydrosols had no common constituents in the ultrasound–microwave procedure. These differences could be attributed to varietal differences [24,25].
When the pretreatments were the same, the CAVA hydrosols had higher total and exclusive components compared to the CADB hydrosols, with fewer common components between them; when the varieties were the same, the immersion contained a greater variety of components compared to the ultrasound–microwave procedure. Furthermore, the CAVA hydrosols contained a greater number of distinct components in the immersion than in the ultrasound–microwave procedure.
2.4. Cluster Analysis of Volatile Components of CAVA Hydrosols and CADB Hydrosols
A clustered heatmap is displayed in (Figure 3), with red areas representing higher levels of components and blue areas representing lower levels of components. As can be seen in it, the four hydrosols had less similarity in composition type and content; the volatile components with more prominent content were visualized. With the same pretreatments, there are significant differences in the composition and content of volatile constituents between CAVA hydrosols and CADB hydrosols, and among the common major constituents, the linalool (36.79%/44.38%), α-terpineol (9.42%/10.81%), and nerol (1.97%/1.96%) contents of CAVA IH/CAVA UH were less than those of CADB IH/CADB UH, respectively (56.54%/56.44%; 11.99%/13.04%; 3.50%/3.26%). However, the relative contents of the remaining components found in the CAVA hydrosols had a significant advantage, i.e., based on the same treatments, the relative contents of 13 components such as d-carvone, β-myrcene, d-limonene, neryl acetate, etc., of CAVA hydrosols were greater than those of CADB hydrosols, ranging from 1 to 15-fold. Particularly, neryl acetate and geranyl acetate exhibited the highest increases, reaching up to 9.85 and 15-fold, respectively. These differences could be attributed to the variations in the volatile components’ composition within the respective varieties.
When the varieties were the same, the linalool (44.38%) and α-terpineol (10.81%) contents of the ultrasound–microwave procedure in the CAVA hydrosols were greater than those of the immersion (36.79% and 9.42%, respectively), and the spathulenol (3.68%), geranyl acetate (1.94%), trans-geraniol (7.30%), and caryophyllene oxide (0.04%) contents were lower compared to those from immersion (4.55%, 2.50%, 7.32%, and 1.00%, respectively). The content of α-terpineol (13.04%) in the ultrasound–microwave procedure of CADB hydrosols was greater than that of the immersion (11.99%), whereas the content of trans-geraniol (6.52%) was less than that of the immersion (7.92%).
In summary, it can be seen that the two pretreatments have their unique characteristics. From the standpoint of volatile components, the decrease in components through the ultrasound–microwave procedure as opposed to immersion might stem from the alteration of certain thermally sensitive components with lower content following oxidation and polymerization; according to a report, Lv et al. used three methods to extract CAVA essential oil, traditional hydrodistillation, ultrasound-assisted hydrodistillation, and microwave-assisted hydrodistillation, and identified 30, 33, and 50 compounds, respectively [26]. These results align closely with those of our study, indicating that the ultrasound–microwave procedure increased the composition of the essential oil but decreased the composition of the hydrosol; from the standpoint of main component content, the ultrasound–microwave procedure could increase the content of the main components as opposed to immersion, possibly because of the relatively high boiling points of these components, making them less prone to volatilization and dissipation.
2.5. PCA Analysis of Volatile Components of CAVA Hydrosols and CADB Hydrosols
To visually study the effects of two factors, variety and pretreatment process, on the differences in volatile components of CAVA hydrosols and CADB hydrosols, its 10 main volatile components (with a relative content > 1%) were selected for principal component (PCA) analysis, and the biplot is shown in (Figure 4). As can be seen from the figure, the contribution rates of PC1 and PC2 were 83.1% and 11.0%, respectively, with a total sum of 94.1%, which could represent the vast majority of information in the dataset of volatile constituents of CAVA hydrosols and CADB hydrosols, meeting the standard requirement of a cumulative contribution rate of 85% or higher.
The distances between A1 and B1 and A2 and B2 were greater, suggesting significant differences in the relative contents of the main components of CAVA hydrosols and CADB hydrosols under similar pretreatments. This could be attributed to disparities in the volatile component contents inherent to the varieties themselves. B1 and B2 exhibited considerable separation, while A1 and A2 were nearby, indicating that when the varieties were the same, the pretreatments had a more pronounced impact on the main volatile components of the CADB hydrosols. Conversely, the influence on the main volatile components of the CAVA hydrosols was minimal, possibly due to the large differences in the constituent types of CAVAs and CADBs, as well as the intricate synergistic, masking, and additive effects that existed among the components [27]. In PC1, the component with the highest positive loadings was geranyl acetate, and the component with the highest negative loadings was linalool; in PC2, the component with the highest positive loadings was trans-geraniol, and the component with the highest negative loadings was α-terpineol. The above results indicate that geranyl acetate, linalool, trans-geraniol, and α-terpineol were the main volatile components demonstrating the most notable variations in the contents of different hydrosols.
2.6. OVA Analysis of Volatile Components of CAVA Hydrosols and CADB Hydrosols
It has been documented that linalool is a natural and non-toxic compound, possessing a floral (reminiscent of lily of the valley, rose, lilac), citrus, and woody aroma [28]. The beneficial effects of linalool are inflammatory, antioxidant, antibacterial, anti-anxiety, antidepressant, etc. It is mainly used in the manufacture of pharmaceuticals, cosmetics, spices, pesticides, etc. [29] Additionally, it is utilized as a spice and flavoring agent in beverages and various food products, as well as an intermediate substance in the synthesis of vitamin E. Consequently, over 1000 tons of linalool are used globally every year, indicating its substantial value [30]. α-Terpineol has a lilac floral, citrus, and woody aroma [31] and is widely used as a flavoring component in food, tobacco, perfume, cosmetics, and cleaning products. It holds economic significance in pharmaceutical products due to its manifold beneficial effects encompassing antioxidant, anti-inflammatory, antibacterial, analgesic, antidiarrheal, anticonvulsant, anticancer, and antihypertensive properties [32]. Spathulenol exudes an herbal aroma [33], offering antioxidant, anti-inflammatory, antiproliferative, and antimycobacterial activities [34]. Geranyl acetate emits a scent reminiscent of rose and lavender [35] and exhibits promising anti-bacterial and anti-fungal characteristics with commendable thermal stability, suitable for integration into standard polymer processing methods like cellulose acetate, commonly used in the manufacture of food packaging and biomedical equipment [36]. D-limonene has a citrus lemon aroma [37], and offers various health benefits such as antioxidant, anti-diabetic, anti-cancer, anti-inflammatory, cardioprotective, gastroprotective, hepatoprotective, and immunomodulatory properties, among others. It is abundant in lemon, orange, and other citrus plants and is usually used as a fragrance and flavor additive in perfumes, soaps, and foods [38]. Nerol has a floral, grassy aroma [39] and is extensively applied in cosmetics, household detergents, and cleaners. In the food industry, it serves as a flavoring agent in foods like chewing gum and aids in food preservation due to its potent antifungal properties [40]. β-Myrcene, found in plants like lemongrass and rosemary, boasts a peppery, pungent, and floral profile [41,42]. It possesses analgesic, anti-inflammatory, anti-bacterial, and antioxidant effects, among other pharmacological effects [43]. Neryl acetate possesses a rosy, honey-sweet flavor [44], along with antibacterial, anti-inflammatory, sedative, etc., effects. It finds extensive use in the food, agricultural, and cosmetic fields and has been recognized and approved by the U.S. Food and Drug Administration as a safe food flavoring [45]. In addition, the European Food Safety Authority has assessed it as a safe feed flavoring product for use in all kinds of animals [46]. Caryophyllene oxide has a pungent, woody, clove, and slightly sweet flavor [47] and is commonly utilized as a preservative in foods, pharmaceuticals, and cosmetics, e.g., to improve oral diseases caused by oral candida [48]. Trans-geraniol features a rosy, lemony aroma [49]. Geraniol, predominantly present in essential oils like rose, ginger, lemon, etc., has neuroprotective, anti-inflammatory, and antidepressant activities, making it a popular choice in the fragrance and cosmetic sectors [50].
It is clear from the preceding that the main volatile components in the CAVA hydrosols were linalool, α-terpineol, spathulenol, geranyl acetate, trans-geraniol, d-limonene, nerol, β-myrcene, neryl acetate, and caryophyllene oxide. In the CADB hydrosols, the main volatile components were linalool, α-terpineol, trans-geraniol, nerol, and spathulenol. Most of these components are citrusy, floral, and woody, and could potentially be the foundational elements constituting the base of the aroma of CAVA hydrosols and CADB hydrosols.
The odor thresholds of 106 volatile components were retrieved and the OAV values were calculated to study the characteristic aroma components of CAVA hydrosols and CADB hydrosols. As shown in (Table 6), the threshold values of only 36 components were queried, and there were five components with OAV > 1, including three components with OAV > 10. The component with OAV > 1 in CAVA hydrosols was linalool (with a value of up to 7000 or more), followed by β-myrcene (with a value of up to 60 or more), trans-geraniol (with a value of up to 40 or more), d-limonene (with a value of around 3), and o-cymene (with a value of 2.125). The component with OAV > 1 in CADB hydrosols was linalool (with a value of up to 14,000 or more), followed by trans-geraniol (with a value of up to 40 or more), β-myrcene (value up to 30 or more), and d-limonene (value around 1). Therefore, the characteristic aroma components in CAVA hydrosols were identified as linalool, β-myrcene, trans-geraniol, d-limonene, and o-cymene, while in CADB hydrosols they were linalool, trans-geraniol, β-myrcene and d-limonene.
When the pretreatments were the same, the characteristic aroma components in the CAVA hydrosols with higher OAV values compared to the CADB hydrosols were β-myrcene and d-limonene, while the lower ones were linalool and trans-geraniol. These characteristic aroma variances can serve as a foundation for differentiation in identification.
When the varieties were the same, the OAV values of linalool, β-myrcene, trans-geraniol, and d-limonene increased, and o-cymene was depleted in the CAVA hydrosols by the ultrasound–microwave procedure compared with the immersion procedure, whereas the OAV values of the four key aromatic components in the CADB hydrosols decreased with the ultrasound–microwave procedure contrast to with the immersion procedure. Therefore, the ultrasound–microwave procedure could stimulate the aroma of CAVA hydrosols and diminish the aroma of CADB hydrosols.
2.7. OPLS-DA Analysis of Volatile Components of CAVA Hydrosols and CADB Hydrosols
To further characterize the key aromatic components of the CAVA hydrosols and CADB hydrosols, five key aromatic components with OAV > 1 were selected for orthogonal partial least squares discriminant (OPLS-DA) analysis. The fitted parameters analyzed in this study, R^2^X = 0.998, R^2^Y = 0.918, and Q^2^ = 0.868 were assessed, with R^2^ and Q^2^ exceeding 0.5, indicating a satisfactory model fit. The cross-validation model was validated by the alignment test 200 times (Figure 5), as the intersection of the Q^2^ regression line with the y-axis was below zero, which indicates that the model is not overfitted and the model is valid, so this result can be used in distinguishing between different CAVA hydrosols and CADB hydrosols.
It is typically accepted that variables with variable importance in the projection (VIP) value >1 are significantly influential to the categorization process, and the higher the value, the greater the variable’s impact on the categorization. Based on the OAV > 1 and VIP > 1 (Figure 6), one characteristic aroma component was identified, namely linalool (present in lily of the valley, rose and lilac, citrus, and woody aromas). This finding is consistent with previous research indicating linalool as the main component in the hydrosol of lime flowers [19]. Therefore, the aroma profiles of CAVA hydrosols and CADB hydrosols primarily consist of citrus, floral, and woody essences.
3. Materials and Methods
3.1. Plant Materials
The experimental materials were harvested on 20 April 2022 from the Citrus × aurantium L. planting base of Sichuan Shugeng Agricultural Development Co., Ltd. in Sanbanqiao Village, Guanyinqiao Town, Linshui County, Guang’an City, China. They were identified by associate researcher Xianjian Zhou of the Sichuan Academy of Traditional Chinese Medicine as the dried flower buds of Citrus × aurantium L., a citrus plant of the Rutaceae family, and its variant Citrus × aurantium ‘Daidai’.
3.2. Chemicals and Reagents
The chemical 2-methyl-3-heptanone was purchased from Merck Chemical Technology Co., Ltd. (Shanghai, China).
3.3. Preparation of Samples
After drying, the CAVAs and CADBs were comminuted using a high-speed pulverizer and sifted into 80-mesh particles for further utilization.
Immersion: firstly, 15 g of pollens and 210 mL of distilled water were combined in a 500 mL round-bottomed flask, allowed to soak for 1 h, and then extracted by heating using a steam distillation apparatus.
Ultrasound–microwave: Then, 15 g of pollens and 210 mL of distilled water were placed in a 500 mL round-bottomed flask, subjected to ultrasound cleaner and a microwave oven successively for a certain time (processing conditions: ultrasound time 7 min, ultrasound power 90 w, microwave time 75 s, microwave power 280 w). Subsequently, the mixture was extracted by heating in a steam distillation apparatus.
After the above processes, the hydro-oil was separated by the density difference method. The upper layer of essential oils was discarded, and the lower layer of water samples was collected in brown bottles and placed in a (4 ± 2) °C refrigerator light preservation spare. These were hydrosol samples.
3.4. Determination of Volatile Components
3.4.1. Headspace Solid-Phase Microextraction
First, the SPME fiber extraction head was inserted into the gas chromatograph pretreatment for 30 min for aging at a temperature of 250 °C; then, 5.0 mL of hydrosol was added to the headspace vial, along with 10 μL of 2-methyl-3-heptanone (400 ppm) as an internal standard. The mixture was then equilibrated at 45 °C for 20 min. Subsequently, the aged head was placed in the headspace vial top headspace for adsorption at 55 °C adsorption for 30 min, followed by direct removal of the extraction head into the gas chromatography-mass spectrometry system.
3.4.2. GC-MS Analysis
GC conditions: The GC oven temperature protocol included a 2 min hold at 50 °C, followed by a ramp to 120 °C at 4 °C/min and a 3 min hold (CADBs); followed by a ramp to 160 °C at 4 °C/min and a 4 min hold (CAVAs); then finally a ramp to 280 °C at 8 °C/min with a 5 min hold. The inlet temperature was set at 250 °C, using nitrogen as the carrier gas at a flow rate of 1 mL/min with a shunt ratio of 15:1.
MS conditions: The interface temperature was maintained at 280 °C, utilizing an electron bombardment (EI) source at an electron energy of 70 eV. The scanning mass range was set from 33.00 to 55.00 amu, with an electron multiplier voltage of 1000 V and a solvent delay time of 3 min.
Qualitative analysis: the volatile components of CAVA hydrosols and CADB hydrosols were analyzed by HS-SPME-GC–MS to obtain the total ion-flow chromatograms, and the components corresponding to the peaks were characterized by combining with the standard mass spectral libraries, such as NIST 107.LIB, and the pertinent literature.
Quantitative analysis: the relative content of each component was determined through the area normalization technique; the absolute content of each component was determined using the internal standard method, utilizing the concentration of 2-methyl-3-heptanone as the internal standard following the specified Formula (1):
where C represents the absolute content of an individual component, in mg/kg; A_1_ denotes the peak area of a single component; A_2_ indicates the peak area of an internal standard; C_2_ specifies the mass concentration of an internal standard, in μg/mL; V_2_ represents the volume of an internal standard, in μL; and M stands for the mass of the sample, in g.
OAV analysis: The content of each component obtained after quantitative analysis cannot be used as the basis for determining the key aromatic components, which can be further screened by using the volatile component OAV, and compounds with an OAV value ≥ 1 are usually regarded as contributing to the aroma characteristics, and when the OAV value is > 10, their overall aroma contribution is great [21]. After calculating the absolute content of each volatile component, the odor thresholds were determined by searching the relevant literature [51,52,53], and the odor activity value of each volatile component was calculated according to Formula (2):
where OAV denotes the odor activity value of a component; C_i_ represents the absolute content of a component, measured in μg/kg; and T_i_ signifies the odor threshold of a component, also in μg/kg.
3.5. Data Analysis
Screening searches for chemical constituents and data processing were carried out using databases like NIST 107.LIB and Microsoft Excel 2019 software; Venn plots were generated using an online website: “https://bioinfogp.cnb.csic.es/tools/venny/index.html” (accessed on 1 July 2024); cluster plotting was conducted utilizing bioinformatics tools; histograms and PCA analysis were performed using Origin 2018 software; OPLS-DA analysis was conducted using SIMCA 14.1 software. The component percentages were calculated as average values from duplicate GC-MS analyses of all the extracts.
4. Conclusions
In this study, CAVAs and CADBs were subjected to two pretreatments, namely immersion and ultrasound–microwave procedures, and were extracted by steam distillation to collect the hydrosols. The volatile components present in the hydrosol were concentrated and identified using HS-SPME-GC-MS. The results can provide a theoretical basis for the direction of mining the functions of the aroma components of CAVA hydrosols and CADB hydrosols. The results show that 67, 54, 32, and 26 kinds were detected in the four hydrosols, respectively, and a total of 106 kinds were detected by removing replicates. A comparison with previous studies (2060 kinds) showed a significant increase in the number of compounds detected in lime flowers, with the main volatile components in all four hydrosols being alcohols, alkenes, and esters, with cumulative relative contents of 77.17%, 80.82%, 86.12% and 85.05%, respectively, and the high content components of both CAVA hydrosols and CADB hydrosols were identified as linalool (36.7956.54%), α-terpineol (9.4213.04%), and trans-geraniol (6.527.92%).
In terms of variety, the total components (67, 54 kinds) and unique components (66 kinds) of CAVA hydrosols far exceeded those of CADB hydrosols (32, 26 kinds)/18 kinds, respectively; the relative contents of 13 components such as d-carvone, β-myrcene, d-limonene, neryl acetate, etc., of CAVA hydrosols are greater than those of CADB hydrosols, ranging from 1 to 15-fold, with neryl acetate and geranyl acetate having the highest multiples of up to 9.85 and 15-fold; CAVA hydrosols and CADB hydrosols possess citrus, floral, and woody scents, with the distinctive aroma of CAVA hydrosols, i.e., specifically the OAV values of β-myrcene and d-limonene, surpassing those of CADB hydrosols. The characteristic aroma distinctions between the two can serve as a basis for differentiation in identification.
From the pretreatment, more volatile components were retained in the immersion (67, 32 kinds) compared to in the ultrasound–microwave procedure (54, 26 kinds). The relative contents of the main components, i.e., linalool (44.38%) and α-terpineol (10.81%, 13.04%), were higher in the ultrasound–microwave procedure than in the immersion (36.79%; 9.42%, 11.99%, respectively); the ultrasound–microwave procedure was favorable for the stimulation of the aroma of CAVA hydrosols (increased OAV of linalool, β-myrcene, trans-geraniol and d-limonene), but it would diminish the aroma of the CADB hydrosols (decreased OAV of linalool, trans-geraniol, β-myrcene and d-limonene).
CADB hydrosols are suitable for use only in the daily chemical industry, while in addition to the pharmaceutical and daily chemical industry, CAVA hydrosols may be used in the food industry based on edible components like d-limonene, neryl acetate, geranyl acetate, caryophyllene oxide, etc., which have a wide range of benefits. These hydrosols can be collected through an appropriate process as per specific needs for utilization. Importantly, the safety profile of using these hydrosols in food is superior to pharmaceuticals, with long-term consumption potentially yielding preventive health benefits that drugs may not provide. Additionally, CAVA hydrosols have a unique food property and can be directly used in food development; their application prospects are broad. This study provides a research basis for the in-depth exploration of the basis of the medicine food homology properties of CAVAs as well as the in-depth development and application of the CAVA hydrosols and CADB hydrosols and could potentially enhance the efficiency of waste resource utilization and drive advancements in relevant industries.
The reference list from the paper itself. Each links out to its DOI / PubMed record.
- 1Chinese Pharmacopoeia Commission Pharmacopoeia of the People’s Republic of China China Medical Science Press Beijing, China 2020257
- 2Sarrou E. Chatzopoulou P. Dimassi-Theriou K. Therios I. Volatile constituents and antioxidant activity of peel, flowers and leaf oils of Citrus aurantium L. growing in Greece Molecules 201318106391064710.3390/molecules 18091063924002139 PMC 6270488 · doi ↗ · pubmed ↗
- 3Park A. Yang Y.J. Lee Y.H. Jung H.Y. Kim T.D. Noh J.Y. Lee S.J. Yoon S.R. Aurantii Fructus Immaturus enhances natural killer cytolytic activity and anticancer efficacy in vitro and in vivo Front. Med.2022997368110.3389/fmed.2022.97368136059847 PMC 9433751 · doi ↗ · pubmed ↗
- 4Gao T.H. Jiang M.Y. Deng B. Zhang Z. Fu Q. Fu C.M. Aurantii Fructus: A systematic review of ethnopharmacology, phytochemistry and pharmacology Phytochem. Rev.20212090994410.1007/s 11101-020-09725-1 · doi ↗
- 5Li H.H. Liu X. Huang S. Chinese Aurantii Fructus industry development status and Jiangjin Aurantii Fructus development prospect analysis China Fruit News 2022391720
- 6National Administration of Traditional Chinese Medicine Editorial Committee of Chinese Materia Medica Chinese Materia Medica Shanghai Science and Technology Press Shanghai, China 1999884885
- 7Chinese Academy of Sciences Editorial Committee of Flora of China Flora of China Science Press Beijing, China 1997194
- 8Shen C.Y. Wang T.X. Zhang X.M. Jiang J.G. Various Antioxidant Effects Were Attributed to Different Components in the Dried Blossoms of Citrus aurantium L. var. amara Engl J. Agric. Food Chem.2017656087609210.1021/acs.jafc.7b 0224428686835 · doi ↗ · pubmed ↗