Trends and inequalities in neonatal mortality rate in Bangladesh: Evidence from cross‐sectional surveys
Rakhi Dey, Satyajit Kundu, Kobi V. Ajayi, Humayun Kabir, Md. Hasan Al Banna

TL;DR
This study examines how neonatal mortality rates in Bangladesh have changed over time and highlights inequalities linked to wealth, education, and region.
Contribution
The study provides new evidence on wealth-, education-, and region-based inequalities in neonatal mortality in Bangladesh using longitudinal survey data.
Findings
Neonatal mortality rates in Bangladesh declined from 50.2 to 31.9 deaths per 1000 live births between 2000 and 2017.
Significant disparities in neonatal mortality were found based on wealth, mother's education, and regional differences.
Urban–rural inequalities in neonatal mortality were significant until 2017, with a decreasing trend over time.
Abstract
Given the significance of addressing neonatal mortality in pursuing the 2030 Sustainable Development Goal on child health, research focus on this area is crucial. Despite the persistent high rates of neonatal mortality rate (NMR) in Bangladesh, there remains a notable lack of robust evidence addressing inequalities in NMR in the country. Therefore, this study aims to fill the knowledge gap by comprehensively investigating inequalities in NMR in Bangladesh. The Bangladesh Demographic and Health Survey (BDHS) data from 2000 to 2017 were analyzed. The equity stratifiers used to measure the inequalities were wealth status, mother's education, place of residence, and subnational region. Difference (D) and population attributable fraction (PAF) were absolute measures, whereas population attributable risk (PAR) and ratio (R) were relative measures of inequality. Statistical significance was…
Genes, proteins, chemicals, diseases, species, mutations and cell lines named across the full text — each resolved to its canonical identifier and authoritative record.
Click any figure to enlarge with its caption.
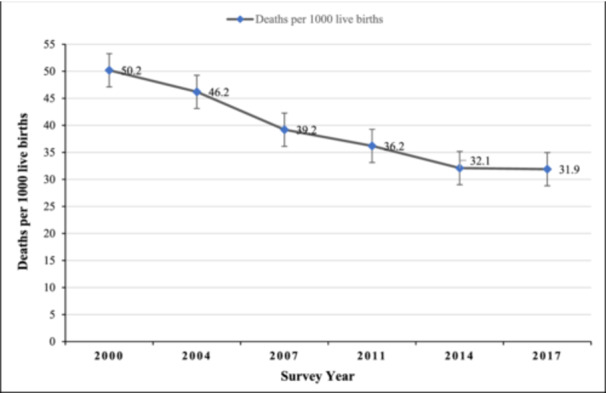 Figure 1
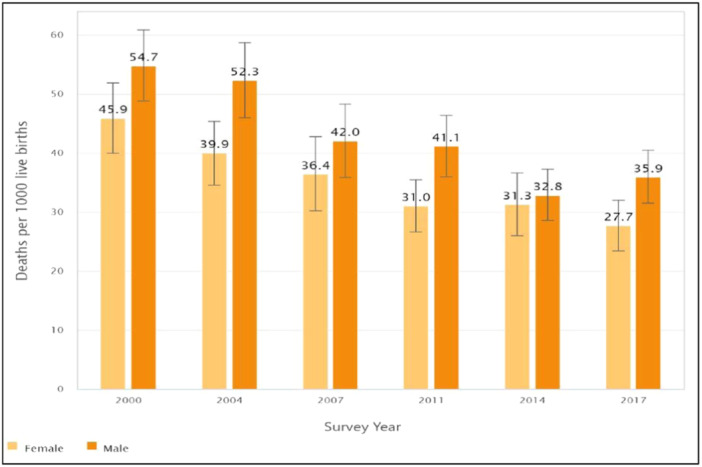 Figure 2
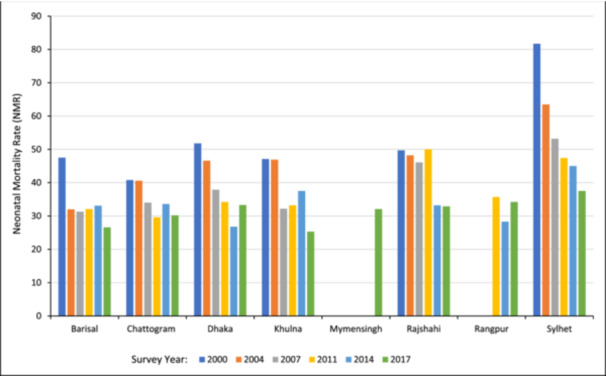 Figure 3
| Inequality dimension | 2000 | 2004 | 2007 | 2011 | 2014 | 2017 | ||||||
|---|---|---|---|---|---|---|---|---|---|---|---|---|
|
| Estimate (95% CI) |
| Estimate (95% CI) |
| Estimate (95% CI) |
| Estimate (95% CI) |
| Estimate (95% CI) |
| Estimate (95% CI) | |
|
| ||||||||||||
| Quintile 1 (poorest) | 3522 | 54.3 (45.7, 62.9) | 3651 | 54.7 (44.5, 64.9) | 3023 | 48.3 (35.8, 60.8) | 4532 | 38.5 (31.6, 45.5) | 4062 | 41.6 (32.8, 50.5) | 3998 | 34.8 (28.3, 41.4) |
| Quintile 2 | 3191 | 61.1 (50.6, 71.5) | 3161 | 42.5 (34.2, 50.8) | 2735 | 44.0 (34.2, 53.8) | 3782 | 42.5 (35.2, 49.8) | 3417 | 31.7 (23.1, 40.4) | 3580 | 32.4 (24.3, 40.5) |
| Quintile 3 | 2699 | 53.6 (44.8. 62.5) | 2705 | 49.7 (39.9, 59.5) | 2459 | 39.6 (29.9, 49.3) | 3540 | 36.3 (28.2, 44.4) | 3294 | 34.1 (25.7, 42.5) | 3246 | 35.1 (27.6, 42.7) |
| Quintile 4 | 2356 | 40.3 (32.8, 47.8) | 2491 | 38.8 (30.3, 47.3) | 2234 | 32.4 (23.4, 41.5) | 3487 | 38.2 (29.6, 46.8) | 3216 | 30.3 (22.6, 38.1) | 3491 | 31.2 (24.1, 38.3) |
| Quintile 5 (richest) | 2168 | 35.1 (26.0, 44.2) | 2257 | 41.5 (32.7, 50.3) | 2116 | 26.8 (18.5, 35.1) | 3226 | 23.3 (17.6, 29.0) | 3072 | 19.5 (13.0, 26.0) | 3265 | 25.3 (18.2, 32.5) |
|
| ||||||||||||
| No Education | 7192 | 55.4 (48.9, 61.9) | 6385 | 52.5 (45.5, 59.4) | 4406 | 46.8 (37.0, 56.7) | 4846 | 42.6 (34.7, 50.4) | 3764 | 36.1 (27.3, 44.8) | 1924 | 28.9 (19.6, 38.2) |
| Primary School | 3901 | 48.0 (39.8, 56.2) | 4397 | 45.0 (38.2, 51.8) | 3954 | 37.5 (30.4, 44.6) | 6009 | 37.8 (32.1, 43.4) | 5080 | 36.0 (28.6, 43.3) | 5608 | 39.6 (32.9, 46.3) |
| Secondary/higher | 2844 | 41.0 (32.5, 49.4) | 3483 | 36.2 (29.0, 43.4) | 4181 | 33.1 (26.2, 39.9) | 7711 | 31.0 (26.2, 35.8) | 8218 | 27.8 (23.2, 32.4) | 10048 | 28.2 (24.3, 32.2) |
|
| ||||||||||||
| Rural | 11628 | 52.0 (46.8, 57.3) | 11384 | 46.8 (41.7, 51.9) | 10016 | 40.8 (34.7, 46.9) | 14416 | 37.4 (33.5, 41.4) | 12745 | 33.2 (29.4, 36.9) | 12778 | 32.3 (28.5, 36.1) |
| Urban | 2309 | 42.1 (32.6, 51.5) | 2881 | 43.9 (35.7, 52.0) | 2551 | 33.2 (26.8, 39.7) | 4150 | 32.0 (25.6, 38.4) | 4316 | 28.9 (22.3, 35.5) | 4802 | 30.8 (25.0, 36.6) |
|
| ||||||||||||
| Barisal | 873 | 47.5 (31.6, 63.4) | 895 | 32.0 (21.4, 42.6) | 804 | 31.3 (23.5, 39.1) | 1011 | 32.1 (24.9, 39.3) | 991 | 33.1 (23.0, 43.3) | 968 | 26.6 (19.1, 34.1) |
| Chattogram | 3021 | 40.8 (32.4, 49.2) | 3001 | 40.6 (32.6, 48.5) | 2640 | 34.0 (22.5, 45.5) | 4068 | 29.6 (23.3, 35.9) | 3673 | 33.6 (25.2, 41.9) | 3680 | 30.2 (22.8, 37.5) |
| Dhaka | 4257 | 51.8 (41.4, 62.1) | 4513 | 46.6 (38.0, 55.3) | 4000 | 37.9 (29.7, 46.2) | 5902 | 34.2 (27.4, 40.9) | 5920 | 26.8 (21.0, 32.5) | 4446 | 33.3 (25.2, 41.4) |
| Khulna | 1399 | 47.1 (36.5, 57.8) | 1451 | 46.9 (34.1, 59.6) | 1266 | 32.2 (20.8, 43.6) | 1725 | 33.2 (25.6, 40.8) | 1346 | 37.5 (27.6, 47.4) | 1634 | 25.3 (17.7, 33.0) |
| Mymensingh | ‐ | ‐ | ‐ | ‐ | ‐ | ‐ | ‐ | ‐ | ‐ | ‐ | 1447 | 32.1 (23.7, 40.4) |
| Rajshahi | 3350 | 49.7 (41.2, 58.1) | 3245 | 48.2 (37.7, 58.8) | 2749 | 46.1 (31.9, 60.3) | 2418 | 50.0 (38.3, 61.6) | 1721 | 33.2 (25.9, 40.6) | 2064 | 32.9 (25.8, 39.9) |
| Rangpur | ‐ | ‐ | ‐ | ‐ | ‐ | ‐ | 2029 | 35.7 (25.4, 46.0) | 1698 | 28.3 (18.8, 37.7) | 1923 | 34.2 (25.6, 42.8) |
| Sylhet | 1037 | 81.7 (65.1, 98.3) | 1161 | 63.5 (50.7, 76.2) | 1108 | 53.2 (38.1, 68.3) | 1412 | 47.4 (37.5, 57.4) | 1713 | 45.0 (36.0, 54.0) | 1418 | 37.5 (26.7, 48.3) |
| 2000 | 2004 | 2007 | 2011 | 2014 | 2017 | |||||||
|---|---|---|---|---|---|---|---|---|---|---|---|---|
| Inequality dimension | Estimate | 95% CI | Estimate | 95% CI | Estimate | 95% CI | Estimate | 95% CI | Estimate | 95% CI | Estimate | 95% CI |
|
| ||||||||||||
|
| 19.2 | 6.7, 31.7 | 13.2 | −0.2, 26.6 | 21.5 | 6.5, 36.4 | 15.3 | 6.3, 24.2 | 22.1 | 11.2, 33.1 | 9.5 | −0.2, 19.1 |
| PAF | −30.3 | −34.0, −26.6 | −10.1 | −14.2, −6.1 | −31.6 | −36.1, −27.1 | −35.7 | −39.5, −32.0 | −39.2 | −43.3, −35.1 | −20.6 | −24.9, −16.3 |
| PAR | −15.3 | −17.1, −13.4 | −4.7 | −6.5, −2.8 | −12.4 | −14.2, −10.6 | −12.9 | −14.3, −11.6 | −12.6 | −13.9, −11.3 | −6.6 | −7.9, −5.2 |
|
| 1.5 | 1.1, 2.1 | 1.3 | 1.0, 1.7 | 1.8 | 1.2, 2.7 | 1.7 | 1.2, 2.2 | 2.1 | 1.4, 3.2 | 1.4 | 1.0, 1.9 |
|
| ||||||||||||
| D | 14.4 | 3.8, 25.0 | 16.2 | 6.2, 26.2 | 13.8 | 1.8, 25.7 | 11.6 | 2.3, 20.8 | 8.2 | −1.6, 18.1 | 0.7 | −9.4, 10.7 |
| PAF | −18.7 | −21.9, −15.5 | −21.6 | −24.6, −18.5 | −15.9 | −18.9, −12.9 | −14.4 | −16.6, −12.1 | −13.2 | −15.5, −10.9 | −11.6 | −13.4, −9.7 |
| PAR | −9.4 | −11.0, −7.8 | −10.0 | −11.4, −8.6 | −6.2 | −7.4, −5.1 | −5.2 | −6.0, −4.4 | −4.2 | −5.0, −3.5 | −3.7 | −4.3, −3.1 |
|
| 1.4 | 1.1, 1.7 | 1.4 | 1.1, 1.8 | 1.4 | 1.1, 1.9 | 1.4 | 1.1, 1.7 | 1.3 | 1.0, 1.7 | 1.0 | 0.7, 1.5 |
|
| ||||||||||||
|
| 10.0 | −0.7, 20.7 | 2.9 | −6.6, 12.4 | 7.5 | −1.3, 16.3 | 5.4 | −2.1, 12.9 | 4.2 | −3.3, 11.8 | 1.5 | −5.4, 8.4 |
| PAF | −16.5 | −20.2, −12.9 | −5.1 | −8.6, −1.6 | −15.3 | −19.5, −11.1 | −11.6 | −15.1, −8.1 | −9.9 | −13.5, −6.2 | −3.4 | −6.9, 0.1 |
| PAR | −8.3 | −10.2, −6.5 | −2.3 | −4.0, −0.7 | −6.0 | −7.6, −4.4 | −4.2 | −5.5, −2.9 | −3.2 | −4.3, −2.0 | −1.1 | −2.2, 0.0 |
|
| 1.2 | 1.0, 1.6 | 1.1 | 0.9, 1.3 | 1.2 | 1.0, 1.6 | 1.2 | 0.9, 1.5 | 1.1 | 0.9, 1.5 | 1.0 | 0.8, 1.3 |
|
| ||||||||||||
|
| 40.8 | 22.8, 58.9 | 31.5 | 15.4, 47.5 | 21.9 | 5.4, 38.4 | 20.4 | 7.3, 33.4 | 18.2 | 7.7, 28.8 | 12.2 | −0.9, 25.2 |
| PAF | −19.0 | −22.1, −15.9 | −30.7 | −37.2, −24.3 | −20.2 | −28.1, −12.2 | −18.2 | −21.7, −14.7 | −16.5 | −19.5, 13.6 | −20.6 | −27.0, −14.3 |
| PAR | −9.6 | −11.1, −8.0 | −14.2 | −17.2, −11.2 | −7.9 | −11.0, −4.8 | −6.6 | −7.8, −5.3 | −5.3 | −6.2, −4.4 | −6.6 | −8.6, −4.6 |
|
| 2.0 | 1.5, 2.7 | 2.0 | 1.4, 2.9 | 1.7 | 1.2, 2.5 | 1.7 | 1.2, 2.3 | 1.7 | 1.3, 2.2 | 1.5 | 1.0, 2.2 |
Peer Reviews
No public reviews on file for this paper yet. If you reviewed it on a platform where reviews are public (OpenReview, ICLR, NeurIPS, ICML), you can paste yours below so the community can read it here.
Videos
No videos yet. Explain this paper in a talk, walkthrough, or lecture? Add one.
Taxonomy
TopicsGlobal Maternal and Child Health · Global Health Care Issues · Healthcare Systems and Reforms
INTRODUCTION
1
A child under 28 days of age is referred to as a newborn infant or neonate.1 Globally, neonatal mortality and morbidity are prevalent and are a significant public health issue. Newborns are most vulnerable during their first 28 days of life, with the highest risk of mortality occurring in developing countries with limited access to healthcare.1 In 2020, an estimated 2.4 million children died in the first month of life alone—accounting for 40% of all under‐five deaths.2 While there has been significant progress in reducing neonatal deaths since the 1990s—albeit slower than deaths after the first month of life, inequalities in survival persist, with a greater proportion of neonatal deaths recorded in low‐resourced countries such as central and southern Asia.2, 3, 4 For example, after sub‐Saharan Africa, Central and South Asia have the second‐largest estimated neonatal mortality rate of 23 deaths per 1000 live births compared to the average global rate of 18 deaths per 1000 live births.2, 3 The high neonatal mortality and morbidity in these regions threaten the realization of the United Nations' Sustainable Development Goals (SDGs), calling for the reduction of preventable neonatal deaths to at least 12 per 1000 live births by 2030.5
Bangladesh has substantially reduced neonatal mortality and morbidity over the past decades.6, 7 Between 1990 and 2010, neonatal mortality decreased from 55 to 27 per live births.8 However, despite progress, a country report in 2021 indicates that the country's neonatal mortality rate (NMR) is 30 per 1000 live births,9 which is still high. Several reports have reported that while under‐five mortality declined in Bangladesh, neonatal mortality did not.3, 10 For example, using a pooled 2004, 2007, and 2011 BDHS data, Abir and colleagues found a significant reduction of 48% in postneonatal deaths (1–11 months), 33% reduction in infant deaths (0–11 months), and 29% decline for under‐5 deaths (0–4 years). In contrast, there was no significant decrease in neonatal deaths (0–28 days). Another study in 2016 found that among 6748 newborn deaths, 46% identified occurred within 24 h, and 83.6% within the first 7 days of life.11 Even more alarming is that in addition to the high NMR trend in the country, there are geographic disparities, with higher rates reported in rural areas than national averages. For example, in a rural community‐based cohort, authors reported an NMR of 43.4 per 1000 live births.12 Considering that over 65% of Bangladeshis live in areas with high NMR, investigating the drivers associated with inequalities in NMR is paramount.
Several complex factors influence NMR, including biological, socioeconomic, demographic, health system, and cultural and religious practices.10, 11, 12, 13, 14, 15, 16 Furthermore, qualitative studies suggest a vast lack of evidence‐based knowledge and prevalent negative preconceived beliefs about neonatal complications and deaths, which could derail positive health‐seeking behaviors, lead to stigmatization, and a lack of adherence to appropriate public health and clinical intervention.17, 18 A study in Tanzania reported that women in rural and underprivileged regions with lower socioeconomic positions had a higher chance of their newborns dying.19 In contrast, socioeconomic disparity related to neonatal mortality increased significantly in Tanzania over time, according to different research.20 Roy and Haque conducted a study in Bangladesh and identified a direct association between wealth status and NMR, where women from wealthier households were less likely to experience NMR compared to the poorest ones.21 Another multi‐country study, including Bangladesh, shows that higher maternal education and better wealth status are significant predictors of lowering NMR.15
Social determinants of health (SDH), which the World Health Organization (WHO) defines as “the conditions in which people are born, grow, work, live, and age,” are responsible for 30 to 55 percent of health outcomes and have a negative effect on health outcomes for persons from stigmatized racial/ethnic groups and those with poor socioeconomic status.22, 23 It is argued that when it comes to impacting health, social factors may have greater significance than health care or lifestyle decisions, and therefore, improving health and lowering persistent disparities in health require addressing SDH effectively.22 To examine the disparities in newborn mortality based on key SDHs in Bangladesh, this study used the conceptual framework of the Commission on Social Determinants of Health (CSDH). Identifying the social determinants of disparities in health, demonstrating the relationships between main determinants, demonstrating how social determinants lead to health inequalities, and assessing which SDHs are most important to address are all part of the CSDH conceptual framework.24
However, as per our knowledge, relatively little research that has been done in Bangladesh has focused chiefly on the wealth‐based inequalities in NMR using the concentration index indices only25, 26, 27 and overlooked the other key SDH, including maternal education, place of residence, and geography. The concentration index indices may not be suitable for non‐ordered variables like place of residence and regions.28 Moreover, the utilization of who‐recommended inequality analysis is imperative to surmount the constraints of prior research in reducing the bias and producing precise differences in NMR amongst subpopulations. The WHO advised assessing equity in several healthcare variables using absolute and relative inequality measures in addition to simple and complex weighted metrics.29 These summary metrics applied to this paper appropriately identify inequalities where they exist by using disaggregated analysis to capture various aspects of inequality and show a trend of inequality over time.30 Applying similar inequality measures, a study in Ethiopia also identified socioeconomic‐based inequality in NMR.31 Given the body of previous literature, we hypothesized that there would be notable disparities in NMR in Bangladesh based on wealth, education, residency, and geography.
Burgeoning research notwithstanding, NMR rates remain high in Bangladesh, and inequalities persist. As a result, it is pertinent to conduct further precise investigations into the phenomenon to inform public health efforts in the country. To this end, utilizing the CSDH conceptual framework to fill a gap in previous neonatal mortality literature for Bangladesh, this study aims to investigate the trends and inequalities in NMR in Bangladesh using the 2000 to 2017 Bangladesh Demographic and Health Survey. Considering that it would take an 8.4% annual reduction rate in neonatal mortality to save an excess of 300,000 lives and to achieve the 2030 SDG goals of 12 per 1000 live births,9 this study is a step in the right direction toward accelerating neonatal survival in Bangladesh.
METHOD
2
Study design and data source
2.1
Data were extracted from the last five waves of BDHS between 2000 and 2017 for this study to measure the inequalities in Bangladesh's Neonatal mortality rate (NMR). BDHS data is a part of the MEASURE Demographic and Health Survey (DHS), which is conducted in over 90 countries globally. To collect the data, DHS adopts the cross‐sectional design, and all data are deposited in the online build‐in database edition of the Health Equity Assessment Toolkit (HEAT) by WHO. The DHS employs a two‐stage stratified cluster sampling approach for data collection to provide a countrywide representation. The primary sampling unit (PSU) and clusters were identified in the first step of the sampling procedure by selecting the enumeration regions from the most recent population census. Using a systematic sampling procedure, 30 households were chosen from the chosen clusters to participate in the survey. The comprehensive technique of BDHS is expounded upon in other places.32
Outcome variable
2.2
Neonatal mortality rate (NMR) was the variable of interest in this study. NMR in Bangladesh was measured based on the 5 years preceding the surveys.32 NMR was presented as the number of neonatal deaths per 1000 live births. The dates of neonatal birth and the age at which they passed away are included in the BDHS birth record data (BR file). The number of deaths during the first 28 full days of life per 1000 live births in a particular year or other period is known as the neonatal mortality rate.33
Equity stratifiers
2.3
To measure the inequalities in NMR in Bangladesh, these equity stratifiers were considered: household wealth status, mother's educational level, place of residence, and subnational regions. The household wealth status was measured as a quintile categorizing from poorest to richest. The categorization was derived by the principal component analysis (PCA).34 The completion of formal education was considered as the educational level of the mother of the children and divided as no education, primary, and secondary/higher. Rural and urban were considered as the categories of residence, and the administrative divisions of Bangladesh were considered the subnational regions. Among these equity dimensions, household wealth status and mother's education were considered socioeconomic dimensions, and place of residence and subnational regions were geographical dimensions.
Statistical measures
2.4
According to the WHO's recommendation, we used both absolute and relative summary measures to measure the inequalities in NMR in Bangladesh.35 For the analysis, we used the HEAT software by WHO (version 4.0). As the absolute summary measures, we chose D and PAF, while PAR and Ratio R were adopted as the relative measures. At the same time, D and R were simple measures, and PAF and PAR were complex weighted measures considering the survey design and weight. The summary measures were chosen such that they are applicable to all equity stratifiers whether it is ordinal variables or not. The measurements and use of the summary measures are described elaborately by WHO.35
The calculation of the summary measures differs in the case of ordered and non‐ordered dimensions. In the case of the ordered dimension, D is the simple difference between the highest and lowest sub‐group for the favorable outcome. For example, the D for the wealth quintile as an ordered variable is the difference between the richest and the poorest group. R is calculated as the ratio of the highest and lowest sub‐groups for each variable. For instance, R is the quotient of the prevalence of the group with secondary/higher educational attainment by the prevalence of the group with no education. D is the difference between the group with the greatest prevalence and the group with the lowest prevalence, and R is the quotient of the highest prevalence by the lowest prevalence for the non‐ordered variables, such as place of residence and subnational regions.36 Unlike simple measures, complex measures like PAF and PAR took the population‐level average and sample weight into account. For our analysis, we have considered the national average (μ) as the population mean and calculated both measures. The measurements of PAR and PAF are
The national average, in this case, is μ. For ordered variables, the Y ref represents the most favored group; for non‐ordered variables, it represents the most prevalent sub‐group. The summary measures' computations and underlying presumptions are explained elsewhere.28 The significance level of the summary measures was shown through a 95% confidence interval with the point estimate of each measure. The value of the summary measures, namely D, PAF and PAR, was considered significant if their corresponding confidence intervals did not contain 0 within the upper and lower limits. For the value of R to be significant, the confidence corresponding to the value must not contain 1 in the interval.
RESULTS
3
Trends and distribution of NMR across different sub‐groups
3.1
A decreasing trend of NMR in Bangladesh was observed from 50.2 deaths per 1000 live births in 2000 to 31.9 deaths per 1000 live births in 2017 (Figure 1). When the NMR was stratified by the sex of the children, male children showed a higher mortality rate than the females over time (Figure 2). NMR was observed to be higher among the poorest sub‐group than those from the wealthiest households in all survey waves. Compared to the richest wealth status, NMR was higher by 19.2 deaths per 1000 live births in 2000, and 9.5 deaths per 1000 live births in 2017 among the poorest sub‐group. NMR was also found to be higher among mothers with no formal education than among mothers who had completed secondary or higher education from 2000 to 2014, except in 2017. In 2000, NMR was higher by 14.4 per 1000 live births, and by 8.3 in 2014 among mothers with no formal education compared to mothers with secondary or higher education. In every survey year, a higher NMR was found in the rural areas compared to the urban areas. The NMR was higher by 9.9 per 1000 live births in 2000, 7.6 in 2007, and 1.5 in 2017 among rural children compared to urban children (Table 1).
Trends in neonatal mortality rate in Bangladesh from 2000 to 2017.
Neonatal mortality rates in Bangladesh by the sex of child from 2000 to 2017.
Figure 3 illustrates the distribution of NMR in Bangladesh by administrative divisions from 2000 to 2017. It shows that NMS has declined gradually in each administrative division of Bangladesh. In 2000, the highest NMR was found in Sylhet (81.7 deaths per 1000 live births), which has declined over time; however, it still shows the highest in 2017 (37.5 deaths per 1000 live births). On the contrary, Chittagong had the lowest rate in 2000, while the lowest rate in 2017 was found in Khulna division (25.3 deaths per 1000 live births).
Neonatal mortality rates in Bangladesh by administrative division from 2000 to 2017. Mymensingh division was separated from Dhaka division in 2015, and Rangpur division was separated from Rajshahi division in 2010. Hence, the estimates for BDHS 2000–2014 data of Mymensingh, and BDHS 2000–2007 data of Rangpur division are not shown in the figure.
Inequalities in NMR based on four equity stratifiers
3.2
The results showed that sub‐groups with low socioeconomic status (SES) had a higher burden of NMRs over the years than high SES sub‐groups. Over the past two decades, we identified significant wealth‐driven disparities in NMR by both simple (D, R) and weighted complex (PAR, PAF) measures, with a higher rate among the poorest sub‐groups compared to the richest. For example, the PAF measure of −20.6 in 2017 (95% CI: −24.9, −16.3) indicated a significant wealth‐related inequality with a greater burden on the poorest sub‐group. From 2000 to 2017, this study showed significant inequalities based on the educational qualification of mothers, with higher rates among the sub‐group having no formal education. For instance, in 2017, the PAR measures of −3.7 (95% CI: −4.3, −3.1) indicated significant education‐related disparities in NMR, with a higher burden among children of mothers having no formal education. Besides, the study also identified significant pro‐urban inequalities in NMR from 2000 to 2014 based on both weighted measures (PAF, PAR) while disfavoring the children from rural areas. However, the rural‐urban inequalities were not significant in 2017. A decline in the inequalities was also observed with the PAF measure of −16.5 (95% CI: −20.2, −12.9) in 2000 to −9.9 in 2014 (95% CI: −13.5, −6.2). The PAF and PAR measures of −20.6 (95% CI: −27.0, −14.3) and −6.6 (95% CI: −8.6, −4.6), respectively, in 2017 showed that significant absolute and relative geographical inequalities in NMR with higher burden in Sylhet division in Bangladesh (Table 2).
DISCUSSION
4
Using nationally representative data, we investigated trends and inequities in the NMR in Bangladesh. We found a downward trend in NMR during the last two decades, indicating that Bangladesh is on the way to making progress in the field of newborn health. This encouraging development might be attributed to a collaborative effort by all departments, such as enhanced healthcare services, increased access to childbirth and neonatal care, and maternal and child health awareness campaigns.37 However, despite the positive trends, disparities exist across socioeconomic stratifiers, such as household wealth status, mother's education, place of residence, and geographical regions that align with the CSDH conceptual framework and also support our hypotheses.
Similar to previous studies, our study found that male neonates had a higher mortality rate compared to females. For example, Zegeye and Yaya et al. utilized the Demographic and Health Surveys to calculate the NMR in Guinea and Burundi and found sex‐based inequalities.33, 38 In Nepal's rural Salahi area, authors found boys had higher mortality in the first week of life but reversed by the fourth week, with higher mortality in girls compared to boys.39 Another Australian 14‐year retrospective analysis found that among newborns, males have a higher risk of mortality and severe morbidity.40 Previous research suggests that this disparity could be attributed to biological, societal, and healthcare‐related factors.41, 42 Despite the persistent sex‐related inequalities in NMR, comprehensive strategies should be adopted to improve neonatal care throughout pregnancy and up to birth for all newborns and neonates. For this, understanding the underlying causes of this trend and high NMR is essential to developing effective policies and targeted public health efforts to protect infant health. Previous study43 also displays several affordable and impactful interventions that can help lower NMR in areas with high mortality rates and limited resources by addressing the main causes of infant deaths, including premature birth, intrapartum‐related incidents, and infections.
Our study's wealth‐driven inequalities in NMR emphasize the significance of SES in newborn health outcomes. Similar to our findings, Miladinov et al. found that the inequalities increased among the population with poor SES in Macedonia, Turkey, and Albania.44 Access to essential healthcare services, such as prenatal and neonatal care, may be challenging for families with minimal financial resources.45 Inadequate nutrition during pregnancy is frequently related to lower socioeconomic status, which can contribute to poor fetal development and enhance the risk of NMR.46 Effective policies and actions that emphasize the populations with the lowest SES are required to address these issues. Further, strategies such as financial support programs, community health efforts, and insurance schemes should be implemented to promote accessibility and close the NMR gap between wealth groups.33, 38
We observed discrepancies in NMR in Bangladesh are based on maternal education level highlights the crucial impact of a mother's formal educational level on neonatal health. Nguyen‐Phung found higher NMR in Vietnam when the mothers had a low education.47 Similarly, a higher NMR was also found among children of mothers with lower education in Rio Grande do SUL, Brazil.48 According to Fonseca et al., women with higher educational qualifications may possess higher knowledge about maternal and neonatal health,49 which can lead to improved healthcare‐seeking behaviors and overall neonatal health.50 As such, initiatives to promote maternal education should be encouraged, as they have the potential to reduce NMR. Targeted education programs for expectant mothers may be instrumental in bringing this educational gap.
The NMR trends have been consistently higher among rural newborns over the last two decades. Inequality indexes were much higher in rural areas than in urban areas. Consistent with our findings, a large cohort study that examined 3409 childhood deaths in England from April 2019 to March 2020 revealed that the risk of mortality was higher in rural areas than in urban areas.51 Another study in Mozambique indicated that among 828,663 samples, the urban regions had lower mortality rates than rural areas among children.52 Rural areas frequently may have fewer healthcare facilities, and those that do exist may be located further from villages.53 In remote regions, poor road networks and transportation infrastructure could prevent timely access to healthcare facilities.54 Therefore, based on consistency with previous studies, we suggest that efforts to improve rural healthcare access may be bearing results. To ensure that this progress is sustained, it is essential to continue investing in rural healthcare infrastructure and services.
We found that there is a significant geographical inequality in NMR, particularly higher NMR in the Sylhet division, highlighting the importance of regionalized interventions. Similar to our study, regional inequalities were reported in the previous studies.55, 56 In Brazil, neonatal deaths from 2000 to 2018 were found to be the lowest in the South.55 According to the findings of the Global Burden of Disease Study in Ethiopia from 1990 to 2019, interregional inequalities in NMR were high.56 Similar to our finding, another study in Bangladesh identified a spatial cluster of high child mortality in the Sylhet region and suggested adopting immediate attention to curve the child mortality in this region.57 One possible explanation for the improved circumstances in the Khulna division might be that women are more likely to be educated and be in the upper wealth quintile.58, 59 However, it was discovered that women in the Sylhet division had less access to medical facilities and more home births, which made them more susceptible to birth infections and an increased risk of under‐five fatalities.60 The geographical characteristics of Sylhet, such as rural or isolated locations, may make it challenging to access healthcare facilities.12 Identifying the unique challenges and health system deficiencies in the Sylhet division is crucial. Targeted healthcare programs, infrastructure development, and community engagement initiatives can help address these geographical inequalities and reduce NMR.
STRENGTHS AND LIMITATIONS
5
Because nationally representative data from the past 20 years and a large sample size have been used, the study's findings could be generalized to all newborns in Bangladesh. To evaluate the magnitude of inequality in NMR, we employed both absolute and relative measures in this study. This approach satisfies the WHO standards for measuring inequality and provides a multifaceted picture of the issue. Finally, utilizing WHO's HEAT system improves our result's appropriateness, accuracy, and reliability. This research has many shortcomings as well. We could not determine the underlying causes of the inequality or any other causal relationship since we measured the inequities using secondary cross‐sectional data. It is also important to note that recollection and reporting bias are common in these studies, limiting the results. Finally, we did not measure other potential variables that might impact our findings, such as maternal comorbidities or antenatal care use.
Policy implication
5.1
This study has several policy implications that must be considered to improve newborn and infant health in Bangladesh. First, improved neonatal care throughout pregnancy and up to birth should be emphasized for all newborns and neonates, with particular attention to those having adverse birth outcomes, such as preterm birth, low birth weight, and so forth. Health systems and policymakers must be deliberate in their effort to facilitate timely, evidence‐based care practices, such as efforts to reduce infections, better nutrition, and improve positive health‐seeking behaviors to close the sex disparities in neonatal mortality and morbidity. Further, this study revealed that numerous social determinants of health (e.g., wealth status, education, and geographical location) contribute to neonatal mortality in Bangladesh. As a result, it is germane that collaborative and interdisciplinary efforts involving upstream and downstream stakeholders are encouraged to reduce neonatal mortality effectively. Such efforts must be targeted and localized to meet the specific needs of caregivers and the communities. It may be beneficial for policymakers to provide universal healthcare coverage and other financial subsidies, particularly for low‐income families, to increase access to quality maternal healthcare services throughout the continuum of care from pregnancy up to at least 1 year of birth. Public health programs and interventions must be created and disseminated in digestible formats and accessible mediums to increase comprehension for mothers with low educational levels. Increasing community‐based programs and interventions using community health workers must also be encouraged to ensure families in rural areas can access maternal health services. In this vein, efforts to strengthen collaboration between health systems and communities must be considered to reduce infant mortality in Bangladesh.
CONCLUSION
6
Addressing the NMR burden is a complex issue, with socioeconomic factors being highly influential. This study shows a significant variation in NMR among different subgroups in Bangladesh. While our investigation indicates an overall decline in NMR over time, it also underscores the persistent and, in some cases, increasing inequalities in NMR in different subgroups, indicating that the current strategies may not fully tackle the diverse underlying causes equitably. Therefore, the findings underscore the critical importance of employing a multifaceted approach to address these inequalities. Empowering women through improved access to economic resources and education may help address disparities in NMR in Bangladesh. Future research and policies should focus on developing strategies to address these disparities, particularly in those with low SES and vulnerable regions like the Sylhet division, that may help promote equitable health outcomes for all newborns.
AUTHOR CONTRIBUTIONS
Rakhi Dey: Conceptualization; methodology; software; writing—original draft; writing—review and editing; formal analysis; data curation. Satyajit Kundu: Conceptualization; methodology; software; data curation; formal analysis; investigation; validation; supervision; writing—review and editing. Kobi V. Ajayi: Validation; writing—review and editing; writing—original draft. Humayun Kabir: Validation; writing—review and editing; writing—original draft. Md. Hasan Al Banna: Validation; Writing—review and editing.
CONFLICT OF INTEREST STATEMENT
The authors declare no conflict of interest.
TRANSPARENCY STATEMENT
The lead author Satyajit Kundu affirms that this manuscript is an honest, accurate, and transparent account of the study being reported; that no important aspects of the study have been omitted; and that any discrepancies from the study as planned (and, if relevant, registered) have been explained.
The reference list from the paper itself. Each links out to its DOI / PubMed record.
- 1World Health Organization . Newborn health. 2024. Accessed April 22, 2024. https://www.who.int/westernpacific/health-topics/newborn-health
- 2World Health Organization . Newborn Mortality. 2022. Accessed November 15, 2023. https://www.who.int/news-room/fact-sheets/detail/levels-and-trends-in-child-mortality-report-2021
- 3UNICEF . Neonatal mortality: The neonatal period is the most vulnerable time for a child. Accessed November 15, 2023. https://data.unicef.org/topic/child-survival/neonatal-mortality/
- 4Hug L , Alexander M , You D , Alkema L . National, regional, and global levels and trends in neonatal mortality between 1990 and 2017, with scenario‐based projections to 2030: a systematic analysis. Lancet Global Health. 2019;7(6):e 710‐e 720.31097275 10.1016/S 2214-109X(19)30163-9PMC 6527519 · doi ↗ · pubmed ↗
- 5United Nations . Sustainable Development Goal 3: Ensure healthy lives and promote well‐being for all at all ages. 2016. Accessed November 15, 2023. https://www.un.org/sustainabledevelopment/health/
- 6Alam N , Zahirul Haq M , Kim Streatfield P . Spatio‐temporal patterns of under‐five mortality in Matlab HDSS in rural Bangladesh. Glob Health Action. 2010;3(1):5252.10.3402/gha.v 3i 0.5252 PMC 293591920838628 · doi ↗ · pubmed ↗
- 7Rajaratnam JK , Marcus JR , Flaxman AD , et al. Neonatal, postneonatal, childhood, and under‐5 mortality for 187 countries, 1970–2010: a systematic analysis of progress towards millennium development goal 4. Lancet. 2010;375(9730):1988‐2008.20546887 10.1016/S 0140-6736(10)60703-9 · doi ↗ · pubmed ↗
- 8Rubayet S , Shahidullah M , Hossain A , et al. Newborn survival in Bangladesh: a decade of change and future implications. Health Policy Plan. 2012;27(suppl 3):iii 40‐iii 56.22692415 10.1093/heapol/czs 044 · doi ↗ · pubmed ↗