Integrative transcriptomic and metabolomic analysis to elucidate the effect of gossypol on Enterobacter sp. GD5
CaiDie Wang, XiaoBin Li, Jun Pan, Chen Ma, ShiQi Zhang, Changjiang Zang, KaiLun Yang

TL;DR
This study explores how gossypol affects the metabolism and gene expression of a rumen microbe, Enterobacter sp. GD5, revealing its role in inducing oxidative stress and activating antioxidant genes.
Contribution
The study provides novel insights into the molecular mechanisms of gossypol tolerance in rumen microorganisms through integrative transcriptomic and metabolomic analysis.
Findings
Gossypol altered the metabolic profiles of 15 metabolites in Enterobacter sp. GD5.
Transcriptomic analysis showed significant changes in 132 genes, particularly those related to antioxidative stress.
Gene Ontology analysis indicated that gossypol affects homeostatic processes in the microbe.
Abstract
Gossypol, a yellow polyphenolic compound found in the Gossypium genus, is toxic to animals that ingest cotton-derived feed materials. However, ruminants display a notable tolerance to gossypol, attributed to the pivotal role of ruminal microorganisms in its degradation. The mechanisms of how rumen microorganisms degrade and tolerate gossypol remain unclear. Therefore, in this study, Enterobacter sp. GD5 was isolated from rumen fluid, and the effects of gossypol on its metabolism and gene expression were investigated using liquid chromatography-mass spectrometry (LC-MS) and RNA analyses. The LC-MS results revealed that gossypol significantly altered the metabolic profiles of 15 metabolites (eight upregulated and seven downregulated). The Kyoto Encyclopedia of Genes and Genomes analysis results showed that significantly different metabolites were associated with glutathione metabolism in…
Genes, proteins, chemicals, diseases, species, mutations and cell lines named across the full text — each resolved to its canonical identifier and authoritative record.
Click any figure to enlarge with its caption.
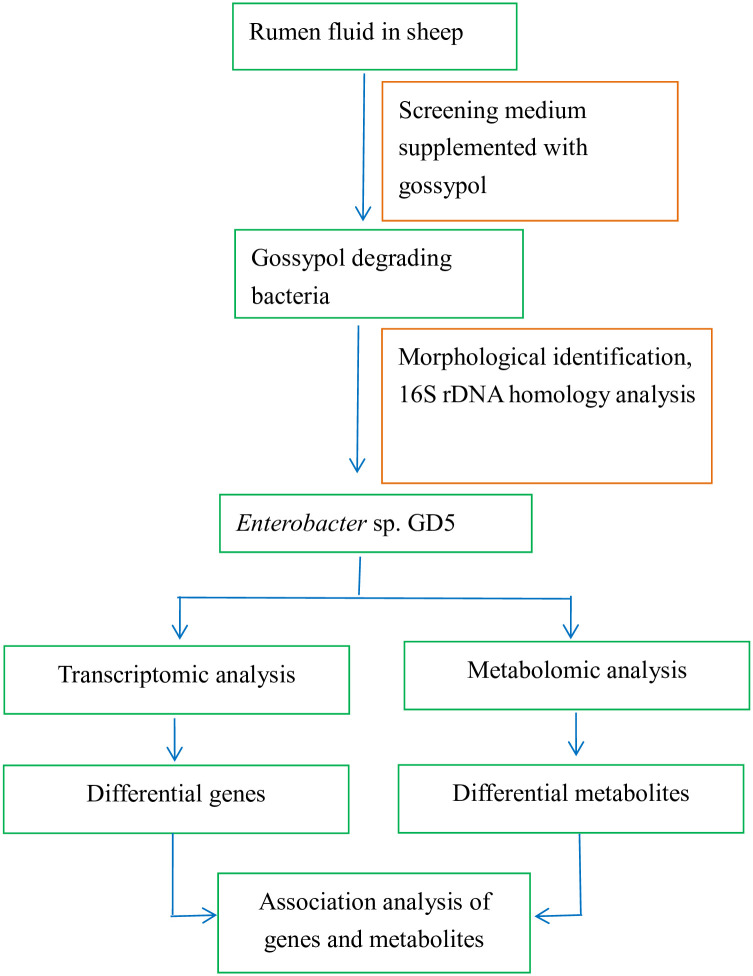 Fig 1
Fig 1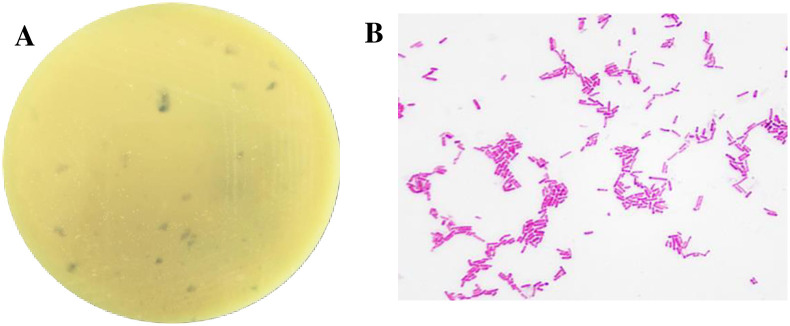 Fig 2
Fig 2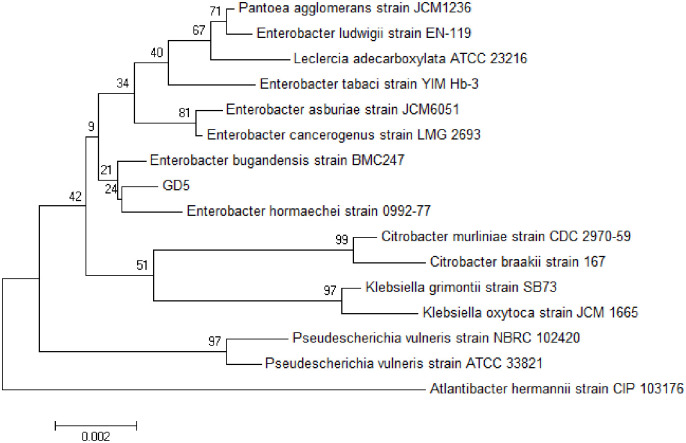 Fig 3
Fig 3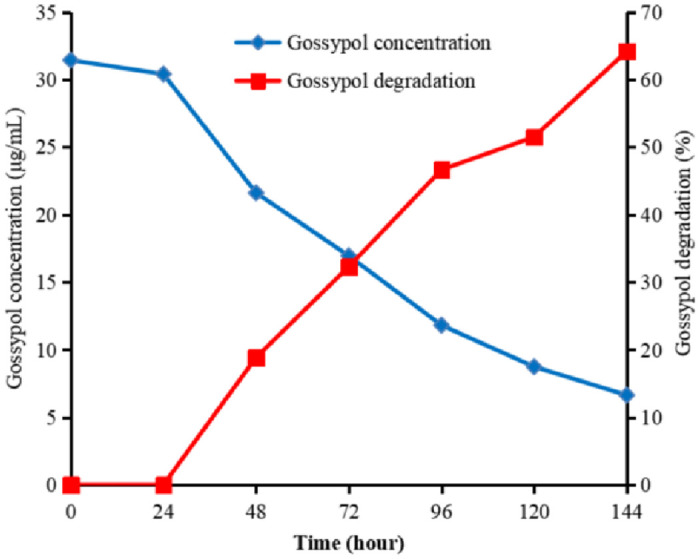 Fig 4
Fig 4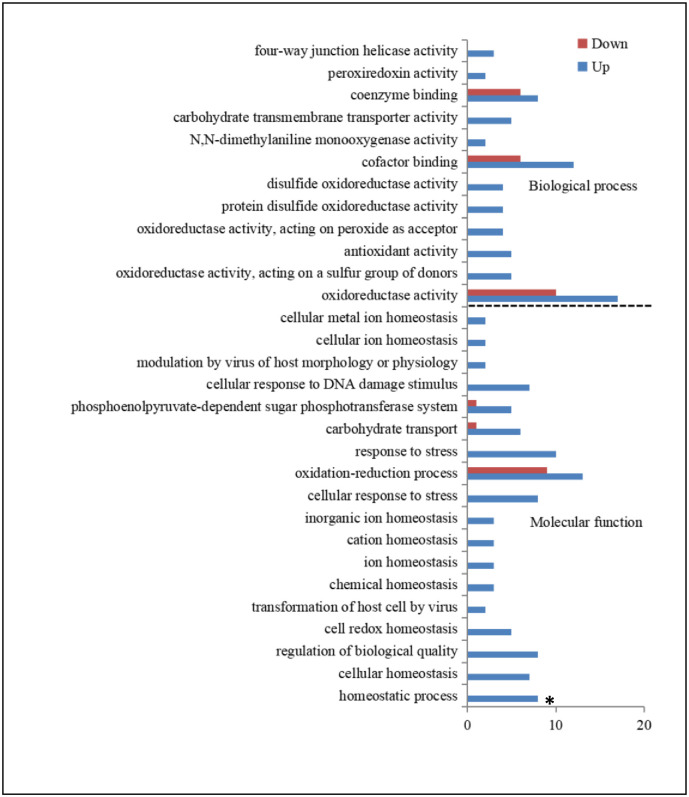 Fig 5
Fig 5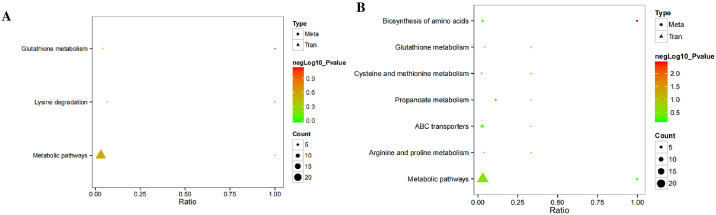 Fig 6
Fig 6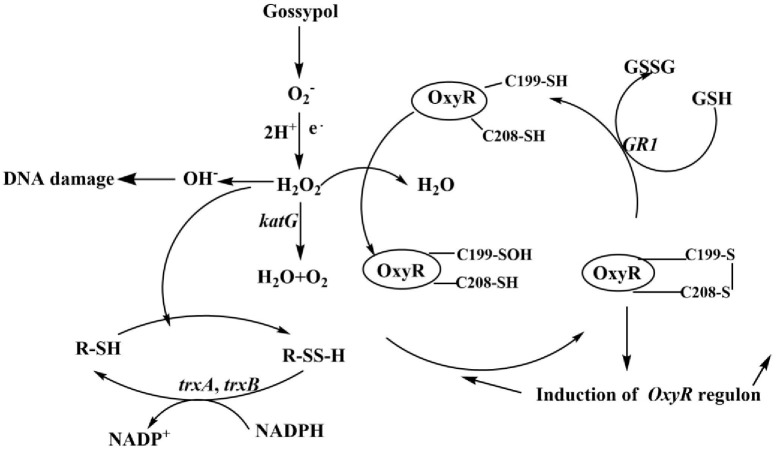 Fig 7
Fig 7- —Joint Fund of China Agricultural University and Xinjiang Agricultural University
- —http://dx.doi.org/10.13039/501100001809National Natural Science Foundation of China
- —The Key Research and Development Program of Xinjiang Uygur Autonomous Region
- —Postdoctoral fellowship program
Peer Reviews
No public reviews on file for this paper yet. If you reviewed it on a platform where reviews are public (OpenReview, ICLR, NeurIPS, ICML), you can paste yours below so the community can read it here.
Videos
No videos yet. Explain this paper in a talk, walkthrough, or lecture? Add one.
Taxonomy
TopicsResearch in Cotton Cultivation · Insect Resistance and Genetics · CRISPR and Genetic Engineering
Introduction
Cottonseed is recognized for its high energy [1], protein [2], and fiber [3], making it an advantageous feed component for ruminants [4] and a promising ingredient for fish diets [5]. However, cottonseed, cottonseed hull, and other cotton byproducts contain large amounts of the secondary metabolite gossypol, which hinders their direct application as feed materials. Numerous studies have reported that ruminants show no adverse symptoms after ingesting gossypol-containing cotton byproducts [6, 7]; however, gossypol can lead to liver injury and growth inhibition in ducks [8]. Suggesting that the different responses between ruminants and monogastric animals may be attributed to rumen-specific microorganisms. The rumen microbiome plays an important role in gossypol degradation, which occurs within 6 h of ingestion [9]. After anaerobic fermentation of cotton meal by Bacillus spp. isolated from rumen, the degradation rate of free gossypol was found to reach 93.46%, with an acid-soluble protein content of 13.26% [10]. The rumen-derived Lact. mucosae LLK-XR1 strain showed 40.65% gossypol degradation and good survivability at pH 3.0 and 0.3% bile [11]. Therefore, studying gossypol tolerance and degradation by rumen microorganisms may enable the future use of cotton byproducts for ruminants.
In a previous study, [14C] gossypol was orally administered to pigs, and metabolites isolated from their livers were characterized as gossypol, gossypolone, gossypolonic acid, demethylated gossic acid, and apogossypol [12]. The ruminal degradation mechanism of gossypol involves its binding to soluble proteins [13]. However, mechanisms underlying the selectivity of the rumen Enterobacter sp. GD5 strain for gossypol biodegradation and tolerance remains unclear. Therefore, in this study, we aimed to identify gossypol-degrading bacteria using gossypol as the sole carbon source and to elucidate the effects of gossypol on the metabolic and transcriptional activities of rumen Enterobacter sp. GD5. This study provides a preliminary exploration of the mechanisms underlying the tolerance of rumen microbiota to gossypol in ruminants.
Materials and methods
Strains
The gossypol-degrading Enterobacter sp. GD5 strain was isolated from rumen fluid in sheep and screened through a medium supplemented with gossypol (Shanghai Kewei Chemical Technology Co., Ltd., Shanghai, China) as the sole carbon source (0.95 g/L (NH_4_)2_SO_4, 0.15 g/L gossypol, 1.36 g/L Na_2_HPO_4_, 1.48 g/L KHPO_4_, and 0.143 g/L MgSO_4_.7H_2_O). Thalli of the isolated strain were inoculated into liquid Luria-Bertani (LB) broth and cultured for 24 h at 39°C, and then harvested from the liquid medium via centrifugation. DNA was extracted using the sodium dodecyl sulfate-proteinase K method. The genomic DNA was amplified by PCR using the universal primers, 27F: 5′-AGAGTTTGATCCTGGCTCAG-3′ and 1492R: 5′-GGTTACCTTGTTACGACTT-3′. The 16S rRNA genes of the isolated strain were sequenced by Shanghai Shenggong (Shanghai, China). The sequences were compared with reported sequences in the National Center for Biotechnology Information (NCBI) database using the Basic Local Alignment Search Tool hosted on the NCBI website. A phylogenetic tree was constructed using the neighbor joining method. Phylogenetic and molecular evolutionary analyses were conducted with 1000 bootstrap values using MEGA software (version 5.0; Biodesign Institute, Arizona State University, Tempe, AZ, USA). The strain was stored at −80°C in LB medium with 25% glycerol (v/v) at the Xinjiang Key Laboratory of Herbivore Nutrition for Meat & Milk (College of Animal Science, Xinjiang Agricultural University, Urumqi, China) (Fig 1).
Flowchart of experimental.
Media preparation and growth conditions
LB medium was used to culture Enterobacter sp. GD5. The medium was heated to 39°C and passed through CO_2_ until it became colorless (1 mL 0.1% resazurin was added), after which 78 mL LB medium was added into 100 mL anaerobic bottles. The LB medium was sterilized at 121°C for 20 min, then 0.298 g/L NaS (reducer) was added before use to maintain anaerobic conditions. Cultivations were performed at 39°C in a constant temperature incubator (Spring Instrument. Co. Ltd., Jiangsu, China).
Preparation of metabolome and transcriptome samples
Three groups were created for metabolome and transcriptome analyses. In the gossypol group (Gossypol), 1 mL Enterobacter sp. GD5 (1 × 10^7^ CFU/mL; cultured overnight) and 1 mL gossypol (dissolved in acetone to a final concentration of 150 μg/mL) were transferred to 78 mL LB medium and cultured. In the CK group, 1 mL LB medium (without Enterobacter sp. GD5) and 1 mL gossypol (dissolved in acetone to a final concentration of 150 g/mL) were transferred to 78 mL LB and cultured. In the control group (Control), 1 mL Enterobacter sp. GD5 (1 × 10^7^ CFU/mL; cultured overnight) and 1 mL acetone were transferred to 78 mL LB medium and cultured. Samples for the Gossypol and CK groups were collected at 0, 24, 48, 72, 96, 120, and 144 h, and the gossypol concentration in the medium was determined using high-performance liquid chromatography (HPLC; Shimadzu, Kyoto, Japan) [14]. Bacteria in the Gossypol and Control groups were incubated at 37°C for 72 h under anaerobic conditions and then centrifuged at 12,000 × g for 10 min at 4°C. The supernatant was collected and the sediments of Enterobacter sp. GD5 were analyzed using LC-MS. The experiments were repeated three times, with six and seven biological samples used for transcriptomic and metabolomic analyses, respectively.
Metabolomics analysis
A 100 μL sample of each supernatant was extracted with 500 μL of 80% methanol aqueous solution containing 0.1% formic acid in a centrifuge tube and then vortexed for 30 s, followed by a 5 min ice bath. The samples underwent centrifugation at 15,000 × g for 10 min at 4 °C. The methanol content of the samples was diluted to 60% with MS-grade water. The filtrate was centrifuged in a centrifuge tube with a 0.22-μm filter at 15,000 × g and for 10 min at 4°C, followed by LC-MS analysis.
LC-MS analysis was performed using an ultra-HPLC system (Thermo Fisher Scientific, Waltham, MA, USA) with a Hypersil GOLD column (C18; 250 × 4.6 mm, 5 mm particle size) at 40°C coupled with a QE-HF-X system (Thermo Fisher Scientific, Waltham, MA, USA). The mobile phase (flow rate: 1 mL/min) comprised 0.1% formic acid and methanol in the positive mode and 5 mM ammonium acetate (pH 9.0) and methanol in the negative mode. The gradient elution procedure was as follows: 0 min, 98% A; 1.5 min, 98% A; 12 min, 0% A; 14 min, 0% A; 14.1 min, 98% A; and 16 min, 98% A. The MS scanning range was 100–1500 m/z, with the following electron spray ionization settings: spray voltage, 3.2 kV; sheath gas flow rate, 35 arb; auxiliary gas flow rate, 10 arb; capillary temperature, 320 °C; and polarity, positive and negative ion modes. The MS/MS secondary scans were data-dependent.
Principal component analysis (PCA) and partial least squares discriminant analysis (PLS-DA) were used to analyze the effects of gossypol on rumen metabolites (Gossypol vs. Control groups). The Variable Importance in the Projection (VIP) value of the first principal component (PC1) of the PLS-DA model was used to identify differential metabolites by combining the P-values of the t test. The threshold was set to VIP > 1.0, a fold change (FC) >1.2 or FC < 0.833, and P < 0.05.
RNA isolation, quality control, and library construction
Total RNA from Enterobacter sp. GD5 was extracted with liquid nitrogen and added to TRIzol solution. An Agilent 2100 biological analyzer (Agilent Technologies, Santa Clara, CA, USA) was used to detect RNA quality and concentration. The NovaSeq 6000 platform (Illumina, San Diego, CA, USA) was used for sequencing obtained raw data. Raw transcriptomic data were deposited in the NCBI Sequence Read Archive (BioProject accession number: PRJNA616020).
Clean reads were obtained by removing those containing adapter or ploy-N sequences, and low-quality reads to ensure the downstream analysis of high-quality data. The reference genome of the Enterobacter hormaechei WCHEH020038 (CP031726.1) was downloaded from the genome website. Clean reads were aligned to the reference genome using Bowtie software (version 2–2.2.3; http://bowtie-bio.sourceforge.net/index.shtml).
Differential expression analysis between the two groups was performed using the DESeq R package (version 1.18.0; https://bioconductor.org/packages/release/bioc/html/DESeq.html). P-values were adjusted using the Benjamini—Hochberg approach to control the false discovery rate. Gene Ontology (GO0 and Kyoto Encyclopedia of Genes and Genomes (KEGG) analyses of differentially expressed genes (DEGs) were performed using the “GOseq” package in R (https://bioconductor.org/packages/release/bioc/html/goseq.html), correcting for gene-length bias. GO terms with a corrected P-value < 0.05 were considered significantly enriched. KOBAS software (http://kobas.cbi.pku.edu.cn/kobas3/) was used to test the statistical enrichment of DEGs in the KEGG pathways.
Reverse transcription-PCR analysis
The expression levels of six genes (katG, dps, poxB, lsrA, UfaA1, and hemH) were detected via reverse transcription PCR using an iQ5 system (Bio-Rad, Hercules, CA, USA). The primers used are listed in S1 Table. The PCR program was conducted as follows: 95°C for 1 min, followed by 30 cycles at 95°C for 10 s, 65°C for 20 s, and 72°C for 20 s. Expression levels were normalized against the 16S rRNA gene using the 2^−ΔΔCt^ method [15, 16].
Results
Isolation and identification of gossypol degrading bacteria
A single strain was isolated from the rumen fluid of sheep using basal medium plates containing gossypol as the sole carbon source after 3 d of anaerobic fermentation (Fig 2A). The emergent colonies exhibited a round morphology and a white coloration. Gram staining procedures subsequently verified these bacteria as gram-negative (Fig 2B).
Morphological identification of the gossypol-degrading strain.(A) Colony and (B) microstructure characteristics of the strain (1000× magnification).
16S rDNA homology analysis
The genomic DNA of the isolated strain was successfully extracted and amplified using a bacteria-specific primer pair, yielding an amplicon of approximately 1.5 kb, a method previously applied for various bacterial strains. Sequence analysis determined the amplicon size to be 1356 bp. Alignment of the 16S rRNA gene sequences of the isolated strain against the NCBI BLAST database demonstrated a 99% homology with the Enterobacter hormaechei 0992–77 strain (Fig 3).
Phylogenetic tree of the 16S rDNA of the gossypol-degrading bacterium, GD5.Changes in gossypol concentration after fermentation.
The concentration of gossypol in the culture medium was measured using HPLC. Results indicated the presence of 31.44 μg/mL gossypol before fermentation and 16.95 μg/mL after a 72-h culture, translating to a gossypol degradation rate of 32.31% (Fig 4). After 120 h, the degradation rate decreased.
Concentration of gossypol in culture medium and its degradation by Enterobacter sp. GD5 at different times.
Metabolomic analysis of Enterobacter sp. GD5
PCA results of the positive and negative ion modes showed a distinct separation between the Gossypol and Control groups (S1A and S1D Fig). The PLS-DA results revealed a clear separation between the Gossypol and Control groups (S1B and S1E Fig), with R^2^ and Q^2^ values of 0.99 and 0.89, and 0.96 and 0.59, respectively. The permutation test R^2^ and Q^2^ values were 0.76 and −0.83 in the positive ion mode and 0.75 and −0.80 in the negative ion mode (S1C and S1F Fig), respectively.
The VIP of the PC1 of the PLS-DA model was used to identify differentially expressed metabolites according to a VIP threshold > 1.0, FC >1.2 or < 0.833, and P < 0.05. In the positive ion mode, 129 metabolites were detected (S2 Table), nine of which were significantly different (four metabolites were upregulated and five were downregulated). In the negative ion mode, 117 metabolites were detected (S3 Table), six of which were significantly different (four upregulated and two downregulated). Differential metabolites identified in the positive and negative ion modes are listed in Table 1.
Table 1: Differential metabolites identified in the culture medium of Enterobacter sp. GD5.
KEGG enrichment analysis identified significantly different metabolites in the positive ion mode that participated in glutathione metabolism, lysine degradation, and protein digestion (Table 2). Metabolites identified in negative ion mode were enriched in 10 KEGG pathways.
Table 2: Kyoto Encyclopedia of Genes and Genomes (KEGG) enrichment of differential metabolites identified in Enterobacter sp. GD5.
Analysis of the Enterobacter sp. GD5 transcriptome
Total RNA isolated from Enterobacter sp. GD5 resulted in 23.98 million clean reads from 12 samples. The results revealed that 82.19–96.23% of the clean reads matched the reference genome (S2 Fig), suggesting that the transcriptome data are useful for further analysis. There were 132 DEGs identified between the Gossypol and Control groups, of which 104 were upregulated (S4 Table) and 28 downregulated (S5 Table). Swiss-Prot annotation identified genes related to homeostatic processes, antioxidative stress, and dehydrogenase activity (Table 3). Seven DEGs were involved in homeostatic processes, most of which were associated with antioxidative stress, and all DEGs were significantly upregulated.
Table 3: Differential gene expression in Enterobacter sp. GD5 (Gossypol vs. Control groups).
The GO enrichment analysis is results are shown in Fig 5. The 30 GO terms with the most significant enrichment were selected. DEGs were mainly enriched in biological processes and molecular functions, with the most highly enriched genes involved in oxidoreductase and oxidation-reduction activities. Genes involved in homeostatic processes differed significantly between the Gossypol and Control groups.
*Gene Ontology (GO) enrichment of DEGs following gossypol treatment.The top 30 GO terms are shown. P <0.05.
KEGG enrichment analysis showed that the DEGs were associated with various cellular processes (Table 4). The RT-qPCR was used to validate the gene expression profiles. Results showed that the expression trends of the selected genes were the same as those detected via RNA-seq (S3 Fig).
Table 4: KEGG pathway enrichment of DEGs.
Association analysis between the metabolome and transcriptome
Analysis of the association between the metabolome and transcriptome sequences showed that significantly different metabolites and genes participated in glutathione metabolism, lysine degradation, and other metabolic pathways in the positive ion mode (Fig 6A). However, in the negative ion mode, pathways were enriched in the biosynthesis of amino acids, glutathione metabolism, cysteine and methionine metabolism, propanoate metabolism, ABC transporters, arginine and proline metabolism, and other metabolic pathways (Fig 6B).
Integrative metabolomic and transcriptomic association analysis in Enterobacter sp. GD5.(A) Positive ion mode; (B) negative ion mode. "Meta" denotes metabolism, with circles illustrating metabolic data; "Tran" refers to transcription, with triangles indicating gene data. "P-value" indicates the statistical significance within transcriptional or metabolic pathways, while "Count" indicates the quantity of metabolites or genes involved.
Discussion
Previous studies have reported the important role of the rumen microbiome in gossypol degradation, which occurs within 6 h of ingestion [9]. Zhang et al. isolated a strain of B. subtilis from bovine rumen fluid and found that it degraded free and total gossypol by 78.86% and 49.00%, respectively [17]. In previous studies, a Lactobacillus agilis WWK129 strain was anaerobically isolated from dairy cows and exhibited gossypol degradability as high as 83% [18]. Enterobacter hormaechei ASU-01 strain degraded most of the naphthalene in culture medium within 15 days [19]. In the present study, the gossypol degrading bacterium Enterobacter sp. GD5 was isolated using a culture medium containing gossypol as the sole carbon source. The gossypol-degradation rate of Enterobacter sp. GD5 was measured as 32.31% after 72 h, which is much lower than that reported previously. This may be due to the different strains and culture conditions used in this study. Additionally, rumen microorganisms comprise a complex biological system and gossypol degradation may be caused by the synergistic activity of multiple microorganisms.
Numerous studies employed metabolomics to detect microbial metabolic changes [20, 21]. Gossypol exhibits reducing activity on lysine and other amino acids at rates of 0.003–1.03% [22]. The mechanism of gossypol degradation in the rumen involves the binding of each mole of gossypol to two moles of lysine ε-amino groups [13]. In the present study, amino acid biosynthesis was identified as a significantly differentially expressed metabolic pathway in gossypol-exposed Enterobacter sp. GD5. Additionally, KEGG analysis indicated that the glutathione pathway was enriched, according to results obtained in both the positive and negative ion modes. In prokaryotic cells, glutathione is a low-molecular-weight peptide (l-γ-glutamyl-l-cysteinylglycine) that protects cells as an antioxidant [23] and plays a crucial role in cellular defense against xenobiotics and naturally occurring deleterious compounds [24]. This suggests that glutathione may be involved in gossypol resistance and degradation in Enterobacter sp. GD5. A previous study identified various gossypol metabolites in the pig liver [25]; however, we did not identify any of those reported metabolites in the current study. This difference may be explained by the fact that the degradation of gossypol by Enterobacter sp. GD5 is different from that in the liver, and it is possible that the LC-MS analysis could not detect all metabolites.
Transcriptome analysis was performed to determine the influence of gossypol on gene expression in Enterobacter sp. GD5. Previous studies have used transcriptomic analysis to study changes in gene expression in B. pumilus during various growth phases [26]. Genomic, transcriptomic, and proteomic analyses have been used to reveal the possible mechanisms of environmental adaptation in E. coli [27]. Therefore, transcriptomics plays an important role in understanding microbial tolerance (or biodegradation). Gossypol as a promising antimicrobial compound that inhibits cell division by affecting the GTPase activity of filamenting temperature sensitive mutant Z (FtsZ) [28]. Anthraquinone-2,6-disulfonate promotes the expression of genes related to glutathione metabolism, reduces oxidative stress, and enhances Enterobacter sp. DNB-S2-mediated biodegradation of dibutyl phthalate [29]. In the present study, we found that gossypol influenced the homeostatic processes in Enterobacter sp. GD5. Most of the genes involved were related to antioxidative stress. Genes responding to oxidative stress included katG, ahpCF, goxA, grxA (GR1), and dps [30]. The katG gene KatG catalyzes the conversion of H_2_O_2_ to H_2_O and O_2_ and acts as a vanguard during the anti-peroxide process in E. coli [31]. Catalase HPI encoded by KatG protects the strain from high H_2_O_2_ concentrations. The ahpCF gene encodes a reductase that acts as an effective scavenger of low concentrations of H_2_O_2_ in E. coli [32]. GR1 catalyzes the reduction of intramolecular disulfide bonds (Fig 7). The two thioredoxins, thioredoxin 1 (Trx 1) and thioredoxin 2 (Trx 2), are typically present in E. coli and are encoded by trxA and trxC, respectively [33]. Trx 1 and Trx 2 are involved in reducing disulfide bonds [34] and can degrade 2,4-dichlorophenoxyacetic acid, a toxic herbicide [35]. Microbial antioxidant systems have been extensively studied, and major regulons, such as oxyR, soxR, rpoS, perR, ohrR, and σв, significantly contribute to enhancing the oxidative tolerance of microorganisms. A series of antioxidant genes, including dps, katE, xthA, sodC, ahpC*/F*, mrgA, and fur, are under the control of these regulators [36]. Overall, these results revealed that gossypol likely induces oxidative stress in Enterobacter sp. GD5, where the expression of genes related to antioxidative stress was significantly increased.
Mechanisms of gossypol-induced antioxidative stress in Enterobacter sp. GD5.Gossypol treatment differentially upregulated the expression of katG, ahpCF, goxA, grxA (GR1), trxA, and trxB.
Gossypol affects enzymatic activity by forming Schiff bases. A previous study reported that gossypol inhibits pepsinogen at a concentration of 4.7 × 10^−5^ mol/L [37]. Gossypol also attenuates the growth of Trypanosoma cruzi by inhibiting α-hydroxy-acid dehydrogenase and malate dehydrogenase activities [38]. Catalase and glutathione reductase activities increased 1.5–2.0 fold in fungal mycelia grown in the presence of gossypol as a carbon source [39]. Santana et al. reported an increase in glutathione reductase activity in the testicular homogenate of rats that were fed gossypol [40]. Catalase and glutathione reductase levels are upregulated in Aspergillus in response to oxidative stress caused by toxicants, such as arsenic and lead, respectively [41]. Formate dehydrogenase, processes associated with iron ions, repair programs, multidrug resistance, antioxidant defense, and energy generation (mqo and sdhC) may have contributed to stress tolerance in the Enterobacter NRS-1 strain [42]. These findings are consistent with our results, which revealed the gossypol-mediated the downregulation of genes encoding formate dehydrogenase (fdhF). KEGG analysis identified pyruvate metabolism as the primary highly enriched pathway. The pyruvate metabolism-associated genes are mostly involved in the tricarboxylic acid cycle, cell growth rate, and substrate-to-biomass conversion efficiency [43]. Overall, these results suggest that gossypol alters nutrient metabolism and inhibits bacterial growth.
Conclusions
Our metabolic results revealed that gossypol impacts glutathione metabolism in Enterobacter sp. GD5. The RNA-seq results revealed significant modifications to homeostatic processes within Enterobacter sp. GD5, with a considerable differential expression of genes associated with the antioxidative stress response. These findings contribute to our understanding of the mechanisms underlying the observed gossypol tolerance and degradation capabilities of Enterobacter sp. GD5. Future research should aim to identify additional gossypol-degrading microorganisms from the rumen, encompassing both bacterial and fungal species. Comparative studies on gossypol degradation or tolerance mechanisms across different microorganisms will enhance our knowledge of rumen microbial interactions with gossypol.
Supporting information
S1 TableThe primers of reverse transcription PCR.(DOCX)
S2 Tablemetabolites were detected in the positive ion mode.(XLS)
S3 Tablemetabolites were detected in the negative ion mode.(XLS)
S4 TableDifferentially expressed genes (upregulated).(XLS)
S5 TableDifferentially expressed genes (downregulated).(XLS)
S1 FigPCA scatter plots, PLS-DA, and permutation tests between gossypol-treated and control groups.(DOCX)
S2 FigTest results of total RNA.(DOCX)
S3 FigDetection of relative gene expression by qRT-PCR.(DOC)
The reference list from the paper itself. Each links out to its DOI / PubMed record.
- 1Chetima A, Wahabou A, Zomegni G, Ntieche Rahman A, Bup Nde D. Bleaching of neutral cotton seed oil using organic activated carbon in a batch system: Kinetics and adsorption isotherms. Processes (Basel). 2018;6:22. doi: 10.3390/pr 6030022 · doi ↗
- 2Ma M, Ren Y, Xie W, Zhou D, Tang S, Kuang M, et al. Physicochemical and functional properties of protein isolate obtained from cottonseed meal. Food Chem. 2018;240:856–862. doi: 10.1016/j.foodchem.2017.08.030 28946352 · doi ↗ · pubmed ↗
- 3Palmquist DL. Digestibility of cotton lint fiber and whole oilseeds by ruminal microorganisms. Anim Feed Sci Technol. 1995;56:231–242. doi: 10.1016/0377-8401(95)00830-6 · doi ↗
- 4Underwood AG, Martin S, Greene W, Smith WB. Case study: Passage dynamics of whole cottonseed in beef cattle. J Anim Sci. 2023;101(Suppl 1):87. doi: 10.1093/jas/skad 068.103 · doi ↗
- 5Huang Y-J, Zhang N-N, Fan W-J, Cui Y-Y, Limbu SM, Qiao F, et al. Soybean and cottonseed meals are good candidates for fishmeal replacement in the diet of juvenile Macrobrachium nipponense. Aquac Int. 2018;26:309–324. doi: 10.1007/s 10499-017-0215-1 · doi ↗
- 6Câmara ACL, do Vale AM, Mattoso CRS, Melo MM, Soto-Blanco B. Effects of gossypol from cottonseed cake on the blood profile in sheep. Trop Anim Health Prod. 2016;48:1037–1042. doi: 10.1007/s 11250-016-1039-0 27098313 · doi ↗ · pubmed ↗
- 7Leite RG, Hoffmann A, Romanzini EP, Delevatti LM, Ferrari AC, Fonseca NVB, et al. Zebu cattle fed dry distiller’s grain or cottonseed meal had greater nitrogen utilization efficiency than non-supplemented animals. Trop Anim Health Prod. 2022;54(2):119. doi: 10.1007/s 11250-022-03126-6 35226193 · doi ↗ · pubmed ↗
- 8Yildirim M, Lim C, Wan PJ, Klesius PH. Growth performance and immune response of channel catfish (Ictalurus puctatus) fed diets containing graded levels of gossypol—acetic acid. Aquaculture. 2003;219:751–768. doi: 10.1016/s 0044-8486(03)00062-0 · doi ↗