Physical cell-cell contact elicits specific transcriptomic responses in wine yeast species
Natasha A. Luyt, Riaan N. de Witt, Benoit Divol, Hugh G. Patterton, Mathabatha E. Setati, Patricia Taillandier, Florian F. Bauer

TL;DR
This study shows how physical contact between two wine yeast species triggers specific genetic responses, offering new insights into their interactions during fermentation.
Contribution
The study reveals novel transcriptomic responses to physical cell-cell contact in wine yeasts, not previously characterized.
Findings
Physical contact upregulates cell wall and H2S-related genes in S. cerevisiae.
L. thermotolerans shows significant upregulation of HSP stress response genes.
FLO family genes are downregulated in both species, suggesting reduced adhesion.
Abstract
Fermenting grape juice provides a habitat for a well-mapped and evolutionarily relevant microbial ecosystem consisting of many natural or inoculated strains of yeasts and bacteria. The molecular nature of many of the ecological interactions within this ecosystem remains poorly understood, with the partial exception of interactions of a metabolic nature such as competition for nutrients and production of toxic metabolites/peptides. Data suggest that physical contact between species plays a significant role in the phenotypic outcome of interspecies interactions. However, the molecular nature of the mechanisms regulating these phenotypes remains unknown. Here, we present a transcriptomic analysis of physical versus metabolic contact between two wine relevant yeast species, Saccharomyces cerevisiae and Lachancea thermotolerans. The data show that these species respond to the physical…
Genes, proteins, chemicals, diseases, species, mutations and cell lines named across the full text — each resolved to its canonical identifier and authoritative record.
Click any figure to enlarge with its caption.
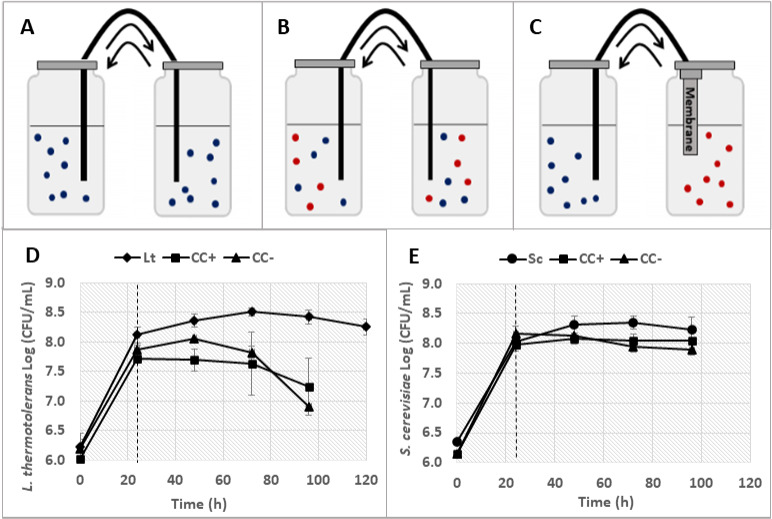 Fig 1
Fig 1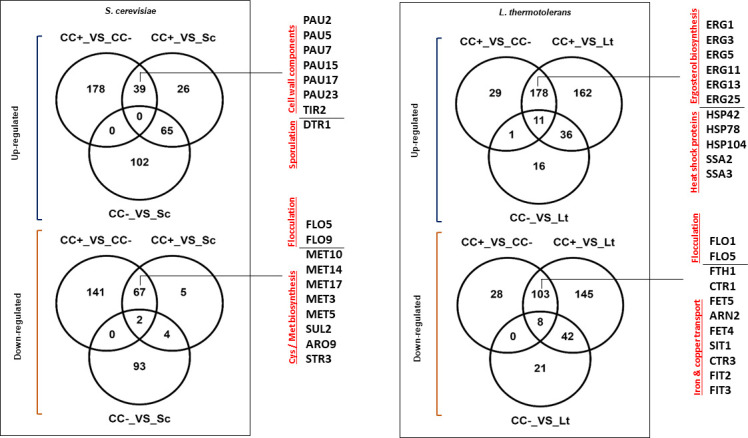 Fig 2
Fig 2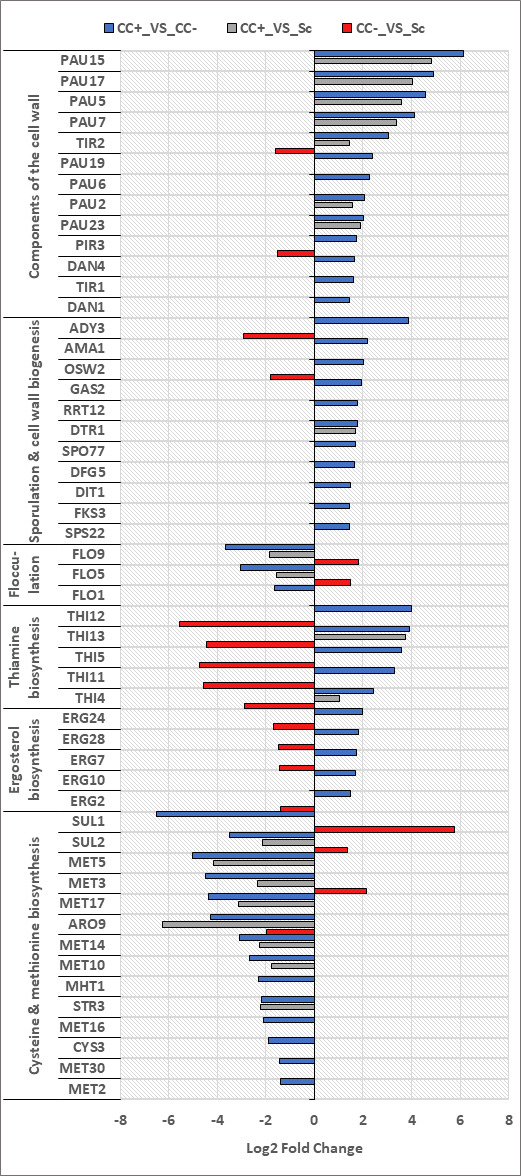 Fig 3
Fig 3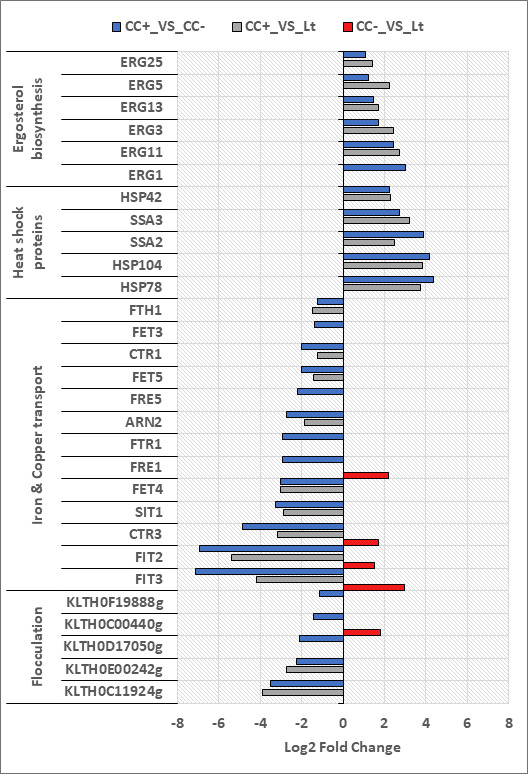 Fig 4
Fig 4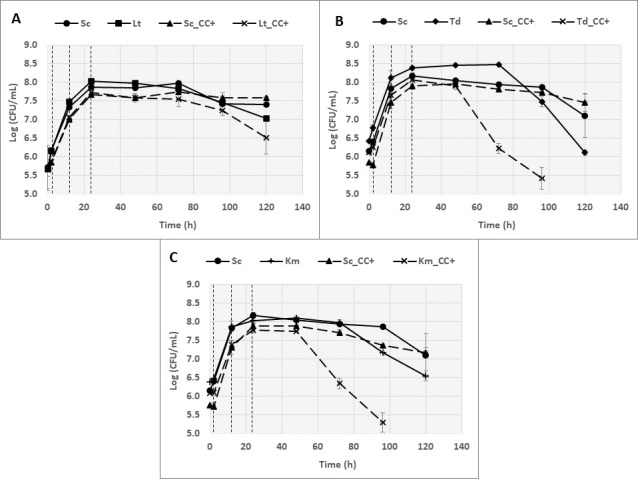 Fig 5
Fig 5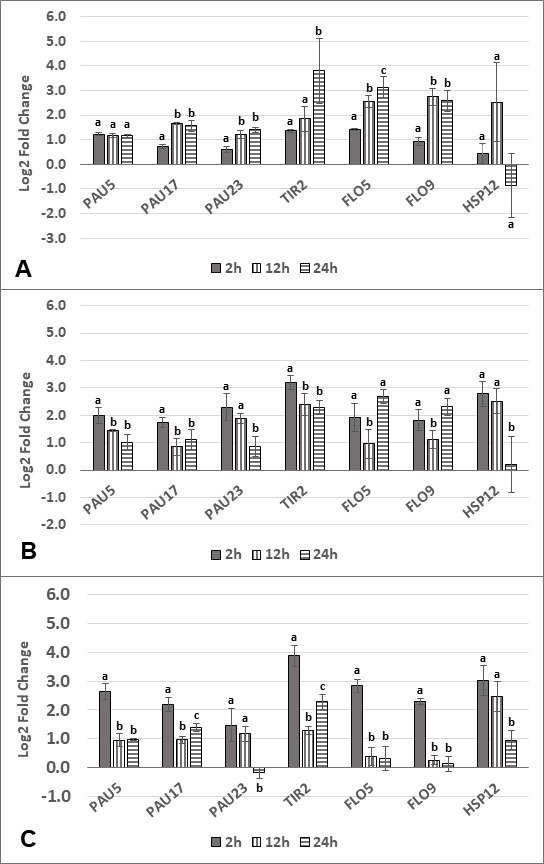 Fig 6
Fig 6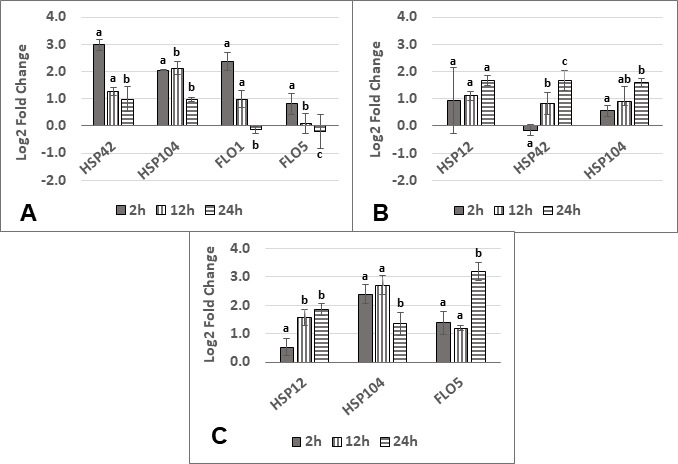 Fig 7
Fig 7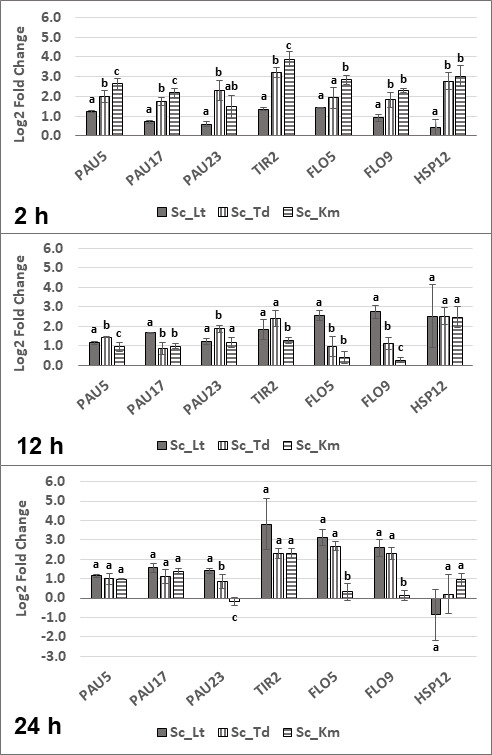 Fig 8
Fig 8| Factors influencing interaction in comparison | ||
|---|---|---|
| Comparison | Cell-cell contact | Metabolic contact |
| CC+_VS_CC− | ✓ | X |
| CC+_VS_Sc/Lt | ✓ | ✓ |
| CC−_VS_Sc/Lt | X | ✓ |
|
|
| |||
|---|---|---|---|---|
| Upregulated | Downregulated | Upregulated | Downregulated | |
| CC+_VS_CC− | 217 | 210 | 219 | 139 |
| CC+_VS_Sc/Lt | 130 | 78 | 387 | 298 |
| CC−_VS_Sc/Lt | 167 | 99 | 65 | 71 |
| GO term | Log10 ( | GO term description | |
|---|---|---|---|
| Upregulated | |||
|
| GO:0031505 | −8.39 | Fungal-type cell wall organization |
| GO:0045229 | −8.01 | External encapsulating structure organization | |
| GO:0071554 | −7.12 | Cell wall organization or biogenesis | |
| GO:1901615 | −4.03 | Organic hydroxy compound metabolic process | |
| GO:1901617 | −3.66 | Organic hydroxy compound biosynthetic process | |
| GO:0042724 | −2.76 | Thiamine-containing compound biosynthetic process | |
| GO:0009228 | −2.76 | Thiamine biosynthetic process | |
| GO:0006081 | −2.64 | Cellular aldehyde metabolic process | |
| GO:0000256 | −2.59 | Allantoin catabolic process | |
| Downregulated | |||
|
| GO:0006811 | −11.32 | Ion transport |
| GO:0034220 | −8.82 | Ion transmembrane transport | |
| GO:0010467 | −5.76 | Gene expression | |
| GO:0055085 | −5.44 | Transmembrane transport | |
| GO:1901678 | −4.68 | Iron coordination entity transport | |
| GO:0000097 | −4.59 | Sulfur amino acid biosynthetic process | |
| GO:0015891 | −4.48 | Siderophore transport | |
| GO:0046916 | −4.17 | Cellular transition metal ion homeostasis | |
| GO term no | Log10 ( | GO term description | |
|---|---|---|---|
| Upregulated | |||
| BP | GO:0055114 | −9.12 | Oxidation-reduction process |
| GO:0022900 | −6.23 | Electron transport chain | |
| GO:0008202 | −2.89 | Steroid metabolic process | |
| GO:1902652 | −2.31 | Secondary alcohol metabolic process | |
| GO:0055085 | −2.27 | Transmembrane transport | |
| GO:0006091 | −2.14 | Generation of precursor metabolites and energy | |
| GO:0034220 | −1.76 | Ion transmembrane transport | |
| GO:0006811 | −1.58 | Ion transport | |
| Downregulated | |||
| BP | GO:0000041 | −7.45 | Transition metal ion transport |
| GO:0055076 | −4.45 | Transition metal ion homeostasis | |
| GO:0010467 | −4.05 | Gene expression | |
| GO:1903047 | −3.19 | Mitotic cell cycle process | |
| GO:0006811 | −3.12 | Ion transport | |
| GO:0051301 | −2.90 | Cell division | |
| GO:0015891 | −2.88 | Siderophore transport | |
| GO:0007049 | −2.63 | Cell cycle | |
| GO:1901678 | −2.41 | Iron coordination entity transport | |
| Fermentation descriptions | Abbreviations |
|---|---|
| Lt | |
| Sc | |
| Co-culture with cell-cell contact in duplicate | CC+ |
| Co-culture without cell-cell contact in duplicate | CC− |
| Species being analyzed | Comparisons | Description of comparisons |
|---|---|---|
|
| 1. | |
| 2. | ||
| 3. | ||
|
| 4. | |
| 5. | ||
| 6. |
- —National Research Foundation (NRF)
- —National Research Foundation (NRF)
Peer Reviews
No public reviews on file for this paper yet. If you reviewed it on a platform where reviews are public (OpenReview, ICLR, NeurIPS, ICML), you can paste yours below so the community can read it here.
Videos
No videos yet. Explain this paper in a talk, walkthrough, or lecture? Add one.
Taxonomy
TopicsQuality and Supply Management · Organizational Strategy and Culture · Organizational Leadership and Management Strategies
INTRODUCTION
The grape must environment is a complex ecosystem, and the interactions between microorganisms have been shown to influence the organoleptic properties of a wine. Interactions between Saccharomyces cerevisiae and non-Saccharomyces yeasts during wine fermentation have also been widely studied (1–4). These interactions largely define the development of the wine fermentation ecosystem during spontaneous fermentation (5). Interaction studies have also received significant impetus from the more recent development of multispecies inoculations. In the pursuit of wines with more unique sensorial characteristics, non-Saccharomyces yeasts indigenous to the grape must and vineyard environments have indeed emerged as a useful biotechnological resource (6–9). These include many yeasts belonging to genera such as Pichia, Torulaspora, Lachancea, Hanseniaspora, Metschnikowia, Schizosaccharomyces, and Wickerhamomyces, which, depending on fermentation parameters, can produce specific metabolites that contribute positively to wines (8). For instance, Lachancea thermotolerans in mixed fermentations with S. cerevisiae can increase glycerol content, overall acidity of wines, and enhance the production of certain favorable aromatic compounds (10–12). Similarly, Torulaspora delbrueckii can contribute to lower production of ethanol, certain short- and medium-chain fatty acids, and acetic acid, as well as higher production of esters and higher alcohols in wines (13, 14).
Data have revealed that physical cell-cell contact plays a significant role in regulating the ecological dynamics within this ecosystem (15–24). Depending on fermentation parameters, S. cerevisiae can have an inhibitory effect on certain non-Saccharomyces species in a cell-cell contact-dependent manner (15–24). The aforementioned interaction has been linked to the production of antimicrobial compounds (18) (linked to the accumulation of GAPDH-derived peptides on the cell-surface of S. cerevisiae when in co-culture with L. thermotolerans) (19). In other cases, metabolites secreted by S. cerevisiae seem to be the primary causative agent in the observed earlier death of Hanseniaspora uvarum during mixed fermentations (20). In contrast to these results, other authors implicated cell-cell contact with S. cerevisiae as the cause for an observed drop in viability in H. uvarum (23). Similar cell-cell mediated deaths in mixed culture with S. cerevisiae have also been observed for T. delbrueckii (17) and Starmerella bacillaris (21). For the study of such interactions, several types of compartmentalized bioreactors, which allow for two microbial populations to be separated physically while sharing the same growth medium, have been developed (17–24). This specialized equipment has been used to describe interactions between S. cerevisiae and several non-Saccharomyces spp. (such as T. delbrueckii, L. thermotolerans, H. uvarum, and S. bacillaris) and elucidate the impact of these interactions on fermentation dynamics and metabolite production (17–24). While such data highlight the consequences of physical vs metabolic contact on yeast performance and fermentation outcomes, the molecular mechanisms behind these interactions remain unclear, and to date, very few studies have focused on this aspect (25–29). Within the anthropogenic grape must fermentation ecosystem, the same dominant yeast species are observed globally, and it can be assumed that the presence of these competing cohabiting yeast species has resulted in specific evolutionary adaptations. While S. cerevisiae has been studied extensively in terms of its evolutionary adaptations to abiotic stresses, evolutionarily relevant responses to cohabiting species within this specific ecosystem have not been well described (30). Furthermore, the specific nature of the impact of physical, as opposed to metabolic contact, remains unknown.
To gain insight on the molecular mechanisms that are responsible for the impact of physical contact, the current study employed a previously described compartmentalized membrane bioreactor system (24) to elucidate transcriptional regulation within S. cerevisiae and L. thermotolerans in response to cell-cell and metabolic interactions. This experimental approach also allowed for further characterization of evolutionary adaptations within the yeast ecosystem. Genes of interest identified in the transcriptomic data set were further characterized for their expression at different stages of co-culture fermentations with L. thermotolerans and two other fermenting yeast species, T. delbrueckii and Kluyveromyces marxianus. These data suggest that physical contact between different species triggers both generic and species-specific responses.
RESULTS
As described in the Materials and Methods section, the yeast were grown in a bioreactor system that kept two species physically separated while ensuring efficient exchange of the growth medium. The strains were grown in synthetic must under fermentative batch conditions in monoculture (Sc and Lt), co-culture with cell-cell contact (CC+), and in co-culture without cell-cell contact (CC−). Yeast growth was monitored throughout fermentation by sampling once a day and with the use of WL (Wallerstein) (Sigma-Aldrich, St. Louis, MO, USA) nutrient agar plates. Figure 1 illustrates each fermentation type and shows the growth of the two species in the three culture conditions expressed as colony forming units (CFU/mL). As previously described (24), physical contact had a significant impact on the growth rate of both species. L. thermotolerans reached a lower maximum viable cell count when it was in cell-cell contact with S. cerevisiae (CC+). When cell-cell contact was eliminated, the yeast was able to reach a higher cell density (CC−) (Fig. 1). The effect of the physical presence of a competitor was less pronounced in S. cerevisiae; however, a steady decline in cell counts can be observed for this yeast after 48 h until the end of fermentation in the absence of cell-cell contact (CC−).
Images (A – C) illustrate fermentations conducted in a compartmentalized bioreactor. Arrows indicate the movement and mixing of media throughout fermentation. Blue and red dots represent two different yeast species. Fermentations were performed as monocultures of L. thermotolerans and S. cerevisiae, respectively, and image A illustrates these fermentations as the presence of a single species represented by only blue dots. Co-culture fermentations with cell-cell contact (CC+) were performed, and image B illustrates these fermentations as the presence of two species represented by blue and red dots in both compartments. Finally, co-culture fermentations without cell-cell contact (CC−) were performed with the inclusion of a membrane, and image C illustrates these fermentations as the presence of two species represented by red dots in one compartment and blue dots in the second compartment. Yeast growth was measured and represented as the log of viable colony counts (CFU/mL) for L. thermotolerans (D) and S. cerevisiae (E) within monoculture (Lt ♦; Sc ●), CC+ (■), and CC- (▲). Dashed lines indicate the 24 h RNA sampling points. Data are represented by two biological repeats. Error bars indicate standard deviation. Lt: L. thermotolerans; Sc: S. cerevisiae.
Transcriptome analysis
Samples for transcriptomic analysis by RNAseq were taken at 2 h and 24 h, and sequencing was performed as described in a previous study (28). Sample data were processed, differential gene expression analysis was performed using edgeR (31), and the different fermentations were compared (Table 1). Data with a log_2_ fold change of >1 and adjusted P-value of <0.05 were considered significant. The complete set of results of this analysis can be found in File S1.
These data show that after 2 h, corresponding to early exponential phase of the cultures, few statistically significant differences in gene expression levels were observed between the cell-cell contact (CC+) and no-cell-cell contact co-cultures (CC−) (File S1). In contrast to the 2 h time point, many transcriptomic changes within the different comparisons were detected at the 24 h time point (Table 2). In S. cerevisiae, a similar amount of up- (217) and down-regulated (210) genes were detected when comparing the two co-culture fermentations (CC+_VS_CC−), whereas in L. thermotolerans, more genes were upregulated in this comparison (219 upregulated vs 139 downregulated genes). In the CC+_VS_Lt/Sc monoculture comparisons, the number of L. thermotolerans differentially expressed genes was more than double compared with S. cerevisiae. Overall, when comparing CC− with monocultures (CC−_VS_Lt/Sc), the least number of genes were differentially expressed, providing additional evidence that physical contact significantly impacts cellular responses in co-cultures (Table 2).
VENN diagrams (Fig. 2) were constructed to visually represent similarities in expression profiles of the respective yeasts in the different fermentation conditions/settings. When comparing the co-cultures (CC+_VS_CC−), it was observed that most of the 217 upregulated genes for S. cerevisiae were unique to this comparison. The small subset of upregulated genes, which were shared between the comparisons CC+_VS_CC− and CC+_VS_Sc (Fig. 2), is of particular interest regarding transcriptomic regulation as a result of cell-cell contact. The expectation would be that if a specific gene was highly regulated as a response to physical contact, it would be differentially expressed in both comparisons. Indeed, between these two comparisons, 39 upregulated genes were shared. More downregulated genes were shared (67 genes), with only a small number being unique to CC+_VS_Sc for S. cerevisiae.
VENN diagrams illustrating common and unique genes that were either up- or down-regulated in S. cerevisiae and L. thermotolerans when comparing the monocultures (Sc; Lt) with the respective co-cultures (CC+; CC−) and when comparing the respective co-cultures. Some genes of interest shared between the CC+_VS_CC− and CC +VS_Lt/Sc comparisons are listed.
Transcriptomic responses in L. thermotolerans were somewhat different to that of S. cerevisiae. Only 29 of the 219 upregulated genes in the CC+_VS_CC− comparison were unique, with 178 of these being shared with the CC+_VS_Lt comparison. Only 16 genes were unique to the CC−_VS_Lt comparison (which was substantially less than S. cerevisiae). A similar scenario unfolded for downregulated genes in this yeast.
Gene ontology (GO) enrichment
A GO term enrichment analysis was performed to gain insights regarding the biological meaning behind the observed differentially expressed genes for S. cerevisiae and L. thermotolerans. In response to physical contact in the CC+_VS_CC− comparison, S. cerevisiae upregulated genes involved in cell wall organization or biogenesis or those forming structural components of the cell wall (Table 3). A considerable number of the genes encoding the cell wall integrity protein family PAU were upregulated (PAU2, PAU5, PAU6, PAU7, PAU15, PAU17, PAU19, and PAU23) as were several structural cell wall genes including TIR1, TIR2, DAN1, DAN4, and PIR3. Other upregulated genes in this comparison were related to spore formation (DIT1, OSW2, and SPS22) and cell wall biosynthesis (KNH1 and CHS3), thiamine biosynthesis (THI4, THI5, THI11, THI13, SNZ2, SNZ3, and THI12), and genes coding for oxidoreductases involved in the Ehrlich pathway (AAD4, AAD16, AAD14, ADH6, and ADH7). Several genes related to allantoin catabolic processes were also upregulated (DAL1, DAL2, DAL4, DAL7, DUR1,2).
Many of the enriched GO terms regarding downregulated genes were involved with iron, copper, and zinc transport (FIT1, FIT2, FIT3, FET4, FRE2, FRE3, FRE4, FRE5, CTR3, ZRT1, ZRT2, and ZRT3). Some amino acid transporters were downregulated (TAT1, MMP1, AGP2, MUP1, MUP3, BAP2, BAP3, YCT1, and VBA3). Under the enriched GO terms, “sulfur amino acid biosynthesis” and “metabolic processes” were genes involved in methionine and cysteine biosynthesis. These were downregulated, and many of these are involved in the sulfate reduction sequence (SRS) pathway (SUL1, SUL2, MET3, MET14, MET16, MET5, MET10, MET2, MET17, CYS3).
In L. thermotolerans, genes relating to ergosterol biosynthesis (NCP1, HMG1, ERG1, ERG11, ERG13, ERG25, ERG3, and ERG5) were enriched under the GO term “steroid metabolic process” (Table 4). Oxidation-reduction processes were upregulated, with 47 genes enriched to this GO term.
Similar to S. cerevisiae, L. thermotolerans downregulated genes involved with iron, copper, and zinc transport (FTR1, FTH1, FRE1, FRE3, FRE5, FET3, FET5, SIT1, CTR1, CTR3, and ZRT3). These genes were enriched under most of the listed GO terms, such as “transition metal ion transport” and “siderophore transport” (Table 4).
Consistent differential expression of genes as a result of cell-cell contact in S. cerevisiae
Genes consistently differentially expressed when comparing the two types of co-cultures (CC+_VS_CC−) and when comparing cell-cell contact co-cultures with monocultures (CC+_VS_Lt/Sc) were of particular interest. Common enriched GO terms between these two comparisons were identified and summarized in Fig. S1 and S2. Shared enriched GO terms were presented in relation to the percentage of enriched genes that make up the total genes associated with specific GO terms. Only GO terms with percentages higher than 10% were included in these figures. This analysis revealed a cluster of genes, which were consistently up- or down-regulated between these two comparisons. If the expression of these genes is related to cell-cell contact with another species, it is to be expected that contrasting differential expression would be observed between the comparisons with cell-cell contact and those without or that no significant change in expression would be observed in the comparisons without cell-cell contact. Indeed, for most of these genes, this is the case, and a summary of genes relating to the cell wall (in terms of structure and adhesion) and certain metabolites is summarized in Fig. 3. In S. cerevisiae, genes from the PAU gene family were upregulated consistently between these two comparisons (PAU2, PAU5, PAU7, PAU15, PAU17, and PAU23), and no differential expression was detected for these genes in the CC−VS_Sc comparison (when cell-cell contact was not a contributing factor). Some of the highest log_2 fold changes were also detected for these genes (ranging from 2 to 6). Other cell wall-related genes such as TIR1, TIR2, DAN1, DAN4, and PIR3 were upregulated when comparing co-cultures (CC+_VS_CC−). S. cerevisiae upregulated genes related to spore formation and cell wall biogenesis in response to cell-cell contact, and for all but one of these genes (DTR1), no differential expression was detected in the CC+_VS_Sc comparison. A subset of genes involved in thiamine biosynthesis were upregulated when comparing the two co-cultures (THI12, THI13, THI5, THI11, and THI4), and ergosterol biosynthesis genes were upregulated in a similar manner. In the CC+_VS_CC− comparison, it was observed that S. cerevisiae downregulated genes relating to flocculation (FLO1, FLO5, and FLO9) and methionine and cysteine biosynthesis (MET3, MET5, MET10, MET14, MET16, MET17, and SUL2). For all but one gene (SUL1), these make up all genes encoding the pathway leading up to H_2_S formation. In contrast, these genes were upregulated at 2 h (File S1) when comparing the co-cultures (CC+_VS_CC−).
Differential expression of genes pertaining to specific biological processes or structural components of S. cerevisiae in the different fermentation comparisons (CC+_VS_CC−; CC+_VS_Sc; CC−_VS_Sc).
Consistent differential expression of genes as a result of cell-cell contact in L. thermotolerans
In L. thermotolerans (Fig. 4), genes involved in ergosterol biosynthesis were upregulated (ERG1, ERG3, ERG5, ERG11, ERG13, and ERG25) when comparing CC+ with CC−. All but one of these genes was upregulated when comparing CC+ with the monoculture. Heat shock protein (HSP) genes were upregulated in both cell-cell contact comparisons (HSP42, HSP78, HSP104, SSA2, SSA3).
Differential expression of genes pertaining to specific biological processes of L. thermotolerans in the different fermentation comparisons (CC+_VS_CC−; CC+_VS_Lt; CC−_VS_Lt).
Genes associated with iron and copper transport were downregulated when comparing CC+ with CC− (FIT2, FIT3, FET4, FET3, FET5, FTR1, FRE1, FRE5, FTH1, SIT1, ARN2, CTR1, and CTR4), with FIT2 and FIT3 log_2_ fold changes being some of the highest observed for L. thermotolerans (6.92 and 7.13, respectively). Similar to S. cerevisiae and when comparing the two co-cultures (CC+_VS_CC−), L. thermotolerans also downregulated genes involved with flocculation. These included KLTH0E00242g, KLTH0D17050g, KLTH0C00440g, KLTH0F19888g (which show similarity to FLO1 in S. cerevisiae), and KLTH0C11924g (which shows similarity to FLO5 in S. cerevisiae). Two of these were also downregulated when comparing CC+ with the monoculture (KLTH0E00242g and KLTH0C11924g), and all but one of these genes had no differential expression when comparing CC− with the monoculture (when cell-cell contact was not a contributing factor).
qRT-PCR validation of transcriptomic data and further characterization of genes of interest
Following transcriptomic characterization of interactions between S. cerevisiae and L. thermotolerans, certain genes of interest were selected, and their roles in interaction were further characterized through qRT-PCR. The gene expression profiles generated for S. cerevisiae and L. thermotolerans when comparing CC+ with the respective monocultures also served as validation for the transcriptomic study. The genes of interest were further analyzed through relative gene expression determined at three different stages of fermentation and in co-culture with other relevant non-Saccharomyces yeasts (T. delbrueckii and K. marxianus).
In co-culture, growth as a measure of viable colony counts for S. cerevisiae and L. thermotolerans (Fig. 5A) was similar to results from fermentations in the compartmentalized bioreactor. The two yeasts achieved high cell densities in monocultures and slightly lower when in co-culture. In the latter fermentations, S. cerevisiae was able to persist until the end. This contrasts with L. thermotolerans, in which cell concentrations gradually declined from 48 h. Nevertheless, viable L. thermotolerans cells were still present at high densities by the end of fermentation. Similarly, when grown in co-culture with T. delbrueckii, S. cerevisiae viable cell counts were slightly lower compared with its monoculture, and although the counts were slowly declining, the yeast was still able to persist until the end of fermentation (Fig. 5B). In contrast, T. delbrueckii viable cell counts were significantly lower compared with its monoculture. This yeast initially achieved higher cell numbers compared with S. cerevisiae, and in contrast to L. thermotolerans, cell numbers rapidly declined from 48 h. After 96 h, no viable cells were detected. A similar scenario unfolded for K. marxianus in co-culture with S. cerevisiae (Fig. 5C). In monoculture, growth for the two yeasts was comparable, with a decline in cell numbers occurring slightly earlier for K. marxianus and both yeasts persisting until the end of fermentation. The yeasts had a similar growth pattern in co-culture until 48 h. From this time point, K. marxianus growth declined significantly and no viable cells were detected after 96 h.
Yeast growth represented as the log of viable colony counts (CFU/mL) for each non-Saccharomyces pairing (L. thermotolerans [A], T. delbrueckii [B] and K. marxianus [C]) with S. cerevisiae. Monoculture data (Sc ●; Lt ■; Td ♦; Km +) are represented as solid lines, and co-culture with physical contact (Sc ▲; non-Saccharomyces yeast X) is represented as dashed lines. Vertical dashed lines indicate the 2 h, 12 h, and 24 h RNA sampling points. Data represented by three biological repeats. Error bars indicate standard deviation. Sc: S. cerevisiae; Lt: L. thermotolerans; Td: T. delbrueckii; Km: K. marxianus.
Relative gene expression levels were quantified in monoculture (control) and co-culture with cell-cell contact (experimental) and expressed as log_2_ fold changes. These were then compared between time points (stages of fermentation) and between the different non-Saccharomyces pairings.
Comparison of gene expression during different stages of fermentation
S. cerevisiae gene expression was quantified at three-time points in the co-cultures with the three different yeast species: entry into exponential growth phase (2 h), mid-exponential phase (12 h), and late exponential phase (24 h) (Fig. 6). Except for FLO genes, the results (PAU and TIR genes) correlate well with the transcriptomic study, which had been carried out at the 24 h time point. In co-culture with L. thermotolerans (Fig. 6A), the expression of most genes was higher at the later time points compared with 2 h (PAU17, PAU23, TIR2, FLO5, and FLO9). While FLO5 and FLO9 were upregulated in this experiment, this result stands in contrast to the transcriptomic analysis in bioreactors at 24 h. PAU5 expression appeared to be relatively consistent between all stages of fermentation, and no clear trend could be observed for HSP12, with high standard deviation between biological repeats. This was also observed for S. cerevisiae HSP12 expression in co-culture with T. delbrueckii (Fig. 6B). Here, PAU expression was usually higher at the earlier time points compared with 24 h. A similar trend was observed for TIR2 and HSP12. FLO5 and FLO9 expressions were nearly identical, with similar expression levels at early and late exponential phase (2 h and 24 h) and lowest being at mid-exponential phase (12 h). In fact, trends for FLO gene expression were different between all three non-Saccharomyces pairings. Like T. delbrueckii, S. cerevisiae PAU, TIR2, and HSP12 gene expression was similar in co-culture with K. marxianus (Fig. 6C), whereas FLO5 and FLO9 expression was the highest early in fermentation.
Relative gene expression represented as log2 fold changes for a subset of S. cerevisiae genes at different time points (2 h, 12 h, and 24 h) in co-culture with L. thermotolerans (A), T. delbrueckii (B), and K. marxianus (C). For each gene, statistical differences were calculated between the three-time points. Statistical significance is indicated with lowercase letters by a P-value threshold of <0,05. Statistically similar values are represented by the same letter, and statistically different values are represented by different letters. Error bars indicate standard deviation.
The expression of some non-Saccharomyces genes of interest was also quantified (Fig. 7). In co-culture with S. cerevisiae, the general trend for all genes tested (HSP42, HSP104, FLO1, and FLO5) in L. thermotolerans was a higher expression early in fermentation compared with 24 h. In co-culture with S. cerevisiae, T. delbrueckii HSP12 expression exhibited high standard deviation at 2 h and was consistently upregulated at mid- to late-exponential phase (Fig. 7B). For this yeast, HSP42 and HSP104 expression was highest later in fermentation (which is in contrast to L. thermotolerans). In K. marxianus (Fig. 7C), HSP12 expression was highest at the later time points while the opposite was observed for HSP104. In contrast to L. thermotolerans, FLO5 was upregulated in co-culture at all time points with the highest relative gene expression occurring at 24 h.
Relative gene expression represented as log2 fold changes for a subset of genes at different time points (2 h, 12 h, and 24 h) belonging to L. thermotolerans (A), T. delbrueckii (B), and K. marxianus (C) in co-culture with S. cerevisiae. For each gene, statistical differences were calculated between the three-time points. Statistical significance is indicated with lowercase letters by a P-value threshold of <0,05. Statistically similar values are represented by the same letter, and statistically different values are represented by different letters. Error bars indicate standard deviation.
Comparison of S. cerevisiae relative gene expression between different non-Saccharomyces pairings
Relative gene expression profiles were also compared between species at each time point (Fig. 8). At the early exponential phase (2 h), all evaluated S. cerevisiae genes were upregulated in co-culture with all three non-Saccharomyces yeasts. Broadly, expression of genes was highest in K. marxianus compared with the other two non-Saccharomyces yeasts. At mid-exponential phase (Fig. 8, 12 h), there were minor differences between PAU gene expression. Similar expression levels were obtained for TIR2 in T. delbrueckii and L. thermotolerans pairings and were also higher compared with K. marxianus. FLO5 and FLO9 were expressed significantly more in co-culture with L. thermotolerans compared with the other two non-Saccharomyces yeasts. Relative gene expression of S. cerevisiae genes was the most similar between non-Saccharomyces yeasts at the late exponential phase (Fig. 8, 24 h). Here, most of the genes were upregulated, and there were no statistical differences between the different non-Saccharomyces pairings for PAU5, PAU17, TIR2, and HSP12 log_2_ fold changes. Similar expression levels were observed for FLO5 and FLO9 in co-culture with L. thermotolerans and T. delbrueckii, and these were significantly higher than K. marxianus.
Relative gene expression represented as log2 fold changes for a subset of S. cerevisiae (Sc) genes at different time points (2 h, 12 h, and 24 h) in co-culture with L. thermotolerans (Sc_Lt), T. delbrueckii (Sc_Td), and K. marxianus (Sc_Km). For each gene, statistical differences were calculated between the three non-Saccharomyces pairings. Statistical significance is indicated with lowercase letters by a P-value threshold of <0,05. Statistically similar values are represented by the same letter, and statistically different values are represented by different letters. Error bars indicate standard deviation. Sc: S. cerevisiae; Lt: L. thermotolerans; Td: T. delbrueckii; Km: K. marxianus.
DISCUSSION
In the present study, the previously reported antagonistic relationship between S. cerevisiae and L. thermotolerans (24) was explored further. The transcriptomic analysis revealed a larger number of differentially expressed genes for S. cerevisiae and L. thermotolerans at 24 h versus 2 h in the different comparisons. This might be due to the fermentation medium still being abundant in nutrients at 2 h; therefore, competition for these was limited. At this time point, cells were also still adjusting to the new environmental conditions and consequently were in lag phase. Cell concentrations were also considerably lower; therefore, less cell-cell contact was occurring versus at 24 h.
At 24 h and in S. cerevisiae, fewer differentially expressed genes were shared between the cell-cell contact comparisons compared with L. thermotolerans (Table 2). S. cerevisiae persisted relatively consistently within the respective fermentations and was not as affected as L. thermotolerans by the physical presence of another yeast. This likely explains the greater transcriptomic response in L. thermotolerans. This transcriptomic regulation in L. thermotolerans aligns well with previously reported co-culture studies of S. cerevisiae and L. thermotolerans (identical strain) under anaerobic conditions in a similar fermentation medium but using very different, semi-continuous fermentation conditions (28).
In the transcriptomic analysis, iron and copper uptake were downregulated in both S. cerevisiae and L. thermotolerans. FIT2 and FIT3 are cell wall genes responsible for retaining siderophore bound iron in the cell wall before being taken up into the cell (32). Their expression is also induced by iron deprivation. The higher expression of these genes in CC− could be explained by the ability of L. thermotolerans to survive better when not in physical contact with S. cerevisiae. Therefore, iron availability could have been lower, resulting in earlier deprivation in CC−, which could have caused the observed increased regulation of iron uptake in both yeasts. The downregulation of iron and copper uptake genes has been reported before (28) and in particular for L. thermotolerans with FIT2 and FIT3 log_2_ fold changes similar to the current study. In response to physical contact, S. cerevisiae also upregulated genes involved with thiamine biosynthesis. This process is upregulated in response to low thiamine levels (33), and the compound is essential in the production of thiamine-pyrophosphate, which serves as a cofactor for pyruvate decarboxylase.
Similar to the present study, two thiamine biosynthesis genes (THI11 and THI13) have previously been reported to be upregulated by S. cerevisiae in co-culture with L. thermotolerans (29). In a mixed culture of S. cerevisiae and Hanseniaspora guilliermondii, the increased expression of two thiamine biosynthesis genes (THI20 and THI21) was also observed (25). Previous reports have noted the absence of thiamine biosynthesis genes in Hanseniaspora species (34) and that a subset of Lachancea species only contained a single copy or none of the THI5 gene family (35). The absence of these genes in the non-Saccharomyces species likely led to an increase in competition for thiamine and in doing so, forced S. cerevisiae to synthesize it de novo.
Ergosterol biosynthesis genes were upregulated in response to cell-cell contact in both yeasts. This sterol is incorporated into the fungal cell membrane where it plays a role in stabilizing membrane structure, regulating fluidity, permeability, and membrane-bound enzyme activity (36) and has been shown to play an important role in stress adaptation during alcoholic fermentation (37, 38).
The SRS pathway is not only induced when there is a metabolic demand for cysteine and methionine in S. cerevisiae (39) but seemingly by a range of factors such as higher expression of thiamine biosynthesis genes (40) and a lack of vitamins such as pantothenate and vitamin B6 (41, 42). In response to cell-cell contact, genes encoding the complete pathway leading up to the point of H_2_S formation as well as MET17 and CYS3 (cysteine and methionine biosynthesis) were downregulated at 24 h, whereas all but one of these genes (CYS3) were upregulated at 2 h. Since H_2_S concentrations were not monitored, it is difficult to speculate whether the increased expression of these genes in CC+ was solely aimed at H_2_S production, a dual action of H_2_S production and amino acid synthesis or purely the latter. A previous study (43) demonstrated that overexpression of MET17 in S. cerevisiae led to either unchanged or decreased levels of H_2_S, but at the same time, the resulting increased enzymatic activity did not lead to an increase in cysteine production either. However, these authors do not account for the fact that released H_2_S can react with other compounds present in the fermentation, which might explain why no differences or decreased values were observed (39). Nitrogen deficiency early in fermentation (2 h) is an unlikely scenario. Given the fact that there would not have been a strong metabolic demand for cysteine or methionine synthesis at this time point, the need for S. cerevisiae to express these genes more at 2 h (when in physical contact with L. thermotolerans) indicates a possible role in cell-cell interaction. Indeed, the idea that H_2_S production may offer S. cerevisiae a competitive advantage over cohabiting yeasts by inhibiting respiration and oxidative metabolism has been hypothesized before (39, 44) but has not been verified. This hypothesis merits further investigation.
In response to cell-cell contact, S. cerevisiae responded by upregulating structural elements of the cell wall and genes involved in maintaining cell wall integrity. In particular, the PAU genes seemed important in this strategy and their expression in S. cerevisiae has been shown to be induced by the stressful environment during wine fermentation (45–47). These genes have also been linked to yeast interactions (27, 28). The fact that no differential expression for PAU genes was detected when physical contact was excluded indicates that their expression is induced by the physical presence of a cohabiting yeast through a cell-cell trigger and could also partly explain why S. cerevisiae experienced a slight drop in culturability in the CC− fermentations. These results were validated in the qRT-PCR approach in co-culture with L. thermotolerans. In this experiment, the expression of PAU genes was consistently upregulated and higher at 24 h for two PAU genes. In contrast to co-fermentations with L. thermotolerans, PAU gene expression was, in most cases, higher at the earlier time points in co-culture with both T. delbrueckii and K. marxianus. These results broadly align with those of a previous study (27). S. cerevisiae’s expression of PAU genes in co-culture seems to be vital at the onset of fermentation and appears to be modulated differently depending on interacting species.
Other S. cerevisiae cell wall genes, which were upregulated in the transcriptomic cell-cell contact comparisons, were TIR1, DAN1, DAN4, PIR3, and TIR2. The expression of genes belonging to the DAN/TIR family is triggered by anaerobiosis (48–50) and some by cold shock (51, 52). These genes encode cell wall mannoproteins and play a role in cell wall permeability (53). In S. cerevisiae, TIR2 was upregulated at 24 h in co-culture with L. thermotolerans and, therefore, further validated the transcriptomic results. The differential expression of genes belonging to the DAN/TIR family in response to biotic stresses in co-culture with T. delbrueckii and K. marxianus has not been reported before.
Another cell wall-related response was the consistent downregulation of flocculation genes in the transcriptomes of both S. cerevisiae (FLO5 and FLO9) and L. thermotolerans (FLO1 and FLO5) in response to cell-cell contact. Similarly, FLO1 was previously found to be downregulated in L. thermotolerans in co-culture with S. cerevisiae (28). While FLO genes have been studied extensively in S. cerevisiae (54, 55), their exact role in relation to interaction and adaptation to cohabiting yeasts within a wine ecosystem has not been well documented. Co-adhesion between different species has recently been reported (56, 57), and these authors proposed a supplementary role of FLO gene expression as a way for cohabiting yeasts to control ecosystem dynamics. The fact that FLO gene expression was downregulated in response to cell-cell contact suggests a strategic response whereby these species avoid co-adhesion and, therefore, not to offer an adaptive advantage to the cohabiting species. At 24 h, qRT-PCR FLO expression data generated for the yeast pair S. cerevisiae–L. thermotolerans did not correlate with the transcriptomic data. The regulation of FLO genes and factors contributing to their expression remains elusive and is perpetuated by often contradicting and varying FLO gene expression profiles (28, 58). Such variability is likely due to differences in experimental layout, and the fact that genes located in sub-telomeric regions have been proposed to be under epigenetic regulation to hedge for changing environmental conditions (54, 59). Such epigenetic changes could serve as a strategy for S. cerevisiae to not commit all of its cells to one phenotype (60) and, in this way, modulate population dynamics in different ways in different parts of the fermentation. While the RNA-seq and qPCR data represent a population average, a small percentage of individual cells may be responding differently, expressing FLO genes at higher or lower levels than average. Such a survival strategy would also aid parts of the population to be pre-adjusted to future environmental changes. When comparing qRT-PCR with RNA-seq, a high concordance between these two methods was observed, with only 15%–20% of genes tested showing contrasting expression profiles, regardless of RNA-seq workflow chosen (61). Most of these “non-concordant” genes had differential expression levels < 2, and some were found to be expressed at very low levels. In our RNA-seq and validation approach, FLO genes possibly fall into the “non-concordant” category, and future work would have to consider different validation approaches for these genes. Regardless of these results, RNA-seq is still considered the standard for these types of transcription studies (61), and the results obtained in the present data set are of great value to our understanding of yeast interactions and gene functions. S. cerevisiae FLO gene expression was consistently different between species at each time point in the qRT-PCR approach. The most notable difference can be observed at late exponential phase. Here, expression for most of the other genes was statistically similar, whereas FLO gene expression appeared to be species-dependent. S. cerevisiae FLO5 and FLO9 expressions were similar between the co-culture fermentations with L. thermotolerans and T. delbrueckii, and these were significantly higher than K. marxianus. Since L. thermotolerans and T. delbrueckii are more common cohabiting yeasts of grape must than K. marxianus, this observation could indicate a possible strategy evolved over time aimed at specific species by S. cerevisiae. When S. cerevisiae FLO gene expression in co-culture was at its highest, the expression of FLO1 and FLO5 in L. thermotolerans and K. marxianus, respectively, at the corresponding time point, was at its lowest. This again points to an avoidance of co-adhesion by all species involved. These data correlate well to a previous report that co-adhesion of a S. cerevisiae overexpressing FLO5 strain with L. thermotolerans led to a loss in viability in S. cerevisiae (57). This serves as motive behind the downregulation of FLO genes in response to cell-cell contact in S. cerevisiae: to avoid a loss in viability. In the same study, the viability in L. thermotolerans was increased. Thus, in the current study, the latter might be regulated in L. thermotolerans/K. marxianus to avoid adhesion with S. cerevisiae (57).
Previous studies have linked the stress-inducible heat shock protein (HSP) genes to yeast interactions. Several HSP genes were upregulated in L. thermotolerans in response to cell-cell contact (such as HSP42 and HSP104). Upregulation of these genes has been observed in both S. cerevisiae and T. delbrueckii in co-culture (27). In S. cerevisiae, HSP104 affords tolerance to heat, ethanol, and arsenate (62) by acting as a protein disaggregation agent (63), whereas HSP42 acts as a sorting label by co-aggregating with misfolded proteins generated from heat shock (64). These roles have not been assigned in L. thermotolerans; however, these data suggest an additional role of HSP proteins as a stress response to a cohabiting yeast within a specific ecosystem. It has been suggested that HSP12 may be released into the extracellular environment to act as a stress signal and that the combined action of the Pau5p, Hsp12p, and killer toxins offers S. cerevisiae a way to regulate production and utilization of nutrients within the ecosystem, even if it may come at a cost to itself (65). The expression of this gene in S. cerevisiae was not consistent in co-culture with L. thermotolerans, with much variation observed between replicates. Differential expression of this gene was high at 2 h when in co-culture with T. delbrueckii and K. marxianus, respectively. In both cases, gene expression was significantly lower at 24 h. The data correlate to a previous study that observed that S. cerevisiae upregulated HSP12 expression at 2 h and 12 h in co-culture with T. delbrueckii (27). Taking the current data set into account and since these authors also observed upregulation of PAU5 at 2 h, the combined action of these two genes might not only be a strategy utilized between S. cerevisiae strains (65) but also aimed at different non-Saccharomyces species, in a possible species-specific manner. The observed drop in viable cell counts for T. delbrueckii and K. marxianus after 48 h might also be linked to this combined action. However, this observation, as well as the apparent species-specific PAU, TIR2, and HSP12 responses, requires further investigation. In co-culture with all three non-Saccharomyces yeasts, S. cerevisiae HSP12 was upregulated at 24 h at high log_2_ fold changes, and its expression in co-culture was highest at this time point when compared with single culture. This trend was similar for HSP42 and HSP104 in T. delbrueckii and confirms previous results (27). HSP104 expression in L. thermotolerans and K. marxianus was similar, and since these two non-Saccharomyces yeasts are closely related (66), these results may indicate a conserved role in interactions for HSP104 between L. thermotolerans and K. marxianus, but again, this needs further investigation.
Conclusions
In the current study, the molecular responses to physical interspecies contact between S. cerevisiae and L. thermotolerans were explored. The data provide evidence that different yeast species exhibit different adaptive strategies. S. cerevisiae responses were cell wall focused and included the higher expression of genes involved with maintaining cell wall integrity and structure of the cell wall (PAU, DAN, and TIR). The early induced expression of SRS-pathway genes by S. cerevisiae might also be linked to a strategy aimed at outcompeting a cohabiting yeast, but further investigation is needed to confirm this. In turn, L. thermotolerans responded by increasing the production of stress response genes (HSP), whereas both yeasts avoided co-aggregation during co-fermentation.
Beyond these adaptations, the data provide the first evidence for species-specific interaction responses since differential transcriptomic responses as a result of cell-cell contact between S. cerevisiae and non-Saccharomyces yeasts have not been reported before. Species specific differential expression was observed for PAU, TIR2, HSP12, and FLO genes in S. cerevisiae. The species-specific regulation of adhesion genes occurred between two closely related non-Saccharomyces yeasts, and avoidance of co-adhesion appeared to be a response. Taken together with the data from Conacher et al. (29), the data provide a novel perspective on fundamental molecular mechanisms that may regulate ecosystem functioning and reveal novel functional roles of S. cerevisiae and non-Saccharomyces genes.
The data provide an important baseline for future yeast ecosystem and interaction studies. They also provide new avenues for the investigation of the role and mechanisms of biotic selection pressures in the evolutionary adaptations of yeast species to ecological niches.
MATERIALS AND METHODS
Fermentations in a compartmentalized bioreactor system
Synthetic grape must monoculture and co-culture fermentations (Table 5) were performed using the commercial S. cerevisiae strain Lalvin EC1118 (Lallemand Inc., Montreal, QC, Canada) and L. thermotolerans IWBT Y1240 (CBS 16374). The latter yeast was obtained from the South African Grape and Wine Research Institute (SAGWRI) yeast culture collection at Stellenbosch University, South Africa. Medium composition, inoculation strategies, and fermentation parameters were done according to previous compartmentalized fermentations (24). Fermentations were completed in duplicate.
Co-culture fermentations excluding cell-cell contact (CC−) were achieved with the use of a compartmentalized bioreactor that can physically separate two microbial populations. This is done with the use of a membrane (0.1 µm cutoff), which was submerged into the fermentation medium inside one of the two compartments and connected to the adjacent compartment. With the use of filter-sterilized nitrogen gas applied into the headspace of one of the two compartments, medium was exchanged into the other compartment. The fermentation medium was continuously pumped from one compartment to the next until fermentations were completed ([total sugar] = <5 g/L). Experimental procedures were kept the same (except for removal of membrane) for co-cultures with cell-cell contact (CC+) and monoculture fermentations (Sc; Lt).
RNA extraction, sequencing, and data processing
To avoid possible transcriptomic differences because of the physical presence of the membrane and the pumping, the entire media transfer system and the membranes were maintained for monocultures and the cell-cell contact co-cultures up until the last RNA sampling point. Hereafter, the membrane was removed where applicable. For RNA extractions, samples were taken at 2 h and 24 h. Total RNA extractions were performed using the hot phenol method (67). In total, two biological and two technical repeats of each fermentation type were sequenced. Monocultures (Lt and Sc) as well as CC− (CC−_Lt and CC−_Sc) samples were combined, respectively, and extracted together, therefore representing manually “mixed” monoculture (Lt/Sc) and CC− samples. Therefore, four mixed sample libraries (two biological and two technical repeats) of each fermentation type (Monoculture, CC+, and CC−) were created and sequenced. RNA concentrations and quality were determined using a Nanodrop 2000 Spectrophotometer (Thermo Fisher Scientific, Wilmington, DE, USA), and RNA integrity (RIN) was determined using a Bioanalyzer, 2100 expert software (Agilent, Santa Clara, CA, USA) and using the eukaryote total RNA program. Samples with a 260/280 (nm) ratio of greater than 2 and a RIN of 8 or more were sequenced. Library preparation and sequencing were performed by VIB Nucleomics core (KU, Leuven, Belgium) according to a previous study (28). After sequencing, adapters were trimmed at the end (at least 10 bp overlap and 90% match) using cutadapt 1.15 (68), and reads shorter than 35 bp were removed. Hereafter, low-quality ends (< Q20) were removed using FastX 0.0.14 (http://hannonlab.cshl.edu/fastx_toolkit/index.html), and again, reads shorter than 35 bp were removed. Lastly, poly-A-reads, ambiguous reads (containing N), low-quality reads (> 50% of the bases < Q25), and artifact reads were removed using FastX and ShortRead 1.36.1 (69). Broken pair reads and contaminants were removed using bowtie 2.3.3.1.
Data analysis and identification of differentially expressed genes
Following the above pre-processing steps, reads were aligned to the reference genomes of S. cerevisiae S288C and L. thermotolerans CBS6340 using STAR 2.5.2b (70). Gene annotation was performed using a combined reference genome S288CplusLT to which all samples were aligned (28). Merging of the genomes proved successful, since a cross-mapping attempt between S. cerevisiae and L. thermotolerans reference genomes was found to be <1% (28). Reads with non-primary mappings or that have a mapping quality of ≤20 were removed using samtools 1.5 (71). Subsequent bam files were obtained and along with a corresponding feature file (concatenated S. cerevisiae S288C and L. thermotolerans CBS 6340 reference genomes in gff format) and were used to calculate the number of reads mapping to a specific gene using htseq-count 0.9.1 (72). Genes for which all samples had less than 1 count-per-million were removed (73). A full quantile normalization was performed using EDAseq 2.6.2 (74). This step accounts for differences in GC content and transcript length within samples and differences in library size and RNA composition between samples. Hereafter, data for technical repeats were combined, and biological repeats were represented by the calculated average. Lastly, edgeR 3.14.0 (31) was used to compare the remaining two biological repeats of each fermentation type by performing statistical analysis and identification of differentially expressed genes according to previous work (28). Six comparisons between fermentation types and species were made according to Table 6.
For each comparison, differential expression was computed and expressed using the underlined settings as experimental, therefore, upregulated, or downregulated within the underlined fermentation type (Table 6). Data with log_2_ fold changes > 1 and an adjusted P-value < 0.05 were considered significant and analyzed further. VENN diagrams were constructed using VENNY 2.1.0 (75). A GO term enrichment analysis was performed using Amigo2 (76) and redundant GO terms were removed using REVIGO (77).
qRT-PCR validation of RNA-seq data and further characterization of genes of interest
Fermentation setup
Additional to strains EC1118 and Y1240, T. delbrueckii strain BIODIVA (Lallemand Inc.), and K. marxianus strain IWBT Y885 obtained from SAGWRI (Stellenbosch University) were used. Yeast cultures were maintained at 4°C on YPD agar (20 g/L glucose, 20 g/L peptone, 10 g/L yeast extract, and 20 g/L agar). Fermentations were performed in the same synthetic grape must medium used in previous work (24). Four types of monoculture fermentations were performed (one for each species listed above) and were completed in triplicate. Three types of co-culture fermentations were performed: S. cerevisiae simultaneously inoculated with L. thermotolerans, T. delbrueckii, and K. marxianus, respectively, and were completed in triplicate. To obtain pre-cultures, a single colony was inoculated into 100 mL YPD broth and incubated overnight at 30°C and 100 rpm. Prior to inoculation, the pre-cultures were centrifuged at 4,000 × g and washed with 0.9% (m/vol) NaCl. Monocultures were inoculated at 2 × 10^6^ cells/mL, and co-cultures were inoculated at 1 × 10^6^ cells/mL of respective species (total of 2 × 10^6^ cells/mL). Fermentations were conducted in 200 mL of synthetic grape must in Erlenmeyer flasks and kept at 30°C on a shaker (100 rpm). Throughout fermentation, samples were taken at regular intervals, and growth was monitored on Wallerstein (WL) (Sigma-Aldrich, St. Louis, MO, USA) nutrient agar plates. Flasks were also weighed before and after each sampling to monitor fermentation progression.
qRT-PCR analysis
Qualitative real-time polymerase chain reaction was performed for some genes of interest (Table S1). RNA was extracted at 2 h, 12 h, and 24 h according to the same method used in the transcriptomic analysis, and gene expression in S. cerevisiae, L. thermotolerans, T. delbrueckii, and K. marxianus was quantified. To get rid of any DNA contamination, the samples were treated using RQ1 RNAse free DNase from Promega (Madison, WI, USA). The RNA was precipitated by adding 0.1 vol of a 3 M Sodium acetate solution (pH 5.2) and 2.5 volumes of 100% ethanol and left overnight at −20°C. Thereafter, the samples were centrifuged at maximum speed for 10 min at 4°C, the supernatant was removed, and the pellet resuspended was in 30 µL of ultrapure water treated with diethylpyrocarbonate (DEPC). The concentration and quality of samples were analyzed using a Nanodrop 2000 Spectrophotometer from Thermo Fisher Scientific (Waltham, MA, USA) and gel electrophoresis (1% agarose gel, ethidium bromide staining). To ensure the absence of DNA, PCR amplification using Ex Taq DNA polymerase (Takara Bio Inc., Kasatsu, Shiga, Japan) of the ITS1-5.8S rRNA-ITS2 gene was performed, and no amplicons were obtained (1% agarose gel, ethidium bromide staining), thus indicating successful DNase treatment of the RNA samples. The primer set used was ITS1 (5′-TCCGTAGGTGAACCTCGCG-3′) and ITS4 (5′-TCCTCCGCTTTATTGATATGC-3′). The PCR program was as follows: 95°C for 5 min; 30 cycles of 95°C for 30 s, 52°C for 30 s, 72°C for 1 min; 72°C for 10 min. cDNA was synthesized using the ImProm-IITM Reverse Transcription System from Promega (Madison, WI, USA) with Oligo(dT)15 primers.
A QuantStudio 3 Real-Time PCR system from Applied Biosystems with QuantStudio Design & Analysis Software v1.5.1 (Life Technologies, Carlsbad, CA, USA) was used to perform qRT-PCR. Reference genes for each yeast can be found in Table S1. Two reference genes were used for each qRT-PCR cycle, and the average CT value of the two was used in the ΔΔCT calculations. Primers were designed using the NCBI Primer design tool (https://www.ncbi.nlm.nih.gov/tools/primer-blast/) and were obtained from Inqaba biotec (Pretoria, South Africa). Genes were amplified using the Ampliqon RealQ plus 2x Master Mix Green (Ampliqon A/S, Odense, Denmark). Within each run, a negative control was included. PCR cycling conditions for primers (excluding Taqman) were as follows: hold stage of 50°C for 2 min and denaturation at 95°C for 10 min; 40 cycles of 95°C for 15 s and (annealing temperatures, Table S1) °C for 30 s and 72°C for 32 s; melt curve stage of 95°C for 15 s, 60°C for 1 min, and 95°C for 1 s. PCR cycling conditions for Taqman primers were as listed above excluding a melt curve stage. These customized Taqman hydrolysis probe sets were obtained from Thermo Fisher Scientific (Waltham, MA, USA). For each primer pair used, primer efficiency (E) was determined by making a serial dilution of cDNA, plotting C_T_ values (y-axis) VS log([cDNA]) (x-axis), calculating the slope of resulting C_T_ values and using the formula E = 100 × (10^−1/slope^ − 1).
A comparative critical threshold method (ΔΔC_T_) was used to calculate relative expression (RE) and log_2_ fold changes (78). Comparing monocultures (control) with co-cultures (experiment) poses an added challenge: an experiment group containing cDNA from two species. The Quantstudio 3 software cannot normalize for differences between cDNA composition; therefore, we added an additional step to the ΔΔC_T_ calculation to account for differences in cDNA concentration between the control and experiment groups (File S2). In the case of large transcriptional differences, this challenge does not pose a threat; however, in the case where genes are expressed at lower levels (regardless of treatment), small, meaningful differences may be missed if this is not accounted for.
Therefore, we adopted the following ΔΔC_T_ approach:
For the control (monocultures) and experiment (co-cultures):ΔC_T_ = C_T_ (target gene) – C_T_ (reference gene)Added normalization step to account for differences in cDNA concentrations between control and experimental groupsΔC_T_norm (control) = ΔC_T_ + Calculated C_T_normΔΔC_T_ = ΔC_T_ (experiment) - ΔC_T_norm (control)RE (fold change) =2^−ΔΔCT^Log_2_ fold change = Log_2_ (RE)
Statistical analysis
qRT-PCR data were analyzed through analysis of variance (one-way ANOVA) and a least-significance-difference (LSD) test using Statistica software version 13.5.0.17 (StatSoft Inc., Tulsa, OK, USA). Differences were considered significant when P-values < 0,05. Relative gene expression graphs represent the average of three biological repeats, and error bars represent standard deviation. Data points that were statistically similar were annotated with an identical letter and data points that were statistically different were annotated with different letters.
The reference list from the paper itself. Each links out to its DOI / PubMed record.
- 1Ciani M, Capece A, Comitini F, Canonico L, Siesto G, Romano P. 2016. Yeast interactions in inoculated wine fermentation. Front Microbiol 7:555. doi:10.3389/fmicb.2016.0055527148235 PMC 4840204 · doi ↗ · pubmed ↗
- 2Liu Y, Rousseaux S, Tourdot-Maréchal R, Sadoudi M, Gougeon R, Schmitt-Kopplin P, Alexandre H. 2017. Wine microbiome: a dynamic world of microbial interactions. Crit Rev Food Sci Nutr 57:856–873. doi:10.1080/10408398.2014.98359126066835 · doi ↗ · pubmed ↗
- 3Bordet F, Joran A, Klein G, Roullier-Gall C, Alexandre H. 2020. Yeast-yeast interactions: mechanisms, methodologies and impact on composition. Microorganisms 8:600. doi:10.3390/microorganisms 804060032326124 PMC 7232261 · doi ↗ · pubmed ↗
- 4Roullier-Gall C, David V, Hemmler D, Schmitt-Kopplin P, Alexandre H. 2020. Exploring yeast interactions through metabolic profiling. Sci Rep 10:6073. doi:10.1038/s 41598-020-63182-632269331 PMC 7142100 · doi ↗ · pubmed ↗
- 5Bagheri B, Bauer FF, Cardinali G, Setati ME. 2020. Ecological interactions are a primary driver of population dynamics in wine yeast microbiota during fermentation. Sci Rep 10:4911. doi:10.1038/s 41598-020-61690-z 32188881 PMC 7080794 · doi ↗ · pubmed ↗
- 6Beckner Whitener ME, Carlin S, Jacobson D, Weighill D, Divol B, Conterno L, Du Toit M, Vrhovsek U. 2015. Early fermentation volatile metabolite profile of non-Saccharomyces yeasts in red and white grape must: a targeted approach. LWT - Food Sci Technol 64:412–422. doi:10.1016/j.lwt.2015.05.018 · doi ↗
- 7Mateo JJ, Maicas S. 2016. Application of non-Saccharomyces yeasts to wine-making process. Fermentation 2:14. doi:10.3390/fermentation 2030014 · doi ↗
- 8Morata A, Escott C, Bañuelos M, Loira I, del Fresno J, González C, Suárez-Lepe JA. 2020. Contribution of non-Saccharomyces yeasts to wine freshness. A review. Biomolecules 10:34. doi:10.3390/biom 10010034 PMC 702239631881724 · doi ↗ · pubmed ↗