rRNA expression kinetics during the chlamydial developmental cycle
Yuxuan Wang, Joseph D. Fondell, Guangming Zhong, Huizhou Fan

Abstract
Genes, proteins, chemicals, diseases, species, mutations and cell lines named across the full text — each resolved to its canonical identifier and authoritative record.
Click any figure to enlarge with its caption.
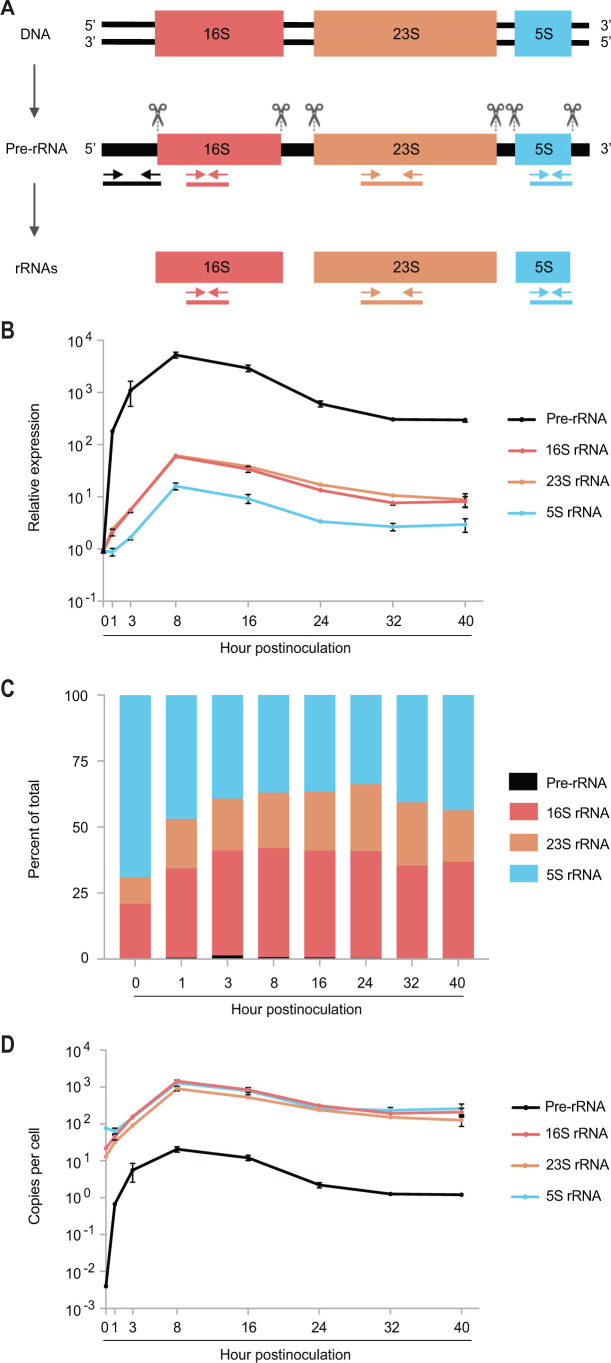 Fig 1
Fig 1- —HHS | National Institutes of Health (NIH)
Peer Reviews
No public reviews on file for this paper yet. If you reviewed it on a platform where reviews are public (OpenReview, ICLR, NeurIPS, ICML), you can paste yours below so the community can read it here.
Videos
No videos yet. Explain this paper in a talk, walkthrough, or lecture? Add one.
Taxonomy
TopicsReproductive tract infections research · Reproductive System and Pregnancy · Adolescent Sexual and Reproductive Health
LETTER
Ribosomes, complexes of three distinct rRNAs (namely, 16S, 23S, and 5S rRNAs) and more than 50 ribosomal proteins, are essential for bacterial protein synthesis (1). In free-living bacteria, ribosomes are more abundant when cultured with rich culture media and during the logarithmic growth phase (2).
Chlamydia is an obligate intracellular bacterium with a unique developmental cycle characterized by two contrasting cellular forms termed the elementary body (EB) and reticulate body (RB) (3). After invading host cells, EBs differentiate into proliferating RBs within 6–8 h. RBs differentiate back into EBs beginning approximately 24 h post-infection (hpi). The progeny EBs and residual RBs are released from host cells beginning at about 40 hpi (3).
RB proliferation requires abundant protein synthesis. Accordingly, RBs must have more ribosomes than EBs. In the Chlamydia trachomatis genome, rRNA genes are organized as a 16S, 23S, and 5S rRNA sequence within two identical rRNA operons (Fig. 1A) (4, 5). Cleavages within the primary transcript (pre-rRNA) produce the three mature rRNAs (Fig. 1A). We recently reported that during the first hour of C. trachomatis infection, pre-, 16S, and 23S rRNAs undergo significant upregulation, whereas 5S rRNA does not (6). Further analysis led to the discovery that 5S rRNA is present in excess relative to 16S and 23S rRNAs, indicating that ribosomes can increase in the absence of a concurrent 5S rRNA upregulation during the immediate early phase (6). Given the essential role of rRNAs in protein synthesis, as well as their use as loading controls in chlamydial gene expression studies, we expanded our rRNA expression analysis to encompass the entire developmental cycle.
Expression kinetics of pre- and mature rRNAs during the C. trachomatis developmental cycle. (A) Schematic presentation of C. trachomatis chromosomal rRNA gene organization and rRNA genesis. Scissor symbols indicate RNA cleavage at indicated sites. Arrows represent primers targeting specific sequences for amplifying pre-rRNA and mature rRNA. Lines below the arrows signify reverse transcription PCR products using different respective primer pairs. (A) (scheme of rRNA gene organization and rRNA maturation) was previously used in Wurihan et al. (6). (B) Temporal changes in rRNA levels from 0 to 40 hpi. Pre- and mature rRNAs were quantified via quantitative reverse transcription real-time PCR (qRT-PCR), utilizing primers indicated in (A). The expression level for each rRNA at 0 hpi was set at 1. Genome copy number data, obtained via qPCR, were used to normalize rRNA expression levels. (C) Proportional shifts of pre- and mature rRNAs from 0 to 40 hpi. qPCR was performed with genomic DNA as the template to determine the amplification efficiency of primer pairs targeting rRNAs. Proportions of individual rRNAs relative to the total rRNA pool were derived from the amplification efficiency-normalized copy numbers. (D) Copy numbers of rRNAs per cell from 0 to 40 hpi. (B, D) Data are averages ± standard deviations from biological triplicates.
We performed qRT-PCR analysis to determine the expression levels of rRNAs in C. trachomatis L2 (strain 434/BU) cultured in L929 cells (6). We employed three primer pairs, each amplifying sequences present in mature rRNAs and the pre-rRNA, and additional primer pair targeting only pre-rRNA (Fig. 1A). The expression levels of rRNAs at various developmental points relative to 0 hpi are presented in Fig. 1B. Notably, by 1 hpi, an early point in the EB-to-RB differentiation, the expression levels of pre-rRNA, 16S rRNA, and 23S rRNA surged by 180-fold, 2.1-fold, and 2.5-fold, respectively, compared to their baselines at 0 hpi (Fig. 1B). By the 3 hpi midpoint of primary differentiation, these levels further increased to 1,091-fold for pre-rRNA and 5.6-fold each for both 16S and 23S rRNAs (Fig. 1B). By 8 hpi, the onset of the logarithmic RB growth phase, the expression peaked at 5,243-fold for pre-rRNA, 59-fold for 16S rRNA, and 62-fold for 23S rRNA (Fig. 1B). Thereafter, the expression levels decreased progressively through 32 hpi and then stabilized through 40 hpi (Fig. 1B). 5S rRNA displayed an expression pattern similar to those of 16S and 23S rRNAs, but with a distinguishable feature: its level did not increase until 3 hpi (Fig. 1B).
Percentages of individual rRNAs out of the total (Fig. 1C) and copies of rRNAs per cell (Fig. 1D) both show that 5S rRNA is the most abundant rRNA at 0 and 1 hpi, suggesting that 5S rRNA carried over in EBs is slightly better preserved than 16S and 23S rRNAs. 23S rRNA remained the rate-limiting mature RNA throughout the developmental cycle. Fig. 1C and D also indicate that pre-rRNA maturation in C. trachomatis is highly efficient.
In summary, our observations demonstrate that the expression of rRNAs is intricately regulated in Chlamydia. Consequently, we recommend caution when using any rRNA as a loading control for chlamydial gene expression analysis.
Supplementary Material
Reviewer comments
The reference list from the paper itself. Each links out to its DOI / PubMed record.
- 1Kaczanowska M, Rydén-Aulin M. 2007. Ribosome biogenesis and the translation process in Escherichia coli. Microbiol Mol Biol Rev 71:477–494. doi:10.1128/MMBR.00013-07PMC 216864617804668 · doi ↗ · pubmed ↗
- 2Failmezger J, Ludwig J, Nieß A, Siemann-Herzberg M. 2017. Quantifying ribosome dynamics in Escherichia coli using fluorescence. FEMS Microbiol Lett 364. doi:10.1093/femsle/fnx 05528333278 · doi ↗ · pubmed ↗
- 3Elwell C, Mirrashidi K, Engel J. 2016. Chlamydia cell biology and pathogenesis. Nat Rev Microbiol 14:385–400. doi:10.1038/nrmicro.2016.30PMC 488673927108705 · doi ↗ · pubmed ↗
- 4Stephens RS, Kalman S, Lammel C, Fan J, Marathe R, Aravind L, Mitchell W, Olinger L, Tatusov RL, Zhao Q, Koonin EV, Davis RW. 1998. Genome sequence of an obligate intracellular pathogen of humans: Chlamydia trachomatis. Science 282:754–759. doi:10.1126/science.282.5389.7549784136 · doi ↗ · pubmed ↗
- 5Thomson NR, Holden MTG, Carder C, Lennard N, Lockey SJ, Marsh P, Skipp P, O’Connor CD, Goodhead I, Norbertzcak H, Harris B, Ormond D, Rance R, Quail MA, Parkhill J, Stephens RS, Clarke IN. 2008. Chlamydia trachomatis: genome sequence analysis of lymphogranuloma venereum isolates. Genome Res 18:161–171. doi:10.1101/gr.7020108 PMC 213478018032721 · doi ↗ · pubmed ↗
- 6Wurihan W, Wang Y, Yeung S, Zou Y, Lai Z, Fondell JD, Li WV, Zhong G, Fan H. 2024. Expression activation of over 70% of Chlamydia trachomatis genes during the first hour of infection. Infect Immun 92:e 0053923. doi:10.1128/iai.00539-23PMC 1092945938299827 · doi ↗ · pubmed ↗