Correction: Prevalence and risk factors for chronic kidney disease of unknown cause in Malawi: a cross-sectional analysis in a rural and urban population
Sophie A. Hamilton, Wisdom P. Nakanga, Josephine E. Prynn, Amelia C. Crampin, Daniela Fecht, Paolo Vineis, Ben Caplin, Neil Pearce, Moffat J. Nyirenda

Abstract
Genes, proteins, chemicals, diseases, species, mutations and cell lines named across the full text — each resolved to its canonical identifier and authoritative record.
Click any figure to enlarge with its caption.
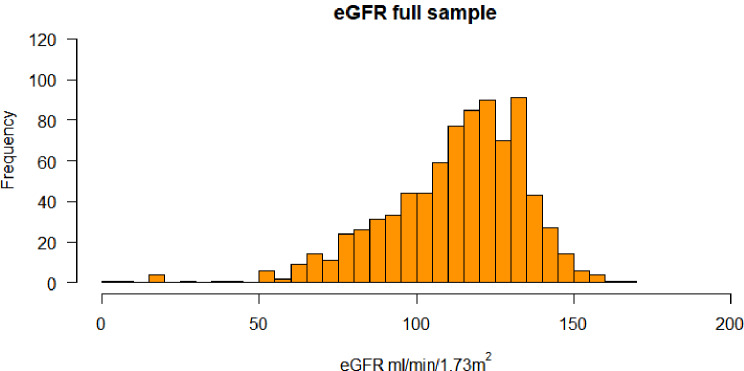 Figure 1
Peer Reviews
No public reviews on file for this paper yet. If you reviewed it on a platform where reviews are public (OpenReview, ICLR, NeurIPS, ICML), you can paste yours below so the community can read it here.
Videos
No videos yet. Explain this paper in a talk, walkthrough, or lecture? Add one.
Taxonomy
TopicsHealthcare Systems and Reforms · Global Public Health Policies and Epidemiology · Healthcare cost, quality, practices
Correction to: BMC Nephrology (2020) 21:387 10.1186/s12882-020-02034-x
Following publication of the original article [1], the authors identified some errors in Abstract, Tables 1, 2 and 3; Fig. 3 and Supplementary files – correcting an error in the calculation of the eGFR in the published version of the paper.
NB: although these corrections mean that the numbers for the eGFR analyses (e.g. eGFR < 60) have changed, the main findings of the paper have not changed.
Also, the authors wanted to have removed the following sentence under the section “urban rural comparison of eGFR”
Due to the small proportion of participants in the eGFR < 90 category in the urban population, we could not conduct logistic regression analyses for Area 25.
Corrected Abstract
Background
An epidemic of chronic kidney disease of unknown cause (CKDu) is occurring in rural communities in tropical regions of low-and middle-income countries in South America and India. Little information is available from Southern African countries which have similar climatic and occupational characteristics to CKDu-endemic countries. We investigated whether CKDu is prevalent in Malawi and identified its potential risk factors in this setting.
Methods
We conducted a cross-sectional study from January–August 2018 collecting bio samples and anthropometric data in two Malawian populations. The sample comprised adults > 18 years (n = 821) without diabetes, hypertension, and proteinuria. Estimates of glomerular filtration rate (eGFR) were calculated using the CKD-EPI2009 equation. Linear and logistic regression models were applied with potential risk factors, to estimate risk of reduced eGFR.
Results
The mean eGFR was 112.3 ± 22.9 ml/min per 1.73m^2^ and the mean participant age was 33.5 ± 12.7 years. The prevalence of eGFR < 60 was 2.1% (95% confidence interval (95% CI) 1.2, 3.2); the prevalence of eGFR < 90 was 16.1% (95% CI = 13.6, 18.7). We observed a higher prevalence of eGFR < 90 in the urban population (21.8% (16.8, 27.5)), versus rural (13.7% (10.9, 16.7)). Age was associated with increased risk of eGFR < 90 [Odds ratio (OR) (95%CI) = 1.79 (1.53, 2.13) per ten-year increment]. Lower risk of eGFR < 90 was observed for rural participants [OR (95%CI) = 0.43 (0.24, 0.79)].
Conclusions
Reduced kidney function consistent with the definition of CKDu is not common in the areas of Malawi sampled, compared to that observed in other tropical or sub-tropical countries in Central America and South Asia. Reduced eGFR < 90 was related to age and was more common in urban areas. These findings are important as they contradict some current hypothesis that CKDu is endemic across tropical and sub-tropical countries. This study has enabled standardized comparisons of impaired kidney function between and within tropical/subtropical regions of the world and will help form the basis for further etiological research, surveillance strategies, and the implementation and evaluation of interventions.
Corrected Tables
Table 1. Sociodemographic and anthropometric characteristics of study participants without diabetes, hypertension, and heavy proteinuria) n = 821VariableeGFReGFR Categories, n(%)^b^N = 821N = 17N = 115N = 689 N (%) ^a^
Mean (SD)
< 60 ≥ 60,** < 90** ≥ 90
Age < 2060 (7)129.2 (21.4)1 (1.7)1 (1.7)58 (96.7)20–29312 (38)120.1 (21.5)4 (1.3)33 (10.6)275 (88.1)30–39232 (28)110.9 (20.6)6 (2.6)25 (10.8)201 (86.6)40–49130 (16)102.7 (19.0)3 (2.3)27 (20.7)100 (76.9)50–5946 (6)97.7 (14.2)010 (21.7)36 (78.3)60+41 (5)83.1 (17.4)3 (7.3)19 (46.3)19 (46.3) Sex Female504 (61)111.8 (23.6)14 (2.8)70 (13.9)420 (83.3)Male317 (39)113.1 (21.7)3 (0.95)45 (14.1)269 (84.8) Area Urban (Area 25)243 (29)110.4 (23.9)7 (2.9)46 (18.9)190 (78.1)Rural (Bonje)578 (71)113.1 (22.4)10 (1.7)69 (11.9)499 (86.3) Education (years) ≤ 559 (7)104.6 (22.9)1 (1.7)17 (28.8)41 (69.5)> 5 ≤ 10301 (36)112.1 (23.4)8 (2.7)35 (11.6)258 (85.7)> 10461 (56)113.4 (22.4)8 (1.7)63 (13.7)390 (84.6) Occupation Agricultural worker383 (47)109.9 (20.8)7 (1.8)48 (12.5)328 (85.6)Non-agricultural worker438 (53)114.3 (24.4)10 (2.3)67 (15.3)361 (82.4) Household monthly income (MK) ^c^ Unknown17 (1)113.2 (32.0)1 (5.9)1 (5.9)15 (88.2)MK 0 ≤ 20,000406 (50)113.7 (22.7)7 (1.7)53 (13.1)346 (85.2)MK > 20,000398 (49)110.8 (22.6)9 (2.3)61 (15.3)328 (82.4) Healthy lifestyle choices Non-smoker/never drink alcohol630 (77)111.8 (23.3)16 (2.6)86 (13.7)528 (83.8)Smoker/alcohol drinker191 (23)113.7 (21.3)1 (0.5)29 (15.2)161 (84.3) Regular meat eater Yes621 (76)111.3 (23.5)14 (2.3)87 (14.0)520 (83.7)No200 (24)112.6 (21.0)3 (1.5)28 (14.0)169 (84.5) Body mass index (kg/m ^2^ ) Underweight (≤ 18.5)45 (6)118.0 (22.9)08 (17.8)37 (82.2)Normal (> 18.5 - ≤ 25)545 (66)113.9 (22.2)8 (1.5)72 (13.2)465 (85.3)Overweight (> 25 - ≤30)177 (22)108.4 (22.5)4 (2.3)25 (14.1)148 (83.6)Obese (> 30)54 (7)104.3 (27.4)5 (9.3)10 (18.5)39 (72.2) Fat-free mass (kg) 1st tertile (≤ 37)124 (15)112.7 (19.3)017 (13.7)107 (86.3)2nd tertile (> 37 - < 45)354 (43)111.3 (24.5)9 (2.5)57 (16.1)288 (81.4)3rd tertile (≥ 45)343 (42)111.3 (22.4)8 (2.3)41 (11.9)294 (85.7) HIV status Positive3 (0.4)109.7 (21.7)01 (33.3)2 (66.6)Negative595 (73)112.3 (21.8)11 (1.8)75 (12.6)509 (85.5)Unknown223 (27)112.2 (25.8)6 (2.7)39 (17.5)178 (79.8)apercentage in columnsbpercentage in rowscExchange rate (MK to USD) 0.001 at time of questionnaire
Table 2. Associations between sociodemographic and anthropometric characteristics and eGFR < 90 in participants without diabetes, hypertension, proteinuria, n = 821Model 1 minimal adjustmentModel 2 full adjustmentModel 3 minimal adjustmentModel 4 full adjustmenteGFReGFReGFR < 90eGFR < 90VariableCoefficient (95%CI)^a^Coefficient (95%CI)^b^Coefficient (95%CI)^a^Coefficient (95%CI)^b^ Age (per 10-year increase) ^c^ -9.07 (-10.17, -7.98)-9.20 (-10.44, -7.97)1.77 (1.54, 2.06)1.79 (1.53, 2.13) Sex ^d^ Male1.57 (-1.23, 4.38)0.45 (-2.85, 3.76)0.85 (0.56, 1.28)0.90 (0.55, 1.49)FemaleRef.Ref.Ref.Ref. Study area Urban (Area 25)Ref.Ref.RefRef.Rural (Bonje)7.39 (4.34, 10.44)7.47 (3.43, 11.52)0.37 (0.24, 0.57)0.43 (0.24, 0.79) Education (years) ≤ 55.27 (-0.53, 11.09)5.04 (-0.84, 10.93)1.13 (0.53, 2.34)1.08 (0.50, 2.27)> 5 ≤ 101.16 (-2.00, 4.33)1.20 (-1.99, 4.41)0.87 (0.54, 1.41)0.87 (0.53, 1.41)> 10Ref.Ref.Ref.Ref. Occupation Agricultural worker-1.05 (-4.59, 2.47)-1.07 (-4.65, 2.51)0.69 (0.41, 1.21)0.69 (0.40, 1.21)Non-agricultural workerRef.Ref.Ref. Household monthly income (MK) ^e^ Unknown-1.86 (-11.57, 7.84)-2.95 (-12.75, 6.83)0.73 (0.11, 3.04)0.80 (0.11, 3.35)MK 0 ≤ 20,0000.10 (-2.99, 3.20)-0.36 (-3.54, 2.80)1.21 (0.77, 1.94)1.29 (0.81, 2.11)MK > 20,000Ref.Ref.Ref.Ref. BMI (kg/m ^2^ ) Per 5 kg increase-1.64(-3.48, 0.20)-1.59 (-3.45, 0.27)1.09 (0.85, 1.39)1.10 (0.86, 1.42) Fat-free mass Per 5 kg increase-0.02 (-0.10, 0.05)-0.01 (-0.10, 0.06)0.99 (0.93, 1.01)0.99 (0.00, 1.01) Healthy lifestyle choices Non-smoker or alcohol drinker-2.43 (-5.97, 1.10)-2.34 (-5.92, 1.22)1.02 (0.62, 1.73)1.00 (0.60, 1.71)Smoker and alcohol drinkerRef.Ref.Ref.Ref.Regular meat eaterYes-0.35 (-2.91, 3.62)-0.29 (-3.04, 3.63)0.90 (0.55, 1.44)0.91 (0.55, 1.48)NoRef.Ref.Ref.Ref.Hypertension = systolic bp ≥ 140 mmHg, or diastolic bp ≥ 90 mmHg; Diabetes = fasting glucose > = 7 mg/l; Proteinuria = ACR > = 30 mg/mmol^a^minimal adjustment for age, sex and area^b^all variables mutually adjusted^c^adjusted for sex and area^d^adjusted for age and area^e^Exchange rate (MK to USD) 0.001 at time of questionnaire
Table 3. Associations between sociodemographic and anthropometric characteristics and estimated glomerular filtration rate (eGFR) (fully adjusted) after removal of those with hypertension, diabetes and proteinuria, Area 25 (n = 243) and Bonje (n = 578)BonjeBonjeArea 25Area 25Model 1Model 2Model 3Model 4VariableeGFReGFR group (< 90)eGFReGFR group (< 90)Coefficient (95%CI)^a^Coefficient (95%CI)^b^Coefficient (95%CI)^a^Coefficient (95%CI)^b^ Age (per 10-year increase) ^c^ -9.42 (-10.71, -8.14)1.81 (1.50, 2.22)-7.99 (-11.48, -4.50)1.73 (1.22, 2.51) Sex ^d^ Male0.58 (-3.25, 4.43)1.05 (0.53, 2.21)-0.76 (-7.46, 5.93)0.81 (0.37, 1.72)FemaleRef.Ref.Ref.Ref. Education (years) ≤ 54.34 (-1.89, 10.58)1.16 (0.46, 2.81)8.97 (-6.02, 23.97)0.70 (0.12, 3.05)> 5 ≤ 101.88 (-1.45, 5.23)0.66 (0.37, 1.20)-3.05 (-11.92, 5.82)1.89 (0.78, 4.45)> 10Ref.Ref.Ref.Ref. Occupation Agricultural worker-1.03 (-4.47, 2.40)0.68 (0.38, 1.23)5.81 (-21.09, 32.71)0.68 (0.03, 8.22)Non-agricultural workerRef.Ref.Ref.Ref. Household monthly income (MK) ^e^ Unknown-8.33 (-20.50, 3.82)1.08 (0.05, 7.34)3.90 (-13.64, 21.44)0.89 (0.04, 5.88)MK 0 ≤ 20,000-1.07 (-4.39, 2.25)1.28 (0.74, 2.28)2.98 (-5.62, 11.59)1.25 (0.45, 3.20)MK > 20,000Ref.Ref.Ref.Ref. BMI (kg/m ^2^ ) Per 5 kg increase-1.46 (-3.69, 0.75)1.33 (0.94, 1.93)-2.03 (-5.59, 1.53)0.93 (0.64, 1.35) Fat-free mass Per 5 kg increase-0.02 (-0.11, 0.07)0.98 (0.00, 1.01)0.01 (-0.16, 0.16)0.99 (0.00, 1.02) Healthy lifestyle choices Non-smoker or alcohol drinker-2.37 (-6.55, 1.80)1.00 (0.50, 2.05)-3.13 (-10.41, 4.13)1.05 (0.16, 1.57)Smoker and alcohol drinkerRef.Ref.Ref.Ref. Regular meat eater Yes-0.13 (-3.57, 3.30)1.06 (0.60, 1.86)-3.31 (-6.56, 13.20)0.55 (0.47, 2.54)NoRef.Ref.Ref.Ref.Hypertension = systolic bp ≥ 140 mmHg, or diastolic bp ≥ 90 mmHg; Diabetes = fasting glucose > = 7 mg/l; Proteinuria = ACR > = 30 mg/mmol^a^minimal adjustment for age and sex^b^all variables mutually adjusted^c^adjusted for sex and area^d^adjusted for age and area^e^Exchange rate (MK to USD) 0.001 at time of questionnaire
Fig. 3. Histogram of eGFR distribution in the sample population